Jellyfish galaxy candidates in MACS J0717.5+3745 and 39 other clusters of the DAFT/FADA and CLASH surveys
Abstract
Context. Galaxies in clusters undergo several phenomena, such as ram pressure stripping and tidal interactions, that can trigger or quench their star formation and, in some cases, lead to galaxies acquiring unusual shapes and long tails - some become jellyfish.
Aims. We searched for jellyfish galaxy candidates in a sample of 40 clusters from the DAFT/FADA and CLASH surveys covering the redshift range . In MACS J0717.5+3745 (MACS0717), our large spatial coverage and abundant sampling of spectroscopic redshifts allowed us to pursue a detailed analysis of jellyfish galaxy candidates in this cluster and its extended filament.
Methods. We retrieved galaxy spectroscopic redshifts in the NASA Extragalactic Database for galaxies in all the clusters of our sample (except for MACS0717 for which we had an extensive catalogue), looked at the Hubble Space Telescope ACS images of these objects (mainly the F606W and F814W bands), and classified them as a function of their likeliness to be jellyfish galaxies. We give catalogues of jellyfish galaxy candidates with positions, redshifts, magnitudes, and projected distance to their respective cluster centre. For MACS0717, an eight-magnitude optical and infrared catalogue covering the entire region allowed us to compute the best stellar population fits with LePhare through the GAZPAR interface. For the 31 jellyfish candidates in the other clusters belonging to the CLASH survey, we extracted up to 17 magnitudes available in the CLASH catalogues to fit their spectral energy distribution in the same way.
Results. We found 81 jellyfish galaxy candidates in the extended region around MACS0717 as well as 97 in 22 other clusters. Jellyfish galaxy candidates in MACS0717 tend to avoid the densest regions of the cluster, while this does not appear to be the case in the other clusters. The best fit templates found by LePhare show that star formation is occurring. Stellar masses are in the range M⊙, and the star formation rates (SFRs) are in the M⊙ yr-1 range for MACS0717 and in the M⊙ yr-1 range for the other sample. Specific star formation rates (sSFR) are notably higher in MACS0717, with more than half of the sample having values larger than yr-1, while in the other clusters, most galaxies have sSFR yr-1. Stellar populations appear younger in MACS0717 (more than half have an age smaller than yrs), and following mid-infrared criteria two galaxies may contain an AGN. In a SFR versus stellar mass diagram, jellyfish galaxy candidates appear to have somewhat larger SFRs than “non-jellyfish star forming” galaxies. For MACS0717, the mean sSFR of the 79 jellyfish galaxy candidates is 3.2 times larger than that of star-forming non jellyfish galaxies (selected with log(sSFR)).
Conclusions. Our jellyfish galaxy candidates are star forming objects, with young ages and blue colours. Based on several arguments, the jellyfish candidates identified in MACS0717 seem to have fallen rather recently into the cluster. A very rough estimate of the proportions of jellyfish galaxies in the studied clusters is about 10%, and this number does not seem to vary strongly with the cluster relaxation state, though this result must be confirmed with more data. Our sample of 97 galaxies in 22 clusters represents the basis of future works.
Key Words.:
clusters: galaxies, clusters: individual: MACS J0717+3745, galaxies: star formation1 Introduction
Due to the high density of galaxies found in clusters and to the presence of hot X-ray emitting gas, cluster galaxies are subject to environmental mechanisms that do not affect significantly their field counterparts. The most important ones are ram pressure stripping (Gunn & Gott, 1972), hereafter RPS, which affects the gas contained in galaxies, and tidal effects which affect both gas and stars and often lead to harrassment (Moore et al., 1996). A nice summary of all the physical processes taking place in clusters can be found in e.g. the introduction of Poggianti et al. (2017b) and will not be repeated here. We will here concentrate on the description of observations performed these last 15 years by various teams. Galaxies with unusual shapes and star forming properties have been found in many galaxy clusters, mostly at optical wavelengths, but with some features (mainly long tails) that are also sometimes detected in X-rays and/or at radio wavelengths. The number and depth of analyses of such objects have been increasing tremendously these last few years, in particular with the advent of VLT/MUSE (see below). To our knowledge, the first one to name some of these objects « jellyfish galaxies » was Bekki (2009).
Owen et al. (2006) studied the very rich merging cluster Abell 2125 (z=0.247) at several wavelengths, and found galaxy C153 showing an X-ray plume with [OII] emission in knots, interpreted as due to ram pressure stripping. The spectral energy distribution (SED) of C153 shows that it has undergone continuous star formation for 3.5 Gyr, further supporting that it can be considered a prototype jellyfish galaxy, even if not named as such. Sun et al. (2007) found ESO137-001 in the massive cluster Abell 3627 (z=0.01625) with a 40 kpc H tail coinciding with a 70 kpc X-ray tail. The H emission of the galaxy itself is sharply truncated, and 49 emission line knots are distributed along the tail over 39 kpc. These authors attribute the origin of the tail to ram pressure stripping, and mention that heat conduction may contribute to the energy of the optical lines. Cortese et al. (2007) found two peculiar galaxies falling into the massive galaxy clusters Abell 1689 (z = 0.18) and Abell 2667 (z = 0.23). Their Hubble Space Telescope (HST) images show extraordinary trails composed of bright blue knots (with absolute magnitudes in the range M ) and stellar streams associated with each of these systems, one of them experiencing a strong burst of star formation (SF) while the other has recently ceased its SF activity. They interpret these results as due to the combined action of tidal interaction with the cluster potential and ram pressure stripping. Yoshida et al. (2008) detected a string of ”fireballs” (star-forming clouds with a linear stream of young stars extending towards the galaxy, detected in H) in the Coma cluster, ”hanging” from galaxy RB 199. They showed that tidal effects alone could not account for the formation of such fireballs while the ram pressure stripping mechanism could provide a good explanation. In the optical and UV, Smith et al. (2010) observed 13 asymmetric star forming galaxies in the Coma cluster, due to star formation from the gas stripped from the galaxies by interaction with their environment, and long tails reaching 100 kpc. Also in Coma, Yagi et al. (2010) found extended H clouds in 14 galaxies at the edges of the cluster, suggesting that the parent galaxies have a large velocity with respect to the Coma cluster.
Rawle et al. (2014) analysed star formation in 53 galaxies of Abell 2744 (z=0.308), including some jellyfish galaxies. They found that the orientations of the trails, and of the material stripped from constituent galaxies, indicated that the passing shock front of the cluster merger was the trigger. Ebeling et al. (2014) searched for extreme cases of jellyfish galaxies at with HST Snapshots, and found six very bright objects with . They proposed a classification of jellyfish galaxies, from J=1 (mildly affected) to J=5 (very strongly affected) that is now commonly used. This paper was followed by several others. McPartland et al. (2016) studied 63 MACS clusters, and found many more jellyfish galaxies (but with no measured redshifts), showing the presence of optical tails. Their comparison to a simple model showed that extreme RPS events are associated to cluster mergers rather than to infall along filaments, even though these do occur too. Kalita & Ebeling (2019) then detected a showcase jellyfish galaxy in Abell 1758N and analysed it in detail, with [OII] emission up to 40 kpc. Ebeling & Kalita (2019) analysed the field of Abell 1758N (z=0.28) and detected 8 RPS jellyfish candidates undergoing intense SF.
The first paper describing observations of jellyfish galaxies with VLT/MUSE was that of Fumagalli et al. (2014) on ESO 137-001 (z=0.01625). They detected a double tail reaching 80 kpc, seen previously in X-rays, and inferred that the galaxy is falling radially into the massive Norma cluster. A complementary study with APEX (Jáchym et al., 2014) had already uncovered an exceptionally long molecular tail in this galaxy; follow-up observations with ALMA (Jáchym et al., 2019) allowed detecting, for the first time, the molecular gas at the heads of several ”fireballs” located in the complex tail structure of this spectacular galaxy.
Poggianti et al. (2016) published the first analysis of several hundred jellyfish galaxies at low redshift, based on the WINGS + OMEGAWINGS sample, selecting galaxies with various asymmetric/disturbed morphologies and knots, suggestive of triggered SF. This team then obtained a large observing program on VLT/MUSE : the GAs Stripping Phenomena survey (GASP, Poggianti et al., 2017b). In this first paper of a long series, they show MUSE results on the massive galaxy JO206 (z=0.0513), which is undergoing RPS in a poor cluster and shows a 90 kpc tail. This paper has been followed by many others, out of which we only quote a few. Bellhouse et al. (2019) analysed the 94 kpc long tails of JO201 in Abell 85. George et al. (2019) analysed the galaxy JO201 and showed that this galaxy, which is falling into Abell 85, is located close to the cluster centre, and undergoes both RPS and AGN feedback. Radovich et al. (2019) analysed seven jellyfish galaxies and highlighted the importance of outflows. Poggianti et al. (2019) achieved a very complete study of JW100 with MUSE and also ALMA, VLA, UVIT, and Chandra, and studied the influence of gas stripping, gas heating and AGN. They propose that ISM heating due to interaction with the intracluster medium is responsible for the X-ray tail. Moretti et al. (2020) analysed ALMA observations of the jellyfish galaxy JW100, and detected a large amount of molecular gas, 30% of which is located in the stripped gas tail out to 5 kpc from the galaxy center. They interpreted this molecular gas, which within the disk is totally displaced relatively to the stellar component, as newly born from stripped HI gas or recently condensed from stripped diffuse molecular gas.
Another interesting result of the GASP survey, obtained to our knowledge for the first time, is that found by Vulcani et al. (2019), who observed four field galaxies with increased SF and tattered H, making them appear similar to some of our jellyfish galaxies, although they are not members of any cluster. They attributed this increased SF to the effect of cosmic web filaments (none of the galaxies is in a cluster, three are in small groups, and all are embedded in a filament).
At higher redshift, VLT/MUSE results were also obtained by Boselli et al. (2019), who undertook a spectroscopic survey at redshift 0.25 ¡ z ¡ 0.85 in groups and clusters (the MAGIC survey: MUSE gAlaxy Groups In Cosmos, Epinat et al., in prep.). They detected two star-forming galaxies in the COSMOS cluster CGr32 at z = 0.73 with two extended (up to kpc in projected distance) tails of ionised gas without any stellar counterpart in the deep optical images.
All these studies are devoted to the observations of rather small numbers of jellyfish galaxies per cluster. On the other hand, Roman-Oliveira et al. (2019) observed a large number of jellyfish galaxies (73, out of which they discarded three that were probably interacting galaxies) in a single zone: the multi-cluster system Abell 901/902 (z=0.165). In particular, they showed that the starburst phenomenon increases with jellyfish class.
As far as numerical simulations on these specific objects are concerned, Bekki (2009) made hydrodynamical simulations to study the effect of RPS on galaxies in clusters and, to our knowledge, was the first to use the term « jellyfish ». His simulated galaxies look very much like the jellyfish galaxies that are observed. More recently, Ruggiero et al. (2019) published hydrodynamical simulations to model the four structures observed in Abell 901/902 by Roman-Oliveira et al. (2019). They showed that many (but not all) jellyfish galaxies are located in the vicinity of ram pressure boundaries, defined as regions where gas moving along each subcluster and gas from the remainder of the system meet. Galaxies become jellyfish when they cross a boundary within their parent subcluster, where a significant pressure increase takes place, due to the merging of the cluster gas and subcluster gas. A significant amount of jellyfish galaxies must be created by this mechanism. We can also mention the model by Safarzadeh & Loeb (2019) accounting for SF due to RPS. According to their results, jellyfish galaxies must be late infallers for their model to work, and they predict no jellyfish galaxies to be present at short clustercentric distances (smaller than (0.3-0.4) R200, see their Fig . 3).
We present here a search for jellyfish galaxy candidates in HST images available for clusters of the DAFT/FADA111http://cesam.lam.fr/DAFT/index.php and CLASH222https://archive.stsci.edu/prepds/clash/ surveys. Though a number of such objects have been detected and thoroughly analysed these last years (as discussed before), the number of jellyfish galaxies at medium redshift is still limited, and our aim here is to increase this number in the redshift range . For the cluster MACS J0717.5+3745 (hereafter MACS0717) we have a large spectroscopic redshift catalogue that allows us to search for jellyfish galaxies not only in the cluster core but also in its extended filament (Jauzac et al., 2012, 2018b; Durret et al., 2016; Martinet et al., 2016). This will allow a detailed study of the distribution of jellyfish galaxy candidates in this extended environment. For the other clusters, our method will not allow us to make a statistical study since the redshift coverage of the clusters is by no means complete, but it is a first step towards the study of these interesting objects, in particular those at relatively high redshift, and therefore closer to the redshift of cluster formation. The list of new jellyfish galaxy candidates proposed here will hopefully be exploited later at various wavelengths by us or others.
The paper is organized as follows. We describe our initial sample of 40 clusters and the method we apply in Section 2. We give our catalogue of 81 jellyfish candidates in the extended region of MACS0717 in Section 3, and discuss their spatial distribution and colour. The 97 jellyfish candidates in 22 other clusters (there are 17 clusters in which we found no jellyfish galaxy) are presented in Section 4. The spectral energy distribution and derived quantities (such as stellar mass, star formation rate, etc.) of all the jellyfish candidates are analysed in Section 5. Finally, we summarise and discuss our results and propose some conclusions in Sect. 6.
All distances are computed with Ned Wright’s calculator333http://www.astro.ucla.edu/w̃right/CosmoCalc.html, assuming H km s-1 Mpc-1, and . Magnitudes are quoted in AB system.
2 Galaxy sample and identification of jellyfish candidates
2.1 Selection of jellyfish candidates
We have considered 40 clusters from the DAFT/FADA and CLASH surveys, which were all selected to be massive clusters (M M⊙ for DAFT/FADA, and kT keV, corresponding to a mass in the M⊙ range, for CLASH). For all clusters except MACS0717, we retrieved from NED444https://ned.ipac.caltech.edu/ all galaxy spectroscopic redshifts available in the regions covered by the HST images. The cluster list is given in Table 1. The cluster redshift range covered is . For MACS0717, the large spectroscopic redshift catalogue available covers not only the cluster core but its extended filament as well, so we dedicate an important part of this paper to its study. The redshift coverage in most clusters is quite homogeneous.
For each cluster, we identify galaxies with spectroscopic redshifts in the range previously chosen to draw galaxy density maps (Durret et al., 2016, 2019), and roughly corresponding to an interval of around the corresponding cluster redshift. This translates into a velocity range indicated in Table 1 for each cluster, expressed in units of the corresponding cluster velocity dispersion (computed in Section 2.3). We can thus see that the redshift interval first chosen by Durret et al. (2016) is somewhat limited in some cases, and could make us miss fast moving galaxies. In particular for MACS0717, to which a large part of this paper is dedicated, this strategy would limit our analysis to a range of (see Fig. 5 of Durret et al. (2016), initial value). We thus decided to extend the redshift interval of this cluster to (final value reported in the same Table), the sole system where we have a large enough spectroscopic and spatial coverage allowing for a more detailed analysis than what is possible for the remaining clusters.
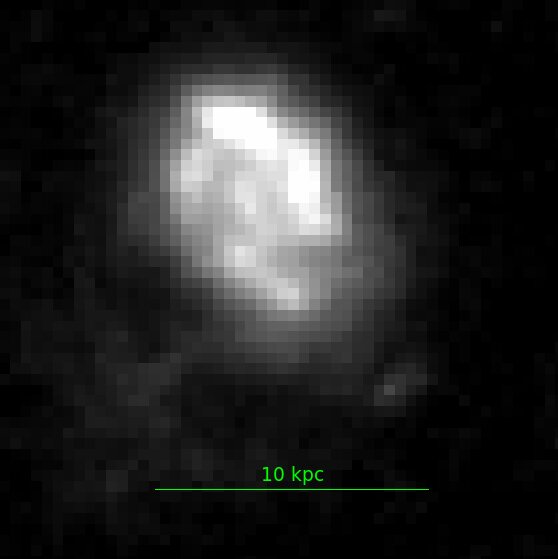
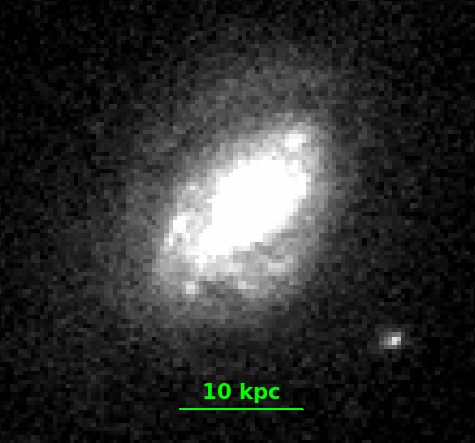
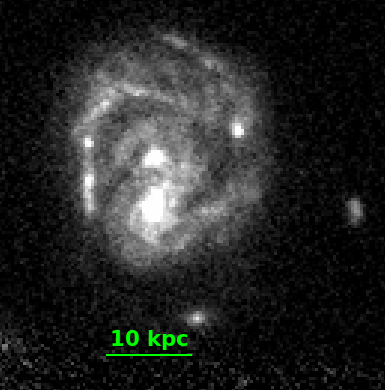
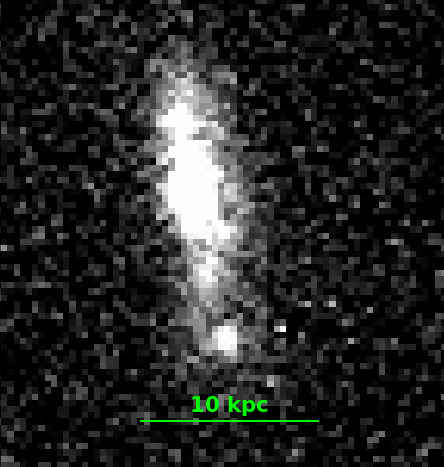
Two of us (FD and SC) separately looked at each of the selected galaxies, searching for objects that could be classified as jellyfish galaxy candidates, based on several criteria: asymmetry, tidal arms, star trails. We independently classified them between J=1 and J=5 according to their probability of being a jellyfish, as suggested by Ebeling et al. (2014): J=1 being the smallest confidence index and J=5 the largest. In most cases, our classifications agreed within , but we prefer to give both classifications, in Tables 2 and 3, to illustrate the relative difficulty of eye classification. We nonetheless favored eye classification since jellyfish galaxies cover a large variety of shapes, making it difficult to automatize their identification. Out of the 40 clusters considered, there were 17 in which we detected no jellyfish candidate. This is probably due to the fact that in some clusters we only have a small number of redshifts within the imaged area, and in those clusters none of the galaxies with a measured redshift entered this category. We are therefore left with a sample of jellyfish candidates in 22 cluster fields (besides MACS0717).
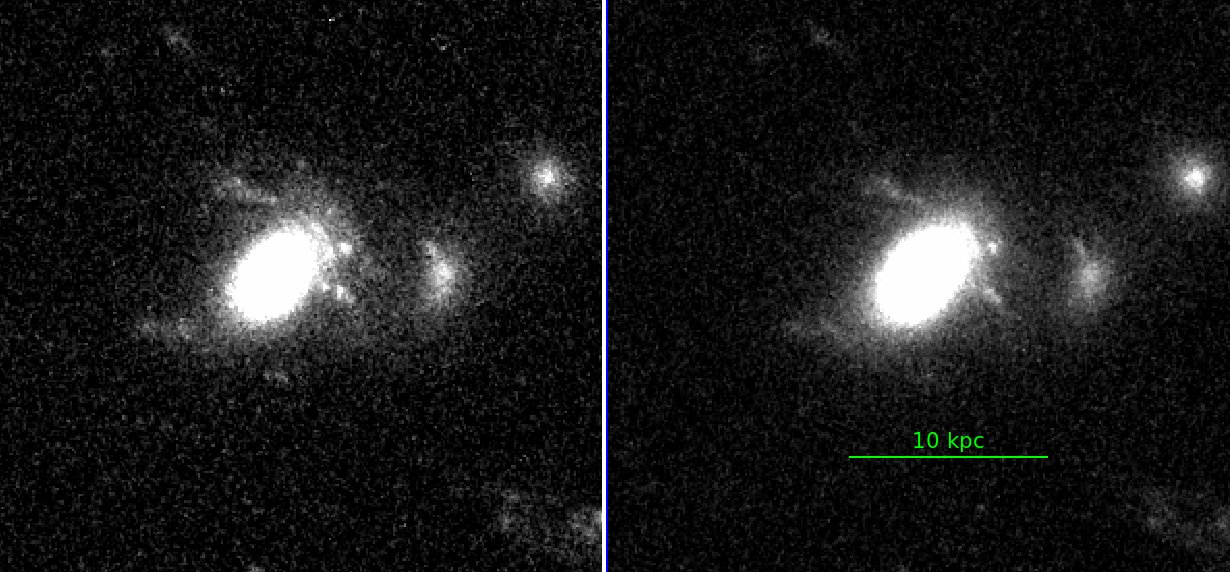
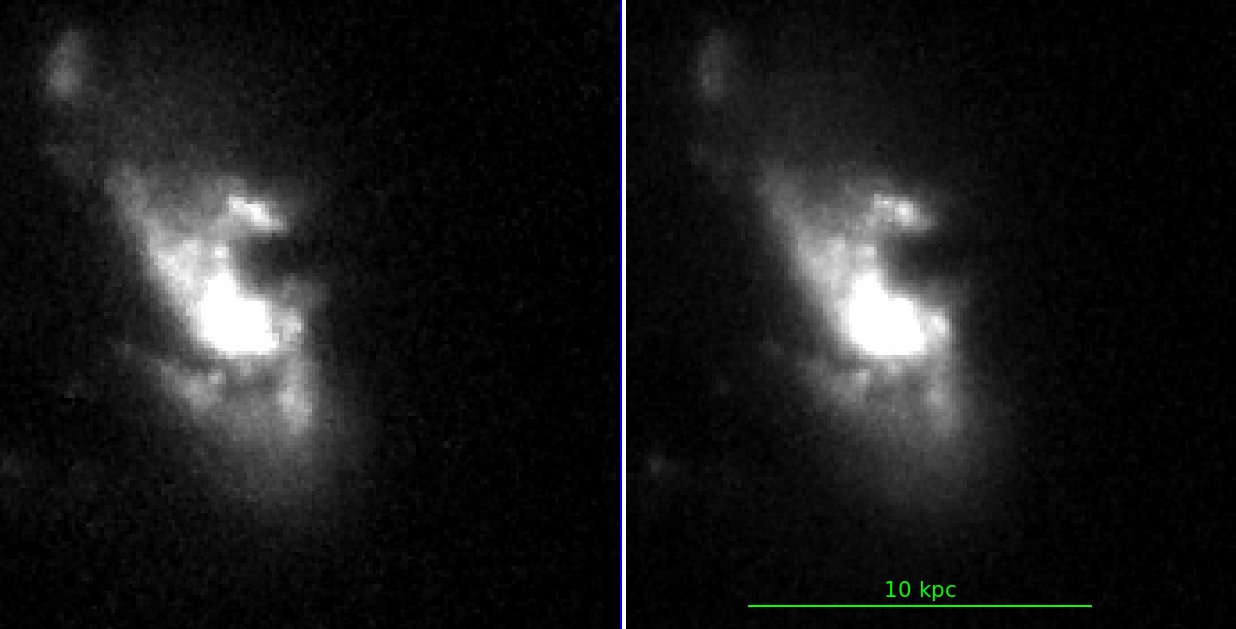
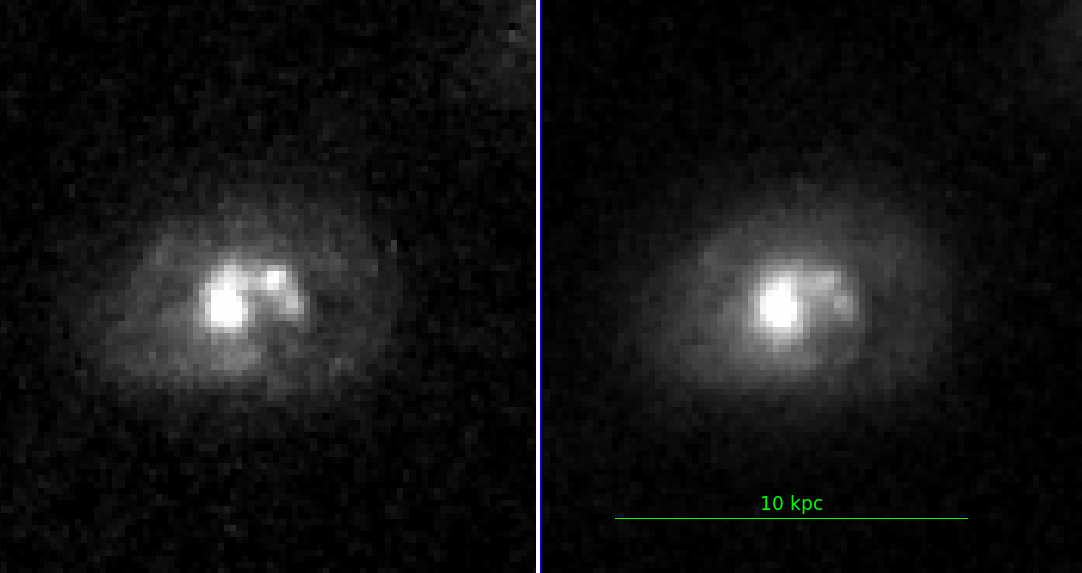
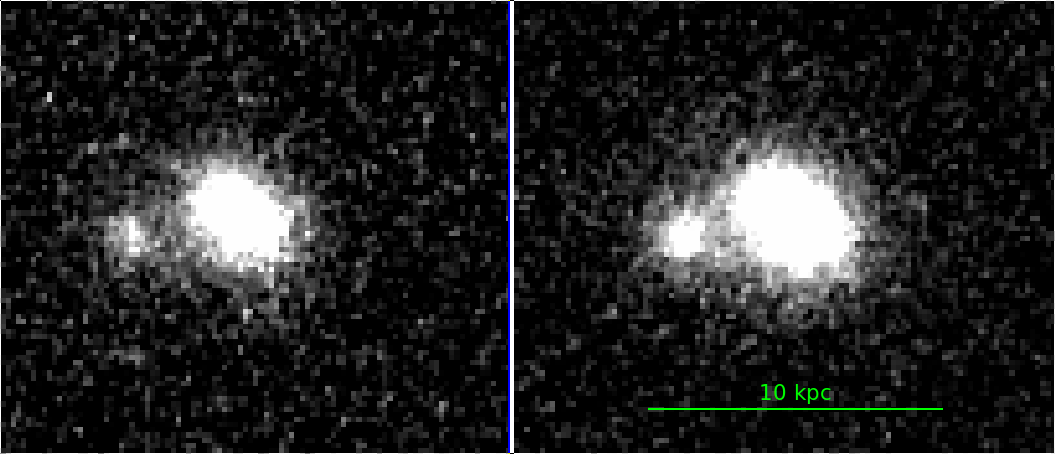
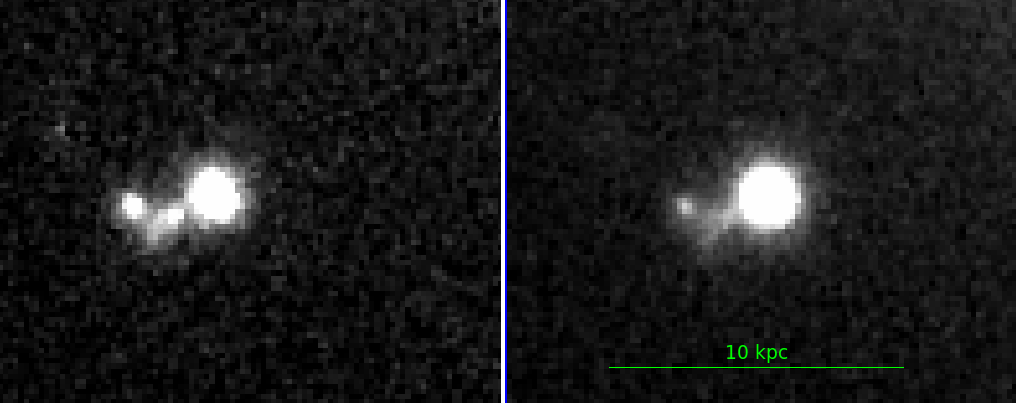
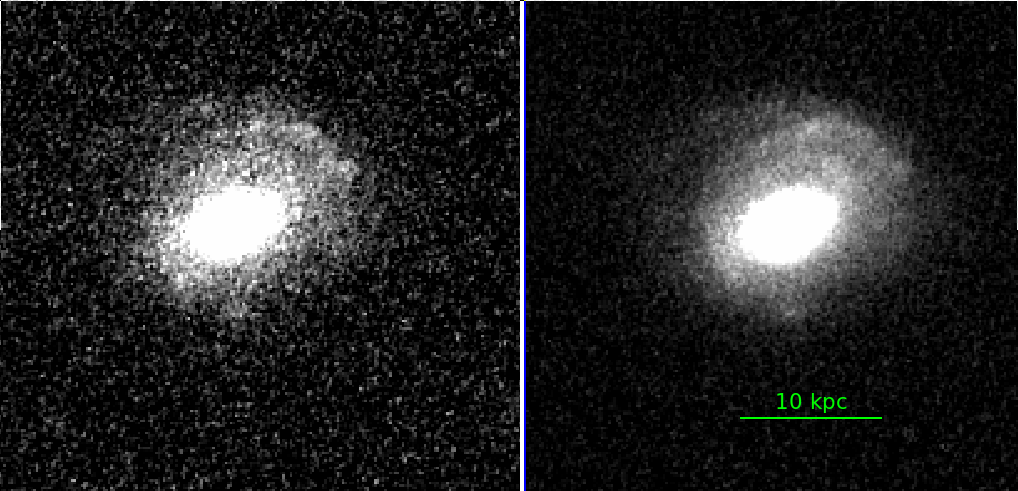
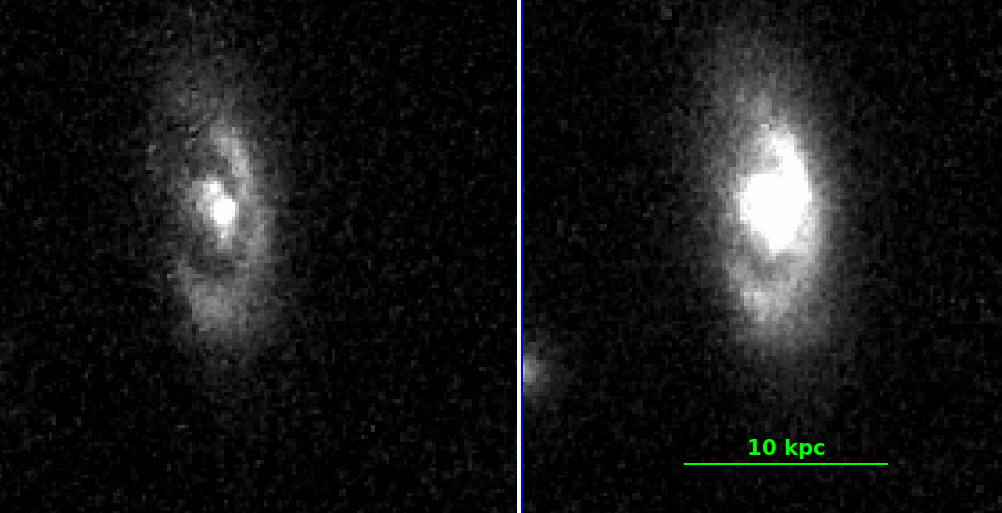
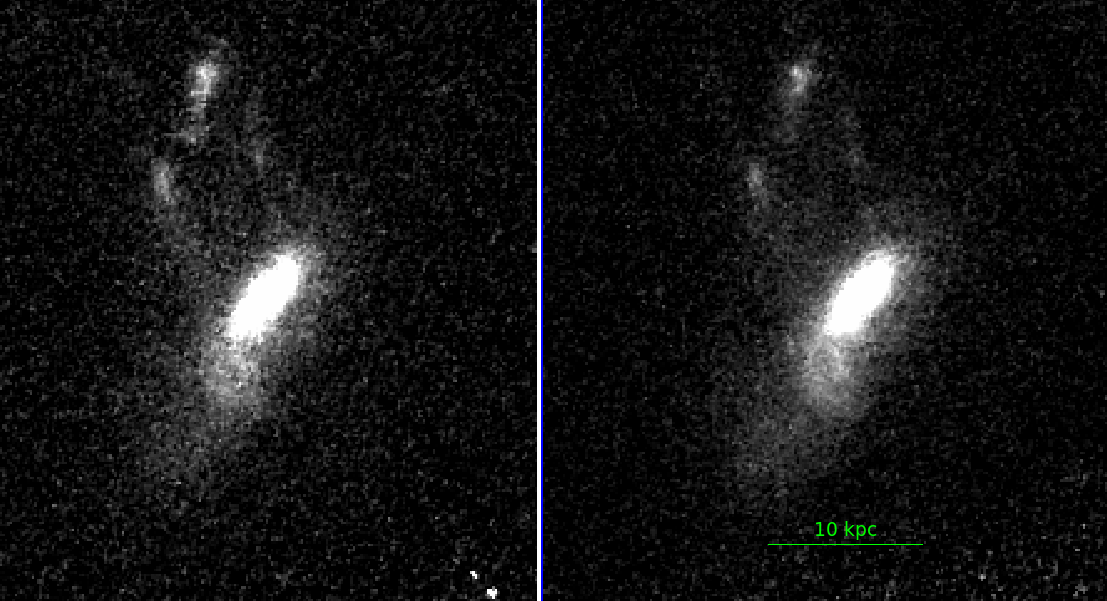
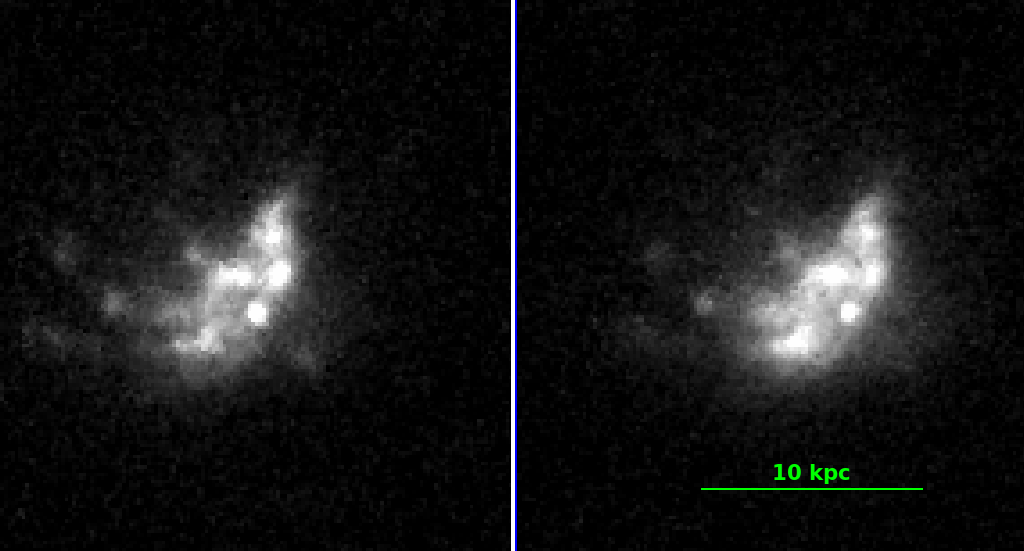
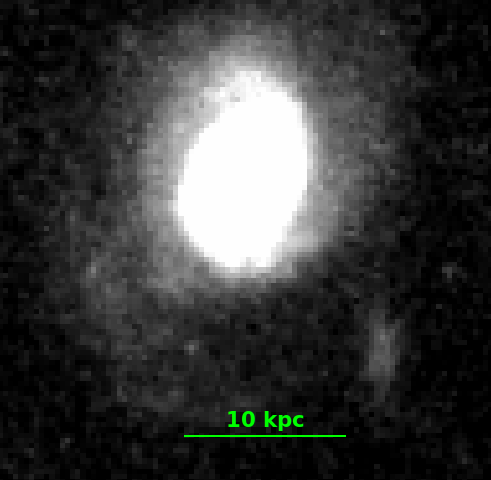
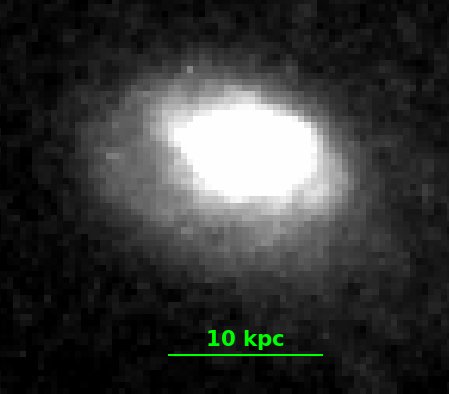
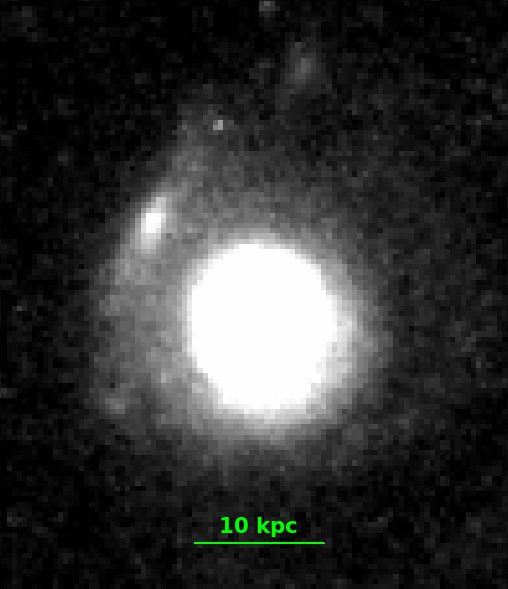
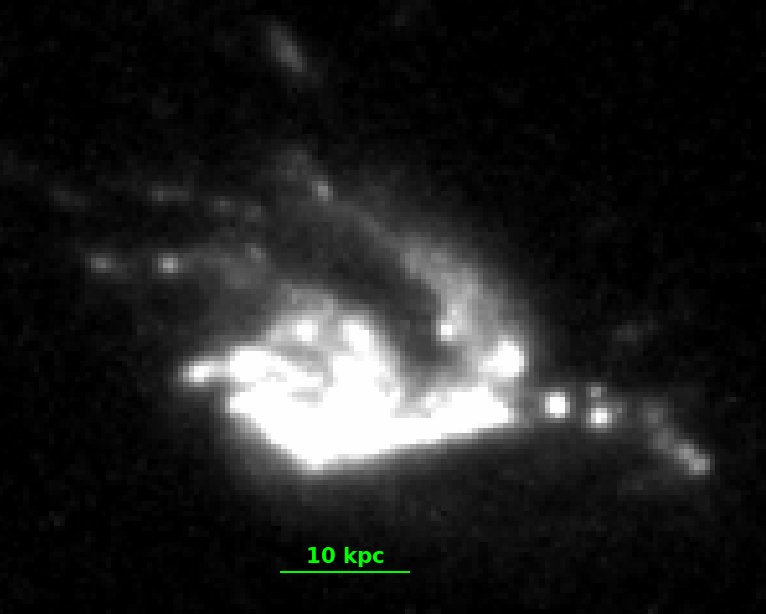
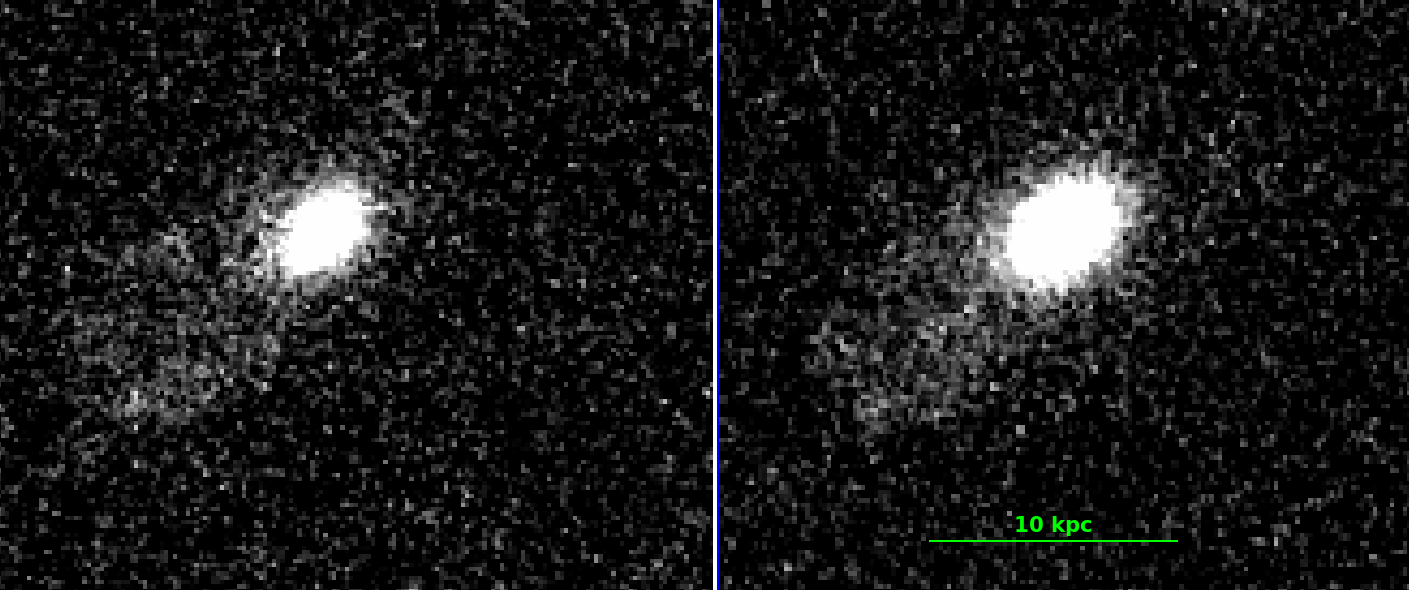
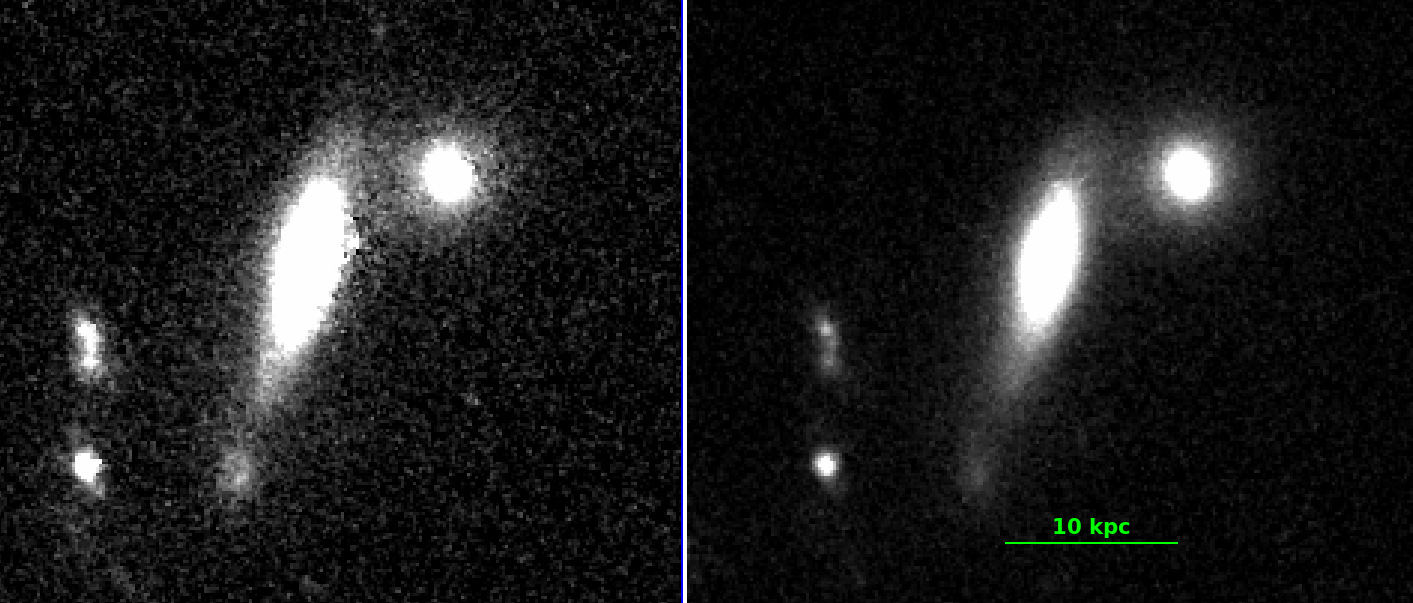
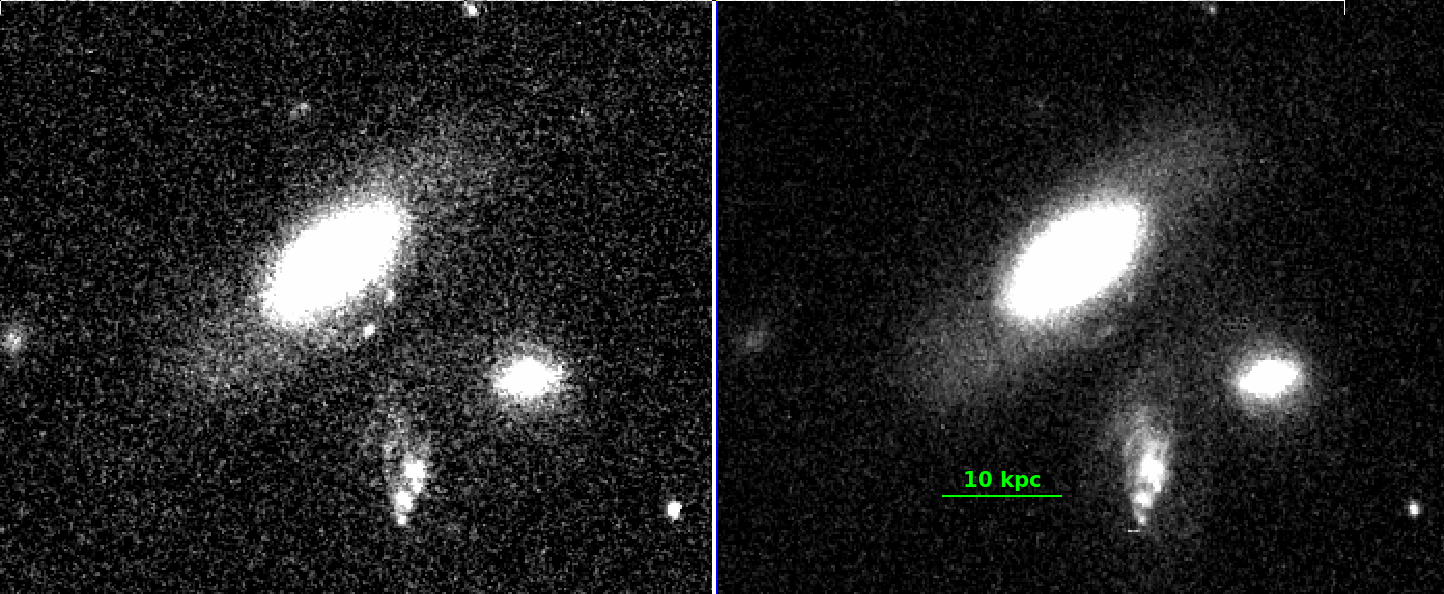
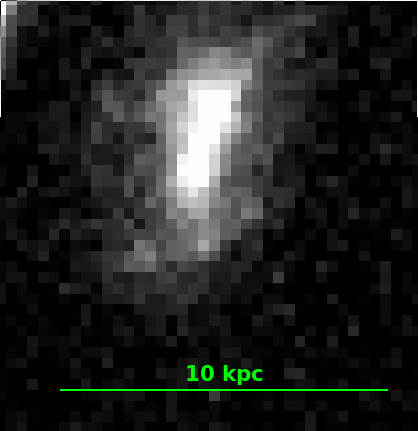
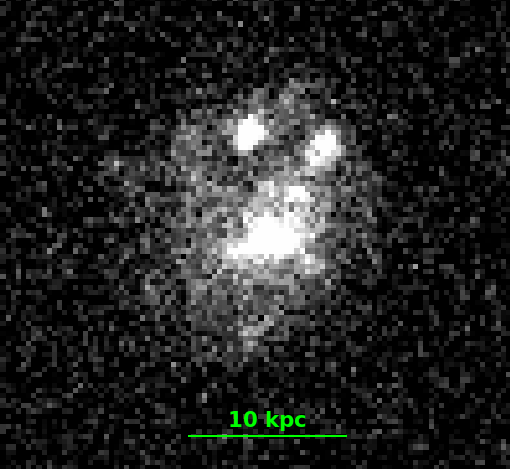
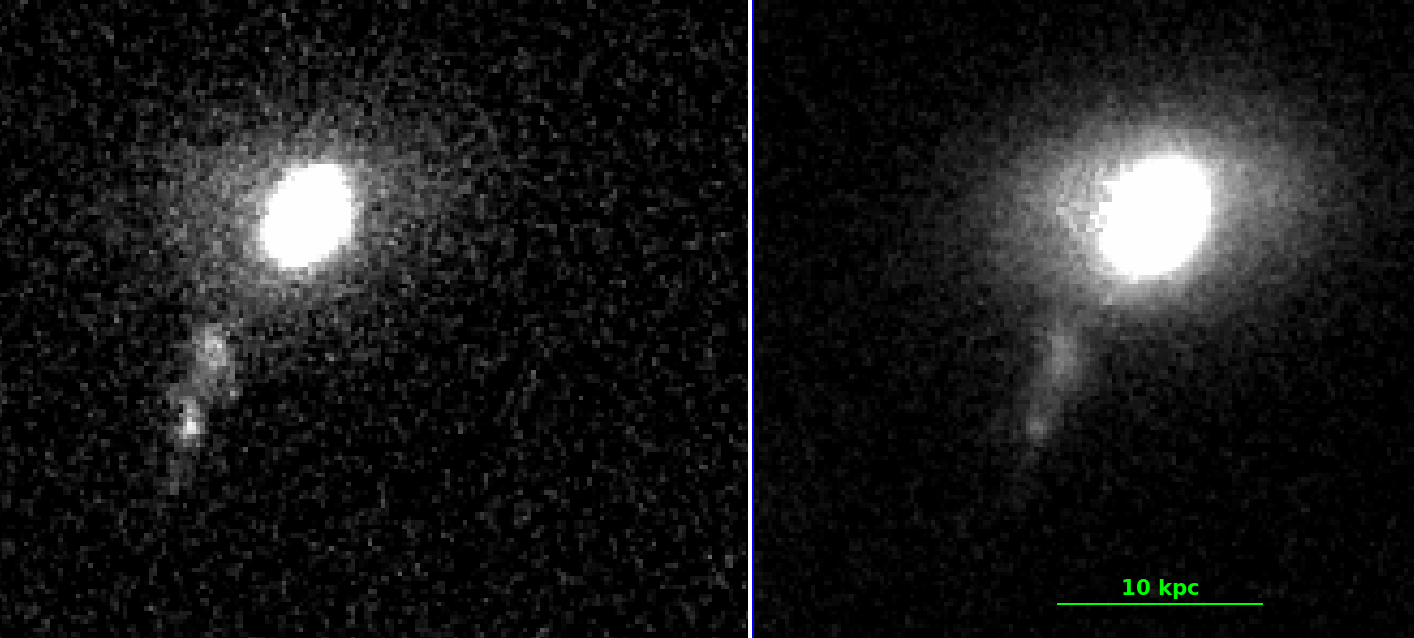
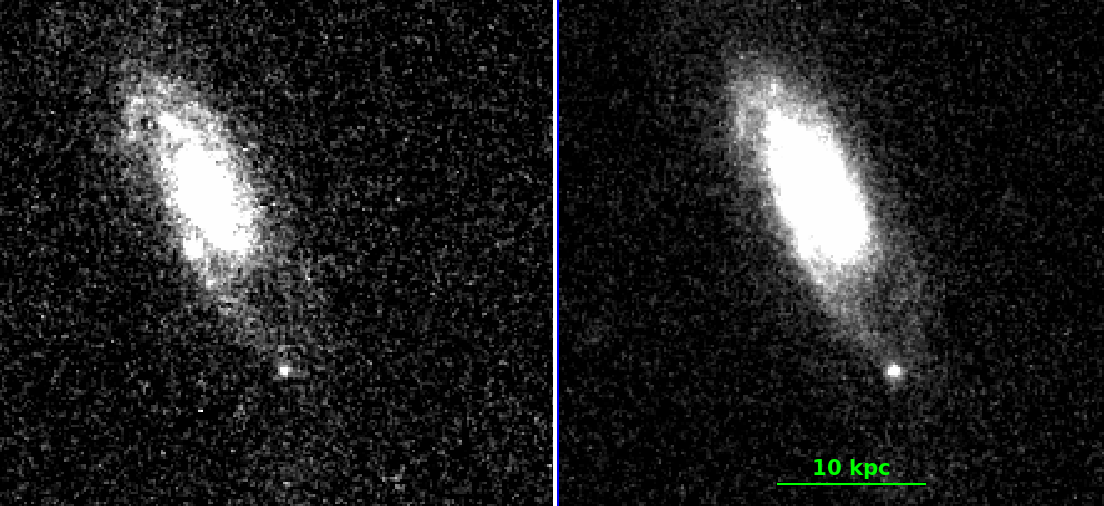
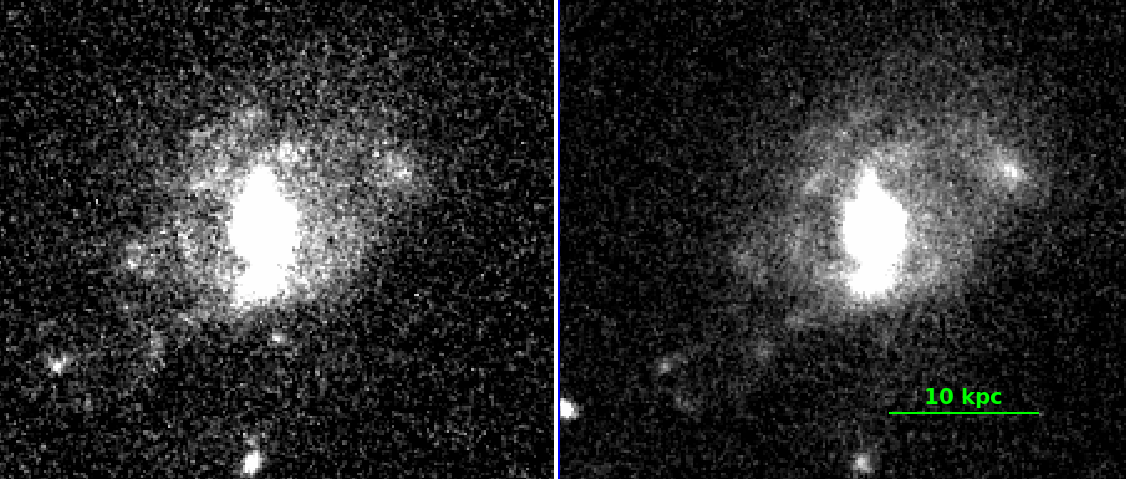
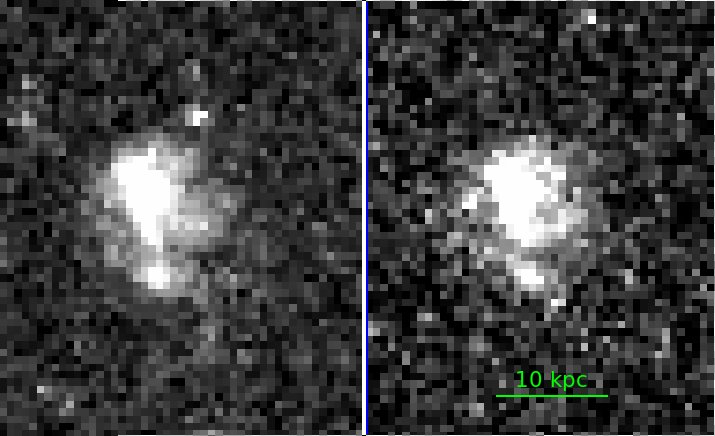
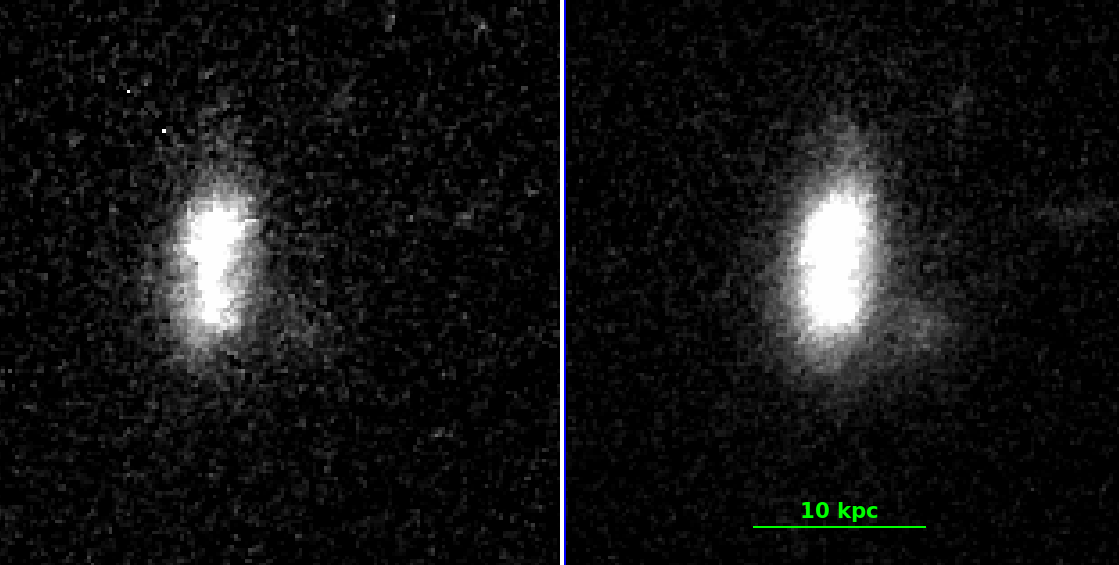
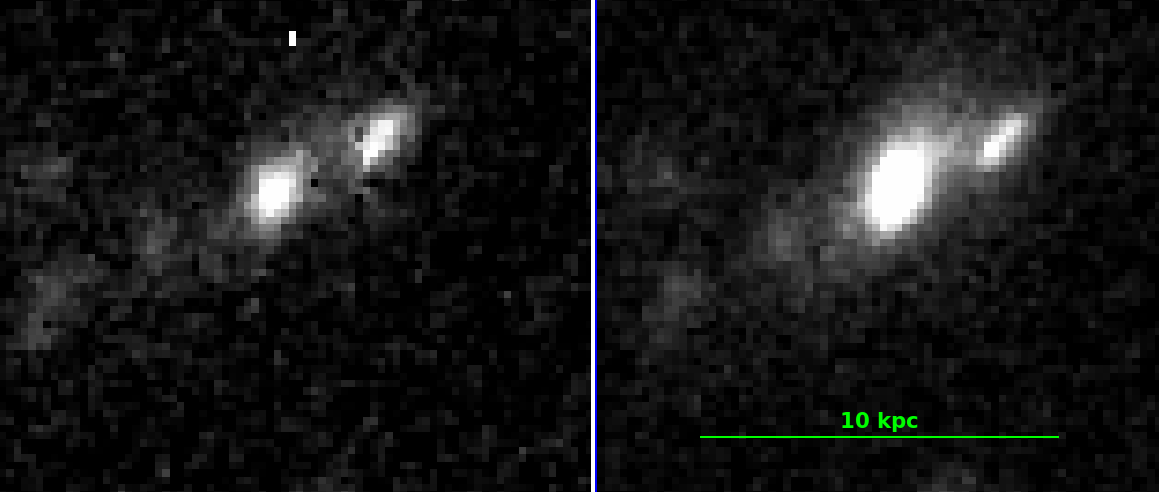
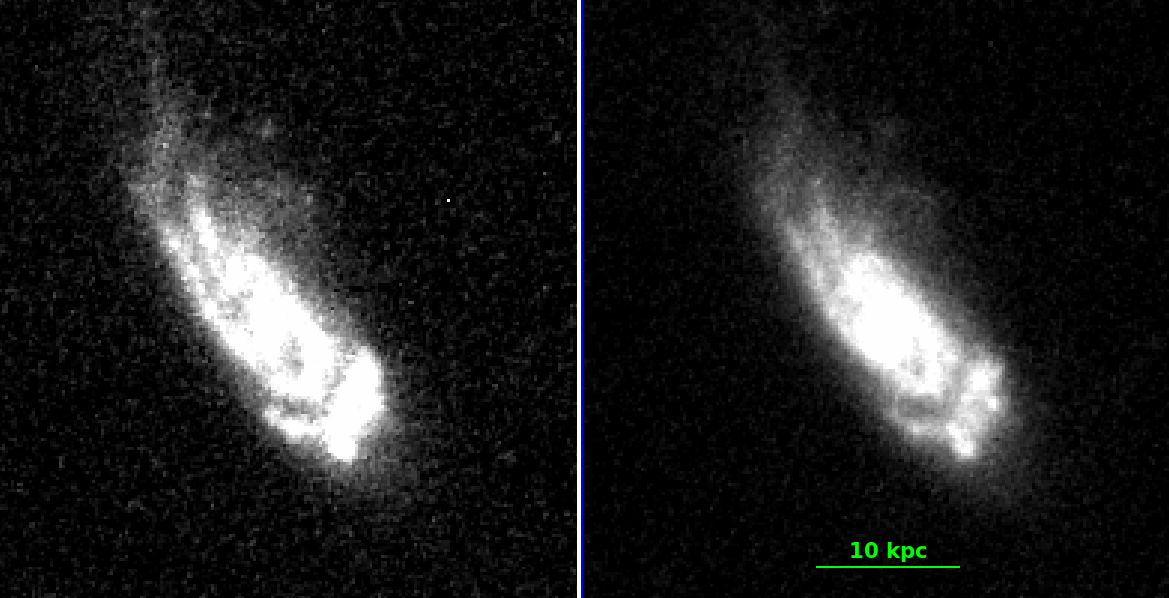
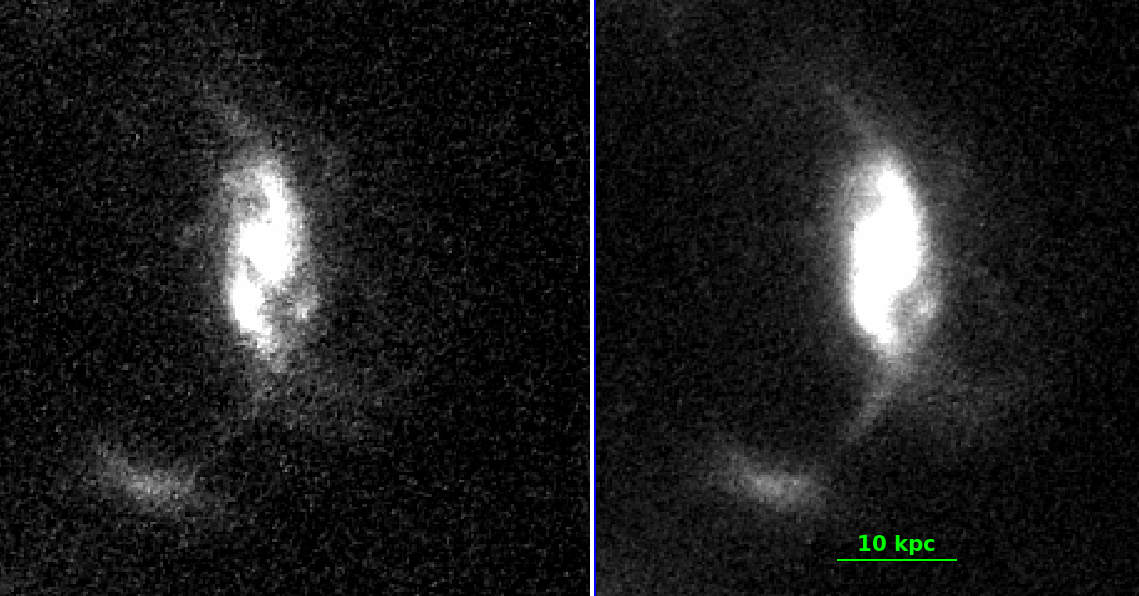
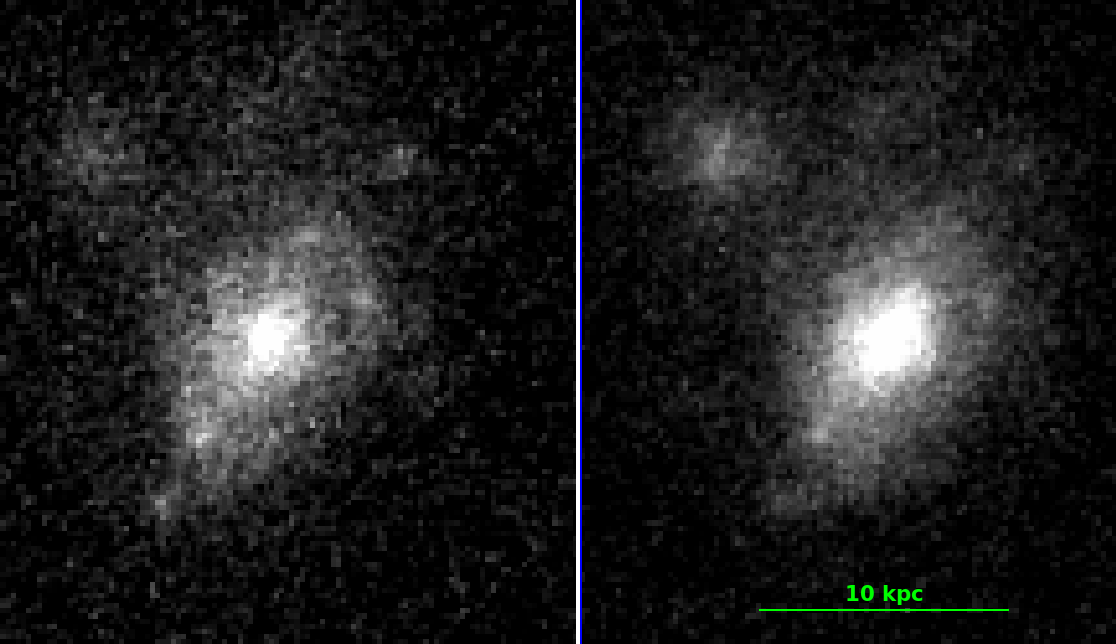
To visually identify jellyfish galaxies, we used HST images. All clusters apart from Cl0152.7-1357 have data in the F814W filter. Whenever possible, we also considered images in the F606W filter as well, to compare the aspect of the galaxies in both filters. Sometimes, F606W images were not available, so we considered another filter, as indicated in Table 3. When possible, we show for each galaxy its images in two filters (with the bluer image to the left and the redder to the right, at the same scale, see Appendix). In some cases, fields covered by the two filters are not exactly the same, so even if a cluster is observed in two filters, an individual galaxy may be found only in one image. In such cases, as well as for clusters observed in a single band, only one image is shown. For a very small number of cases, the astrometries of the two HST images are slightly different, so images look a little displaced.
However, we must keep in mind that clusters in our sample cover a rather large redshift range, so the rest-frame wavelengths corresponding to the filters analysed are not all the same. For MACS0717 (z=0.5458), the central wavelengths of F606W and F814W filters correspond to rest-frame wavelengths of 392 and 527 nm respectively. At the extreme redshifts of our sample, at z=0.2, the central wavelengths of F606W and F814W filters correspond to rest-frame wavelengths of 505 and 678 nm respectively, while at z=0.9 they correspond to rest frame wavelengths of 310 and 428 nm respectively.
The selection of jellyfish candidates in MAC0717 followed the same general procedure as outlined here but the dedicated catalogue of magnitudes and redshifts for this specific system introduced some differences that will be described in Section 3. We must note that, except for MACS0717, our study relies on spectroscopic redshifts gathered from NED, which are not complete in any way. We will therefore obtain some indications, but will not be able to obtain statistically meaningful results, so this search is mainly a basis for future studies.
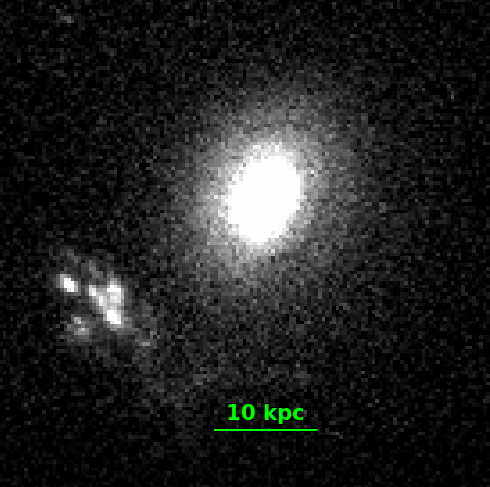
Jellyfish galaxies are mainly accounted for by hydrodynamical interactions (ram pressure stripping) with the hot intracluster gas, which causes various observable effects on the galaxy gas, such as compression of the leading edge of the galaxy, trailing tails, or even unwinding of spiral arms (Bellhouse et al., 2021). On the other hand, gravitational effects (tidal effects, harrassment) affect both gas and stars and can lead to galaxy shapes that can be reminiscent of those of jellyfish galaxies. It is therefore important to spot jellyfish candidates that may be undergoing tidal effects from a neighbour galaxy. For this, we examined all the images of jellyfish candidates and searched for galaxies located within a distance of 50 kpc. Out of the 90 (in MACS0717) and 103 (in the other clusters) jellyfish galaxy candidates that we initially identified, 9 (in MACS0717) and 6 (in other clusters) showed actual evidence for gravitational interaction (tidal arms), so they were eliminated from our sample. Among the remaining ones, 5 jellyfish candidates (in MACS0717) and 18 (in the other clusters) had possible companions but without any signature of interaction with the jellyfish candidate. We kept these galaxies but mark them in Tables 2 and 3 with an asterisk. Our final sample therefore includes 81 jellyfish candidates in MACS0717, and 97 in the 22 other clusters.
| Cluster | RA (J2000.0) | Dec (J2000.0) | redshift | Obs. | Jelly | |||
|---|---|---|---|---|---|---|---|---|
| (deg) | (deg) | gal. | cand. | (kpc) | (km/s) | |||
| Cl 0016+1609 | 4.64098 | 16.43796 | 0.5410 | 103 | 8 | 1820 | 1034 | |
| Abell 209C | 22.97083 | -13.60944 | 0.2060 | 39 | 2 | 2410 | 1205 | |
| Cl J0152.7-1357 | 28.17083 | -13.96250 | 0.8310 | 66 | 6 | 1670 | 1083 | |
| Abell 383C | 42.00833 | -3.53750 | 0.1871 | 32 | 2 | 1960 | 973 | |
| MACS J0416.1-2403C | 64.04125 | -24.06611 | 0.3960 | 205 | 8 | 2420 | 1313 | |
| MACS J0429.6-0253C | 67.40000 | -2.88556 | 0.3990 | 2 | 2 | 1730 | 928 | |
| MACS J0454.1-0300 | 73.54635 | -3.01494 | 0.5500 | 92 | 5 | 2110 | 1205 | |
| MACS J0717.5+3745C | 109.37886 | 37.75826 | 0.5458 | 632 | 81 | 2236 | 1288 | |
| MACS J0744.9+3927C | 116.21863 | 39.45759 | 0.6976 | 2 | 0 | |||
| Abell 611C | 120.24542 | 36.04722 | 0.2880 | 2 | 0 | |||
| Abell 0851 | 145.74167 | 46.98667 | 0.4069 | 102 | 11 | 1542 | 843 | |
| LCDCS 0172 | 163.60083 | -11.77167 | 0.6972 | 45 | 9 | 870 | 526 | |
| MACS J1115.8+0129C | 168.96667 | 1.49861 | 0.3520 | 3 | 0 | |||
| MACS J1149.5+2223C | 176.39622 | 22.40304 | 0.5444 | 106 | 4 | 2920 | 1665 | |
| MACS J1206.2-0847C | 181.55083 | -8.80028 | 0.4400 | 64 | 3 | 2030 | 1109 | |
| BMW-HRI_J122657.3+333253C | 186.74167 | 3.54836 | 0.8900 | 23 | 0 | |||
| LCDCS 0541 | 188.12625 | -12.84344 | 0.5414 | 80 | 7 | 860 | 491 | |
| MACS J1311.0-0310C | 197.75792 | -3.17667 | 0.4940 | 3 | 0 | |||
| ZwCl 1332.8+5043 | 203.58500 | 50.51806 | 0.6200 | 6 | 0 | |||
| MJM98_034 | 203.80742 | 37.81564 | 0.3830 | 8 | 1 | |||
| LCDCS 0829C | 206.87750 | -11.75278 | 0.4510 | 35 | 1 | 1638 | 1475 | |
| LCDCS 0853 | 208.54083 | -12.51708 | 0.7627 | 20 | 7 | 1590 | 987 | |
| 3C 295 CLUSTER | 212.85167 | 52.21056 | 0.4600 | 30 | 8 | 1790 | 984 | |
| MACS J1423.8+2404C | 215.94860 | 24.07782 | 0.5431 | 7 | 0 | |||
| RX J1524.6+0957 | 231.16792 | 9.96083 | 0.5160 | 2 | 0 | |||
| RX J1532.9+3021C | 233.22417 | 30.34944 | 0.3450 | 2 | 1 | 1630 | 860 | |
| RCS J1620.2+2929 | 245.05000 | 29.48333 | 0.8700 | 1 | 0 | |||
| MACS J1621.4+3810 | 245.35292 | 38.16889 | 0.4650 | 1 | 0 | |||
| MS 1621.5+2640 | 245.89792 | 26.57028 | 0.4260 | 31 | 3 | 1718 | 941 | |
| OC02 J1701+6412 | 255.34583 | 64.23583 | 0.4530 | 1 | 0 | |||
| RX J1716.4+6708 | 259.20667 | 67.14167 | 0.8130 | 22 | 1 | 1685 | 1085 | |
| MACS J1720.2+3536C | 260.07000 | 35.60722 | 0.3913 | 2 | 0 | |||
| Abell 2261 | 260.61292 | 32.13389 | 0.2240 | 14 | 0 | |||
| NEP 0200 | 269.33083 | 66.52528 | 0.6909 | 1 | 0 | |||
| MACS J1931.8-2634C | 292.95667 | -26.57611 | 0.3520 | 3 | 2 | 1930 | 1018 | |
| MS 2053.7-0449 | 314.09083 | -4.63083 | 0.5830 | 32 | 1 | 1620 | 952 | |
| MACS J2129.4-0741C | 322.35922 | -7.69062 | 0.5889 | 2 | 0 | |||
| MS 2137.3-2353C | 325.06333 | -23.66111 | 0.3130 | 2 | 0 | |||
| RXC J2248.7-4431C | 342.18125 | -44.52889 | 0.3475 | 42 | 5 | 2300 | 1215 | |
| RX J2328.8+1453 | 352.20792 | 14.88667 | 0.4970 | 3 | 0 |
2.2 Galaxy magnitudes
In order to obtain magnitude measurements for our candidate jellyfish galaxies, we proceeded as follows.
For all CLASH clusters except for MACS0717, we retrieved the corresponding catalogues from the CLASH website that contain up to 17 wavebands, between 225 nm and 1.6 m. Some of these magnitudes are given in Table 3, to help characterise the galaxies. The CLASH magnitudes are corrected for Galactic extinction, and can therefore be used for spectral energy distribution analyses straightforwardly (section 5.2.3).
For galaxies from the DAFT/FADA survey that are not part of CLASH, we computed the zero points applying the HST formula:555http://www.stsci.edu/hst/instrumentation/acs/data-analysis/zeropoints
where the PHOTFLAM and PHOTPLAM values were found in the image headers. We then ran SExtractor (Bertin & Arnouts, 1996) on individual images and retrieved the MAG_AUTO magnitudes. The values given in Table 1 are corrected for Galactic extinction computed from the E(B-V) maps by Schlegel et al. (1998) multiplied by the R values given in Table 6 of Schlafly & Finkbeiner (2011).
For MACS0717: the F606W and F814W magnitudes for the entire mosaic of images of MACS0717 were taken from the data by Martinet et al. (2017) (we did not use the CLASH catalogue available in the F606W and F814W filters for this cluster because it only covers the central region). We also used an eight-band ground-based optical and infrared catalogue for the whole zone covered by MACS0717 and its filament with Subaru/SuprimeCam data in the B, V, Rc, Ic and z bands, CFHT/MegaCam data in the u∗ band, and CFHT/WIRCAM data in the near-infrared J and Ks bands from Jauzac et al. (2012). More details can be found in Ma et al. (2008, 2009).
This eight magnitude catalog for MACS0717 as well as the 17 CLASH magnitudes for all the other CLASH clusters were used to fit the spectral energy distributions of the jellyfish galaxies, and analyse their main stellar populations, with LePhare (Ilbert et al., 2006), through the GAZPAR facility666https://gazpar.lam.fr/home as reported in Sect. 5. We also analyzed the stellar populations of non-jellyfish galaxies in MACS0717, in order to compare the properties of our jellyfish candidates with those of “normal” galaxies.
2.3 Cluster radii and velocity dispersions
In order to calculate the projected distances of jellyfish galaxy candidates in units linked to the cluster properties, we compute for each cluster its value, corresponding to the radius at which the cluster density is 200 times the mean density of the Universe. We did this in several ways. For the seven clusters studied by Martinet et al. (2016), we directly take from this paper. For the other clusters, we compute from the mass. Nine clusters have values in Umetsu et al. (2018), and for the remaining clusters (except one, MJM98, for which we can not find a mass in the literature), we take the masses derived from X-ray masses by Chu et al. (A&A submitted). We then calculate by applying the following formula (Biviano, private communication):
where
is the Hubble parameter at the cluster redshift, z, computed with the cosmological parameters given at the end of Section 1, and G is the gravitational constant.
We also compute the cluster velocity dispersions using equation (1) from Munari et al. (2013):
where , is expressed in units of M⊙, and is the unidimensional velocity dispersion in units of km/s.
The values of and are given in Table 1 for all clusters that have jellyfish candidates.
3 Jellyfish candidates in MACS J0717.5+3745 (z=0.5458)
3.1 The catalogue of jellyfish candidates in MACS J0717.5+3745
| Galaxy number | RA | DEC | z | F606W | F814W | S | F | Dist. | Dist. | v/ |
|---|---|---|---|---|---|---|---|---|---|---|
| (kpc) | (r200) | |||||||||
| 1 | 109.28460 | 37.76579 | 0.5424 | 21.402 | 20.539 | 3 | 2 | 2453 | 1.097 | |
| 2 | 109.29681 | 37.74413 | 0.5445 | 21.605 | 20.526 | 3 | 2 | 2178 | 0.974 | |
| 3∗ | 109.30550 | 37.79056 | 0.5416 | 22.103 | 20.638 | 2 | 3 | 2121 | 0.948 | |
| 4 | 109.33180 | 37.76147 | 0.5444 | 21.810 | 20.873 | 2 | 1 | 1364 | 0.610 | |
| 5 | 109.33253 | 37.76822 | 0.5346 | 22.483 | 21.874 | 1 | 2 | 1372 | 0.613 | |
| 6∗ | 109.33324 | 37.68276 | 0.5763 | 22.134 | 21.036 | 1 | 2 | 2134 | 0.955 | 3.76 |
| 7 | 109.33848 | 37.80727 | 0.5350 | 26.239 | 21.237 | 2 | 3 | 1692 | 0.757 | |
| 8 | 109.35336 | 37.71206 | 0.5459 | 22.138 | 20.870 | 3 | 3 | 1320 | 0.590 | 0.01 |
| 9 | 109.35354 | 37.73134 | 0.5377 | -99.000 | 22.869 | 4 | 4 | 1022 | 0.457 | |
| 10 | 109.37781 | 37.71374 | 0.5374 | 21.923 | 20.766 | 3 | 3 | 1007 | 0.450 | |
| 11 | 109.37863 | 37.78915 | 0.5754 | 22.365 | 21.570 | 5 | 5 | 822 | 0.367 | 3.65 |
| 12 | 109.38213 | 37.72594 | 0.5315 | 22.126 | 21.245 | 4 | 4 | 710 | 0.317 | |
| 13∗ | 109.38460 | 37.73306 | 0.5325 | 22.111 | 21.418 | 1 | 2 | 537 | 0.240 | |
| 14 | 109.39410 | 37.79197 | 0.5757 | 22.878 | 22.084 | 2 | 2 | 840 | 0.376 | 3.68 |
| 15 | 109.39528 | 37.84684 | 0.5348 | 21.759 | 20.512 | 1 | 1 | 2101 | 0.940 | |
| 16 | 109.39620 | 37.76458 | 0.5490 | 22.027 | 21.231 | 3 | 2 | 241 | 0.108 | 0.40 |
| 17 | 109.40541 | 37.70779 | 0.5290 | 22.269 | 21.554 | 1 | 1 | 1148 | 0.514 | |
| 18 | 109.40749 | 37.61744 | 0.5456 | 22.097 | 21.340 | 4 | 4 | 3199 | 1.431 | |
| 19 | 109.40773 | 37.62261 | 0.5459 | 21.055 | 20.251 | 2 | 2 | 3082 | 1.378 | 0.01 |
| 20∗ | 109.41479 | 37.71172 | 0.5395 | 21.618 | 20.502 | 2 | 4 | 1149 | 0.514 | |
| 21 | 109.41522 | 37.72866 | 0.5395 | 22.709 | 21.719 | 3 | 2 | 835 | 0.373 | |
| 22 | 109.41720 | 37.70310 | 0.5420 | 22.270 | 21.353 | 4 | 4 | 1350 | 0.604 | |
| 23 | 109.41817 | 37.79837 | 0.5634 | 22.225 | 20.565 | 4 | 3 | 1168 | 0.522 | 2.18 |
| 24 | 109.42203 | 37.74784 | 0.5660 | 22.493 | 21.425 | 3 | 2 | 768 | 0.343 | 2.50 |
| 25 | 109.42928 | 37.67791 | 0.5442 | 20.739 | 19.954 | 3 | 2 | 1992 | 0.891 | |
| 26 | 109.42990 | 37.78072 | 0.5622 | 22.227 | 21.308 | 3 | 3 | 1068 | 0.478 | 2.04 |
| 27 | 109.43111 | 37.62285 | 0.5472 | 21.150 | 20.410 | 2 | 2 | 3189 | 1.426 | 0.18 |
| 28 | 109.43424 | 37.75050 | 0.5500 | 22.224 | 20.866 | 1 | 2 | 1005 | 0.449 | 0.52 |
| 29 | 109.43758 | 37.72152 | 0.5409 | 22.502 | 21.217 | 2 | 0 | 1330 | 0.595 | |
| 30 | 109.43866 | 37.79811 | 0.5384 | 21.801 | 20.199 | 1 | 0 | 1472 | 0.658 | |
| 31 | 109.44090 | 37.77155 | 0.5521 | 22.692 | 21.920 | 3 | 1 | 1209 | 0.540 | 0.79 |
| 32 | 109.44299 | 37.72516 | 0.5429 | 20.538 | 19.928 | 1 | 0 | 1388 | 0.621 | |
| 33 | 109.44773 | 37.63008 | 0.5469 | 22.637 | 21.694 | 3 | 2 | 3168 | 1.417 | 0.14 |
| 34 | 109.44783 | 37.68979 | 0.5577 | 21.773 | 21.141 | 2 | 3 | 2001 | 0.895 | 1.48 |
| 35 | 109.45184 | 37.61336 | 0.5475 | 22.227 | 21.117 | 2 | 1 | 3558 | 1.591 | 0.21 |
| 36 | 109.45511 | 37.64426 | 0.5404 | 21.156 | 20.171 | 2 | 2 | 2955 | 1.322 | |
| 37 | 109.45564 | 37.62384 | 0.5480 | 21.919 | 21.650 | 2 | 2 | 3375 | 1.510 | 0.28 |
| 38 | 109.45809 | 37.75248 | 0.5546 | 22.010 | 21.090 | 4 | 2 | 1548 | 0.692 | 1.10 |
| 39 | 109.45857 | 37.61006 | 0.5511 | 21.694 | 20.937 | 5 | 4 | 3690 | 1.650 | 0.66 |
| 40 | 109.46005 | 37.73063 | 0.5401 | 21.537 | 20.933 | 5 | 2 | 1692 | 0.757 | |
| 41 | 109.46016 | 37.58284 | 0.5439 | 21.075 | 20.242 | 4 | 1 | 4279 | 1.914 | |
| 2 | 109.46469 | 37.61392 | 0.5495 | 22.426 | 21.308 | 3 | 3 | 3673 | 1.643 | 0.46 |
| 43 | 109.46571 | 37.79222 | 0.5515 | 22.613 | 21.842 | 2 | 2 | 1917 | 0.857 | 0.71 |
| 44 | 109.46701 | 37.70718 | 0.5319 | 22.287 | 21.646 | 5 | 2 | 2075 | 0.928 | |
| 45 | 109.47195 | 37.61126 | 0.54703 | 21.526 | 20.278 | 1 | 0 | 3806 | 1.702 | 0.15 |
| 46 | 109.47451 | 37.70863 | 0.5311 | 21.922 | 20.994 | 3 | 2 | 2206 | 0.987 | |
| 47 | 109.47494 | 37.77757 | 0.5451 | 21.181 | 20.115 | 3 | 0 | 1999 | 0.894 | |
| 48 | 109.47574 | 37.71760 | 0.5440 | 22.315 | 19.658 | 4 | 2 | 2139 | 0.956 | |
| 49 | 109.48136 | 37.74231 | 0.5637 | 21.287 | 20.237 | 2 | 0 | 2104 | 0.941 | 2.22 |
| 50 | 109.48801 | 37.72609 | 0.5362 | 22.385 | 21.872 | 4 | 5 | 2335 | 1.044 | |
| 51 | 109.48879 | 37.55154 | 0.5293 | 22.061 | 21.185 | 4 | 3 | 5204 | 2.327 | |
| 52 | 109.49406 | 37.56277 | 0.55338 | 22.452 | 21.247 | 2 | 0 | 5028 | 2.249 | 0.95 |
| 53 | 109.49385 | 37.64037 | 0.5461 | 22.405 | 21.182 | 2 | 3 | 3553 | 1.589 | 0.04 |
| 54 | 109.49413 | 37.59956 | 0.5464 | 22.503 | 20.107 | 5 | 2 | 4302 | 1.924 | 0.07 |
| 55* | 109.50267 | 37.65858 | 0.5772 | 22.103 | 21.021 | 4 | 3 | 3404 | 1.522 | 3.86 |
| 56 | 109.50533 | 37.63641 | 0.5412 | 20.762 | 19.552 | 3 | 1 | 3800 | 1.699 |
| 57 | 109.50554 | 37.61765 | 0.5426 | 22.114 | 21.392 | 3 | 3 | 4125 | 1.845 | |
| 58 | 109.50652 | 37.67290 | 0.5430 | 21.256 | 20.058 | 1 | 0 | 3269 | 1.462 | |
| 59 | 109.50808 | 37.64077 | 0.5420 | 21.681 | 20.739 | 3 | 2 | 3773 | 1.687 | |
| 60 | 109.50873 | 37.62831 | 0.5425 | 23.489 | 21.638 | 2 | 2 | 3989 | 1.784 | |
| 61 | 109.50883 | 37.63732 | 0.5481 | 21.519 | 20.357 | 2 | 2 | 3841 | 1.718 | 0.29 |
| 62 | 109.52255 | 37.55546 | 0.5465 | 22.372 | 21.748 | 4 | 2 | 5508 | 2.463 | 0.09 |
| 63 | 109.53121 | 37.63280 | 0.5421 | 22.468 | 21.475 | 4 | 4 | 4288 | 1.918 | |
| 64 | 109.53217 | 37.58715 | 0.5447 | 21.959 | 21.064 | 5 | 4 | 5055 | 2.261 | |
| 65 | 109.53279 | 37.55027 | 0.5495 | 21.663 | 20.238 | 1 | 0 | 5739 | 2.567 | 0.46 |
| 66∗ | 109.53319 | 37.64305 | 0.5478 | 21.084 | 20.302 | 3 | 2 | 4172 | 1.866 | 0.25 |
| 67 | 109.53738 | 37.57487 | 0.5513 | 21.634 | 20.531 | 5 | 2 | 5349 | 2.392 | 0.69 |
| 68 | 109.53812 | 37.68567 | 0.5422 | 23.393 | 23.081 | 2 | 2 | 3749 | 1.676 | |
| 69 | 109.54137 | 37.70054 | 0.5419 | 21.532 | 20.190 | 1 | 0 | 3685 | 1.648 | |
| 70 | 109.55122 | 37.64091 | 0.5701 | 22.283 | 21.443 | 3 | 2 | 4533 | 2.027 | 3.00 |
| 71 | 109.55586 | 37.57695 | 0.5500 | 21.673 | 20.747 | 3 | 1 | 5592 | 2.501 | 0.52 |
| 72∗ | 109.55758 | 37.68818 | 0.5419 | 22.206 | 21.046 | 3 | 2 | 4135 | 1.849 | |
| 73 | 109.56507 | 37.57967 | 0.5488 | 21.814 | 20.612 | 4 | 2 | 5693 | 2.546 | 0.38 |
| 74 | 109.57690 | 37.67111 | 0.5236 | 22.552 | 21.855 | 2 | 3 | 4698 | 2.101 | |
| 75 | 109.58230 | 37.62237 | 0.5625 | 21.298 | 20.379 | 4 | 0 | 5363 | 2.398 | 2.07 |
| 76 | 109.58243 | 37.60096 | 0.5449 | 22.312 | 21.025 | 2 | 2 | 5661 | 2.532 | |
| 77 | 109.58437 | 37.68565 | 0.5482 | 21.371 | 20.508 | 2 | 0 | 4732 | 2.116 | 0.30 |
| 78 | 109.58499 | 37.61001 | 0.5489 | 22.352 | 21.587 | 5 | 4 | 5579 | 2.495 | 0.39 |
| 79 | 109.59241 | 37.65249 | 0.5378 | 24.508 | 21.100 | 4 | 3 | 5206 | 2.328 | |
| 80 | 109.60329 | 37.59384 | 0.5542 | 21.376 | 20.345 | 4 | 4 | 6139 | 2.746 | 1.05 |
| 81 | 109.60480 | 37.64520 | 0.5225 | 22.826 | 22.159 | 3 | 2 | 5536 | 2.476 |
MACS0717 is a well-known massive cluster with a large extension/filament reaching a total of about 9 Mpc towards the south-east and studied by Jauzac et al. (2012, 2018a, 2018b) and Martinet et al. (2016). Based on a weak lensing study, its mass was estimated to be M⊙ within the R200 radius by Martinet et al. (2016). An extensive spectroscopic redshift catalogue, with 646 galaxies in the redshift interval , allows us to search for jellyfish galaxies in a very efficient way throughout the structure, which has been almost entirely covered by HST/ACS observations.
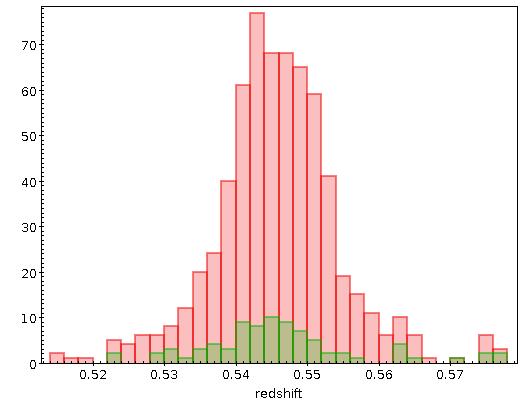
For this cluster, we examined 18 individual HST/ACS images in both F606W and F814W bands. Out of the 646 galaxies with redshifts in the cluster range, 81 were identified as jellyfish candidates. The list of these galaxies is given in Table 2, and corresponding images are displayed in Appendix A. The histograms of all redshifts available in the MACS0717 region and of the identified jellyfish galaxy candidates is shown in Fig. 1. This plot seems to show that jellyfish candidates generally follow the velocity distribution of the cluster.
The jellyfish classification was separately made by two of us, and the corresponding classes are given in the last two columns (classS and classF) of Table 2. It appears that classF is often stricter than classS, so for some results shown below we made two samples of “strong probability” jellyfish objects (i.e. of types 3, 4 and 5), according to classF and to classS separately.
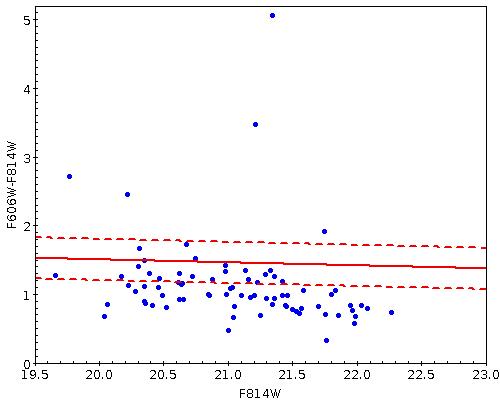
The colour-magnitude diagram for MACS0717 is shown in Fig. 2. The red sequence drawn from Subaru data in the V and I bands was: V-I=I+2.75 (Durret et al., 2016), computed by considering the positions on this sequence of several tens of galaxies at the cluster redshift. Its width of was chosen to include all the galaxies belonging to the cluster according to their spectroscopic redshift, as explained by Durret et al. (2016). We adapted this red sequence to the F606W and F814W filters using the transformations given by Fukugita et al. (1995) and the result is shown in Fig. 2 (red lines). The data points refer to the jellyfish candidates found in the cluster. We can see that most of them are blue and lie below the red sequence. For the four galaxies located notably above the red sequence, the fit of the SED by a stellar population model (see Sect. 5.2.1) gives internal extinctions of 0.4 for three galaxies, and 0 for the fourth one. Thus, except for the last galaxy, their red colours may be at least partly explained by internal dust.
3.2 Spatial distribution of jellyfish candidates in MACS J0717.5+3745
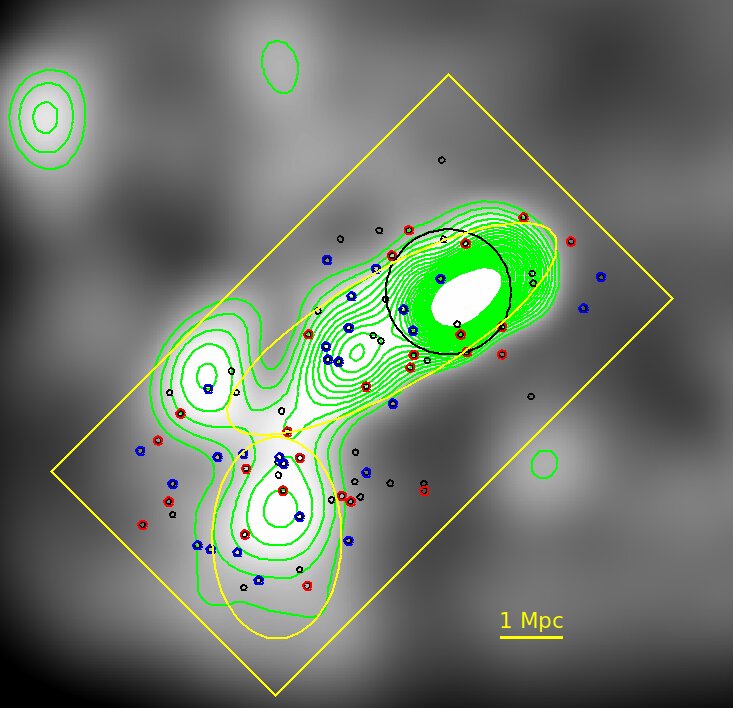
The positions of the jellyfish candidates in MACS0717 are shown in Fig. 3. We highlight galaxies of types 3, 4 and 5 (considering both classifications), since they have a high probability of being real jellyfish galaxies. We can see that a large number is located outside the densest regions and about one third lie in regions less dense than the contour above the average background density. Interestingly, about half of the jellyfish candidates are located in the extended filament South region of the cluster (filament C in Durret et al. (2016), the vertical yellow ellipse in Fig. 3), a low-density zone where only faint X-ray emission is detected (Ma et al., 2009), and therefore where RPS is not expected to be strong but might be gently acting.
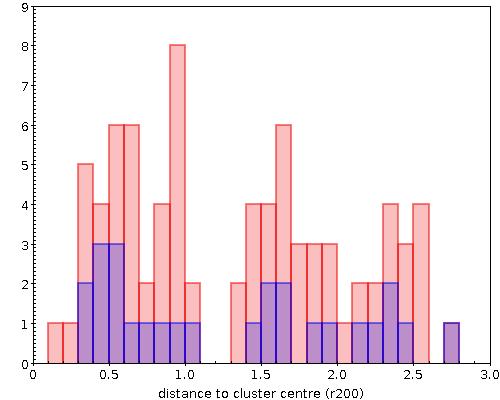
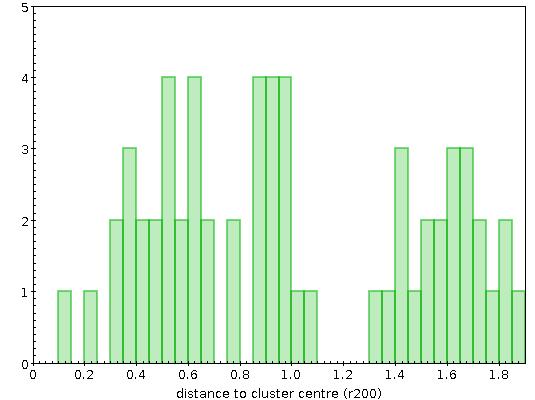
Another way to illustrate the spatial distribution of jellyfish galaxies in the large scale MACS0717 structure is to draw the histogram of projected distances to the cluster centre, as shown in Fig. 4. This figure confirms the paucity of jellyfish galaxies in the innermost cluster regions. The histogram of the galaxy velocities in units of has a similar shape. This lack of jellyfish candidates in the cluster centre agrees with the model by Safarzadeh & Loeb (2019) that predicts no jellyfish galaxies at small clustercentric distances. This result is at odds with the results of the GASP survey, where jellyfish galaxies at low redshift tend to be found in the innermost regions of clusters (Gullieuszik et al., 2020).
A morphometric analysis of the jellyfish galaxies in MACS0717, comparable to that performed by Roman-Oliveira et al. (2021) with MORFOMETRYKA on a large sample of ram-pressure stripping candidates in the Abell 901/902 multi-cluster system, would be very interesting.
4 Jellyfish candidates in 22 other clusters
4.1 The jellyfish catalogue
Positions and magnitudes of the 97 jellyfish candidates found in 22 clusters are given in Table 3. For CLASH clusters, galaxy coordinates are those of the CLASH catalogue, which always match very well those measured in the images.
For the DAFT/FADA clusters, galaxy coordinates are those measured by SExtractor on the HST images, as they are more accurate than some of the coordinates extracted from NED. We checked by superimposing galaxies from the SDSS catalogue that the astrometry of our HST images was correct.
| Cluster | G. | RA | DEC | z | F555W | F606W | F702W | F814W | F | S | Dist. | Dist. | v/ |
| F775W | (kpc) | (r200) | |||||||||||
| Cl 0016+16 | a | 4.62890 | 16.42794 | 0.5561 | 19.824 | 4 | 4 | 361 | 0.198 | 2.35 | |||
| b | 4.63388 | 16.42250 | 0.5498 | 20.742 | 3 | 3 | 391 | 0.215 | 1.37 | ||||
| c | 4.63674 | 16.43428 | 0.5382 | 21.770 | 2 | 1 | 129 | 0.071 | |||||
| d | 4.64164 | 16.44986 | 0.56 | 22.033 | 5 | 5 | 274 | 0.151 | 2.95 | ||||
| e∗ | 4.65058 | 16.44316 | 0.5469 | 22.291 | 2 | 1 | 251 | 0.138 | 0.92 | ||||
| f | 4.65223 | 16.42086 | 0.5555 | 21.628 | 2 | 3 | 471 | 0.259 | 2.26 | ||||
| g | 4.65749 | 16.44081 | 0.54 | 24.100 | 2 | 2 | 385 | 0.212 | |||||
| h | 4.66072 | 16.45040 | 0.5642 | 19.872 | 3 | 5 | 536 | 0.295 | 3.59 | ||||
| Abell 209 | a | 22.95776 | -13.60326 | 0.2123 | 19.967 | 19.283 | 2 | 2 | 176 | 0.073 | 1.25 | ||
| b∗ | 22.98058 | -13.60446 | 0.2169 | 19.103 | 18.821 | 4 | 4 | 133 | 0.055 | 2.16 | |||
| Cl 0152.7-1357 | a∗ | 28.12674 | -13.95393 | 0.8474 | 21.457 | 2 | 4 | 1229 | 0.736 | 1.74 | |||
| b | 28.15464 | -13.95295 | 0.8458 | 22.763 | 2 | 4 | 514 | 0.308 | 1.57 | ||||
| c | 28.15784 | -13.93587 | 0.8456 | 21.338 | 2 | 4 | 811 | 0.486 | 1.55 | ||||
| d | 28.15924 | -13.92740 | 0.8360 | 21.583 | 1 | 2 | 1012 | 0.606 | |||||
| e | 28.17714 | -13.93879 | 0.8215 | 21.321 | 2 | 1 | 672 | 0.402 | |||||
| f | 28.17842 | -13.96492 | 0.8371 | 23.681 | 2 | 1 | 218 | 0.131 | 0.65 | ||||
| Abell 383 | a | 42.01002 | -3.55678 | 0.1944 | 19.487 | 18.675 | 1 | 3 | 218 | 0.111 | 1.83 | ||
| b | 42.03447 | -3.52755 | 0.1914 | 19.017 | 18.311 | 2 | 2 | 315 | 0.161 | 1.08 | |||
| MACS J0416.1-2403 | a∗ | 64.01709 | -24.08955 | 0.396 | 20.756 | 19.761 | 1 | 4 | 647 | 0.267 | 0.00 | ||
| b∗ | 64.01919 | -24.09614 | 0.3844 | 22.579 | 21.676 | 1 | 1 | 716 | 0.296 | ||||
| c | 64.02498 | -24.09166 | 0.3944 | 21.533 | 20.844 | 0 | 1 | 582 | 0.241 | ||||
| d | 64.02779 | -24.06101 | 0.3918 | 22.618 | 21.893 | 1 | 2 | 277 | 0.114 | ||||
| e | 64.03268 | -24.07015 | 0.3973 | 21.410 | 20.506 | 2 | 2 | 182 | 0.075 | 0.19 | |||
| f | 64.04131 | -24.07134 | 0.3990 | 20.676 | 19.707 | 2 | 3 | 101 | 0.042 | 0.44 | |||
| g∗ | 64.04419 | -24.06872 | 0.4071 | 21.319 | 20.478 | 2 | 4 | 76 | 0.031 | 1.62 | |||
| h | 64.05088 | -24.06027 | 0.3952 | 22.508 | 21.874 | 3 | 3 | 217 | 0.089 | ||||
| MACS J0429.6-0253 | a | 67.38860 | -2.88379 | 0.4 | 20.798 | 20.505 | 4 | 4 | 223 | 0.129 | 0.21 | ||
| b | 67.41844 | -2.88832 | 0.4049 | 20.920 | 20.665 | 4 | 3 | 360 | 0.208 | 1.22 | |||
| MACS J0454.1-0300 | a | 73.51869 | -3.00396 | 0.5323 | 19.910 | 5 | 5 | 679 | 0.322 | ||||
| b | 73.53999 | -3.01686 | 0.5483 | 20.118 | 1 | 2 | 152 | 0.072 | |||||
| c∗ | 73.55029 | -3.00036 | 0.5469 | 20.338 | 1 | 2 | 345 | 0.163 | |||||
| d∗ | 73.56299 | -3.00639 | 0.524 | 22.475 | 5 | 3 | 427 | 0.202 | |||||
| e | 73.56342 | -2.99819 | 0.528 | 20.116 | 1 | 2 | 546 | 0.259 | |||||
| Abell 851 | a | 145.68898 | 46.98263 | 0.407 | 20.668 | 2 | 2 | 1033 | 0.670 | 0.02 | |||
| b | 145.69411 | 47.00624 | 0.4083 | 20.092 | 2 | 1 | 1005 | 0.652 | 0.32 | ||||
| c | 145.71105 | 47.01366 | 0.3958 | 19.165 | 5 | 5 | 798 | 0.517 | |||||
| d | 145.73241 | 47.01542 | 0.3972 | 22.378 | 3 | 3 | 590 | 0.383 | |||||
| e∗ | 145.73256 | 46.99261 | 0.4076 | 19.485 | 3 | 4 | 213 | 0.138 | 0.16 | ||||
| f | 145.73862 | 46.96882 | 0.4084 | 20.286 | 2 | 4 | 354 | 0.230 | 0.34 | ||||
| g | 145.74384 | 46.99646 | 0.4200 | 21.317 | 1 | 2 | 196 | 0.127 | 2.93 | ||||
| h | 145.74773 | 47.01602 | 0.3937 | 21.002 | 4 | 3 | 586 | 0.380 | |||||
| i | 145.75700 | 47.00907 | 0.4061 | 19.160 | 2 | 3 | 531 | 0.344 | |||||
| j | 145.76435 | 46.98741 | 0.41 | 20.839 | 2 | 3 | 444 | 0.288 | 0.70 | ||||
| k | 145.76440 | 47.00949 | 0.39 | 21.286 | 1 | 2 | 630 | 0.408 | |||||
| LCDCS 0172 | a | 163.57599 | -11.78999 | 0.6965 | 22.109 | 2 | 3 | 793 | 0.911 | ||||
| b | 163.58247 | -11.77602 | 0.6972 | 21.651 | 3 | 3 | 485 | 0.557 | 0.00 | ||||
| c | 163.58701 | -11.74937 | 0.6968 | 22.337 | 4 | 3 | 674 | 0.774 | |||||
| d | 163.58728 | -11.75391 | 0.702 | 20.863 | 3 | 3 | 574 | 0.659 | 1.23 | ||||
| e | 163.60573 | -11.76516 | 0.6977 | 20.148 | 1 | 2 | 209 | 0.241 | 0.13 | ||||
| f | 163.60592 | -11.79784 | 0.6977 | 22.885 | 4 | 5 | 685 | 0.787 | 0.13 | ||||
| g∗ | 163.62696 | -11.78158 | 0.6986 | 19.654 | 2 | 3 | 718 | 0.825 | 0.36 | ||||
| h | 163.62964 | -11.82359 | 0.6966 | 22.199 | 1 | 2 | 1525 | 1.753 | |||||
| i | 163.64143 | -11.82147 | 0.699 | 21.098 | 2 | 2 | 1650 | 1.897 | 0.46 | ||||
| MACS J1149.5+2223 | a | 177.39015 | 22.40389 | 0.543 | 23.162 | 21.867 | 2 | 2 | 141 | 0.048 | |||
| b∗ | 177.39855 | 22.38979 | 0.536 | 23.149 | 22.090 | 2 | 3 | 309 | 0.106 | ||||
| c∗ | 177.39863 | 22.39850 | 0.540 | 19.258 | 18.122 | 5 | 4 | 118 | 0.040 | ||||
| d | 177.39977 | 22.39728 | 0.541 | 21.197 | 20.223 | 5 | 4 | 155 | 0.053 | ||||
| MACS J1206.2-0847 | a | 181.53955 | -8.81678 | 0.4356 | 22.308 | 21.427 | 2 | 2 | 409 | 0.202 | |||
| b∗ | 181.56187 | -8.80434 | 0.4265 | 20.214 | 19.616 | 3 | 3 | 241 | 0.119 | ||||
| c | 181.57174 | -8.80643 | 0.4450 | 20.156 | 19.135 | 1 | 1 | 446 | 0.220 | 0.82 |
| LCDCS 0541 | a | 188.09897 | -12.86970 | 0.5499 | 21.022 | 2 | 3 | 867 | 1.008 | 2.80 | |||
| b | 188.10412 | -12.86525 | 0.5399 | 20.615 | 2 | 3 | 712 | 0.827 | |||||
| c | 188.11454 | -12.83518 | 0.5367 | 19.587 | 4 | 1 | 328 | 0.382 | |||||
| d | 188.12779 | -12.83268 | 0.5492 | 21.795 | 2 | 2 | 249 | 0.289 | 2.57 | ||||
| e | 188.13455 | -12.85739 | 0.5498 | 20.053 | 1 | 2 | 372 | 0.432 | 2.76 | ||||
| f | 188.14242 | -12.81575 | 0.5323 | 22.953 | 1 | 2 | 734 | 0.854 | |||||
| g | 188.16354 | -12.89634 | 0.5364 | 21.641 | 2 | 3 | 1482 | 1.723 | |||||
| [MJM98]_034 | a∗ | 203.75482 | 37.82928 | 0.3841 | 23.213 | 2 | 2 | 1303 | 1.300 | 0.22 | |||
| LCDCS 0829 | a | 206.87102 | -11.76679 | 0.4534 | 21.106 | 20.397 | 4 | 4 | 320 | 0.196 | 0.29 | ||
| LCDCS 0853 | a∗ | 208.54225 | -12.51746 | 0.7565 | 23.885 | 3 | 1 | 39 | 0.025 | ||||
| b∗ | 208.54246 | -12.51466 | 0.7593 | 21.036 | 2 | 3 | 78 | 0.049 | |||||
| c | 208.55306 | -12.55668 | 0.7627 | 22.491 | 2 | 2 | 1102 | 0.693 | 0.00 | ||||
| d∗ | 208.55823 | -12.52258 | 0.7642 | 21.076 | 1 | 3 | 485 | 0.305 | 0.19 | ||||
| e | 208.56222 | -12.52241 | 0.7609 | 21.117 | 3 | 2 | 586 | 0.368 | |||||
| f | 208.57370 | -12.51199 | 0.7642 | 24.061 | 2 | 1 | 884 | 0.556 | 0.19 | ||||
| g | 208.57877 | -12.51216 | 0.7634 | 21.426 | 2 | 3 | 1017 | 0.640 | 0.09 | ||||
| 3C 295 | a | 212.79865 | 52.20013 | 0.454 | 23.593 | 21.908 | 1 | 3 | 1134 | 0.634 | |||
| b | 212.80549 | 52.16989 | 0.43 | 22.916 | 1 | 2 | 1292 | 0.722 | |||||
| c | 212.80823 | 52.19388 | 0.4485 | 22.968 | 21.459 | 2 | 4 | 977 | 0.546 | ||||
| d | 212.82234 | 52.18692 | 0.44 | 23.455 | 22.452 | 2 | 2 | 791 | 0.442 | ||||
| e | 212.82708 | 52.20480 | 0.4703 | 23.794 | 4 | 2 | 530 | 0.296 | 1.86 | ||||
| f | 212.83317 | 52.19815 | 0.4659 | 23.033 | 3 | 3 | 468 | 0.261 | 1.07 | ||||
| g | 212.83551 | 52.20273 | 0.464 | 22.0453 | 3 | 4 | 377 | 0.211 | 0.72 | ||||
| h | 212.85448 | 52.20978 | 0.47 | 25.132 | 1 | 2 | 61 | 0.034 | 1.80 | ||||
| RX J1532.9+3021 | a | 233.22410 | 30.34982 | 0.3611 | 17.819 | 17.108 | 5 | 5 | 7 | 0.004 | 3.79 | ||
| MS 1621.5+2640 | a | 245.89661 | 26.57446 | 0.4269 | 23.106 | 21.371 | 3 | 4 | 88 | 0.051 | 0.18 | ||
| b | 245.90057 | 26.57651 | 0.4405 | 22.796 | 21.103 | 3 | 3 | 136 | 0.079 | 2.84 | |||
| c | 245.92174 | 26.53319 | 0.4071 | 21.700 | 2 | 5 | 885 | 0.515 | |||||
| RX J1716.4+6708 | a | 259.15717 | 67.12481 | 0.8044 | 23.235 | 3 | 2 | 1421 | 0.843 | ||||
| MACS J1931.8-2634 | a | 292.94157 | -26.59913 | 0.3494 | 20.890 | 20.158 | 1 | 3 | 491 | 0.255 | |||
| b | 292.9506 | -26.57826 | 0.3652 | 20.399 | 20.131 | 3 | 4 | 115 | 0.060 | 2.61 | |||
| MS 2053.7-0449 | a | 314.09464 | -4.59867 | 0.5880 | 22.293 | 21.687 | 2 | 2 | 715 | 0.441 | 0.81 | ||
| RX J2248.7-4431 | a | 342.14918 | -44.52740 | 0.3356 | 21.658 | 21.043 | 1 | 2 | 569 | 0.247 | |||
| b | 342.15716 | -44.54514 | 0.3312 | 23.971 | 22.954 | 3 | 2 | 515 | 0.224 | ||||
| c | 342.16731 | -44.51396 | 0.3517 | 20.443 | 19.991 | 5 | 5 | 362 | 0.157 | 0.70 | |||
| d∗ | 342.17550 | -44.53546 | 0.3362 | 19.814 | 19.106 | 4 | 4 | 155 | 0.067 | ||||
| e | 342.20375 | -44.54226 | 0.3552 | 21.698 | 21.293 | 2 | 2 | 464 | 0.202 | 1.29 |
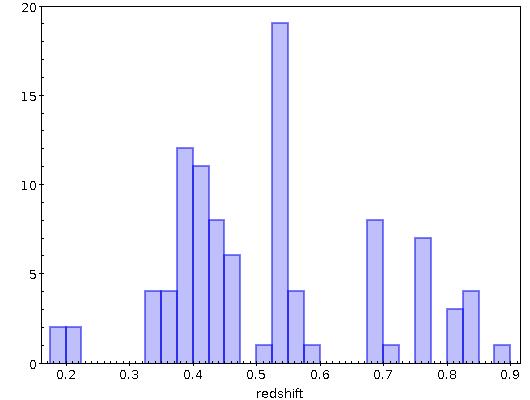
The redshift histogram of the 97 jellyfish candidates found in 22 clusters (other than MACS0717) is shown in Fig. 5.
4.2 Images and notes on individual objects
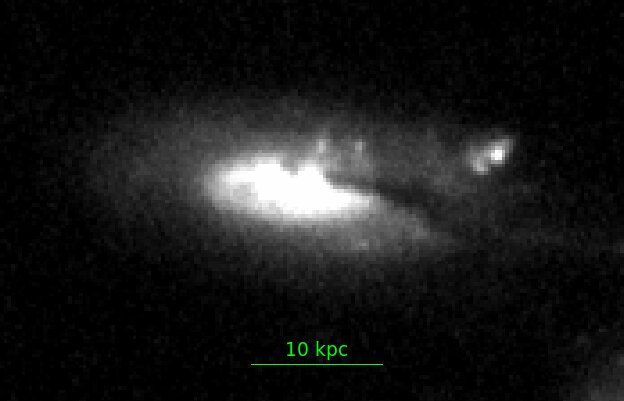
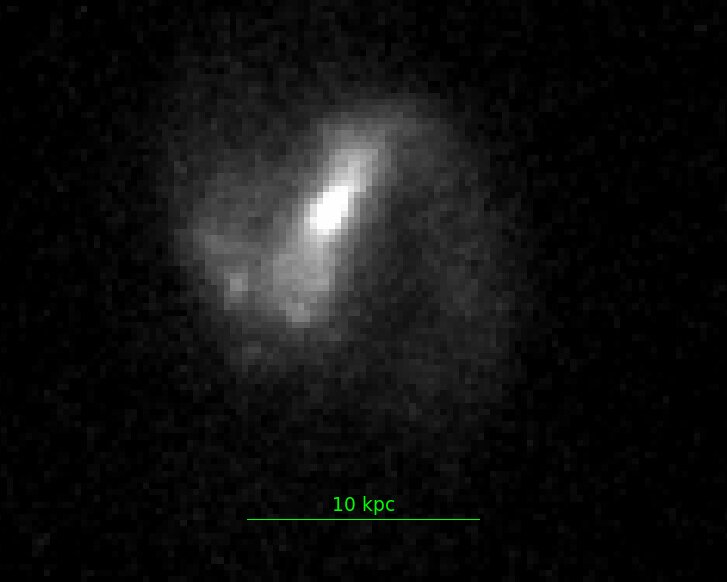
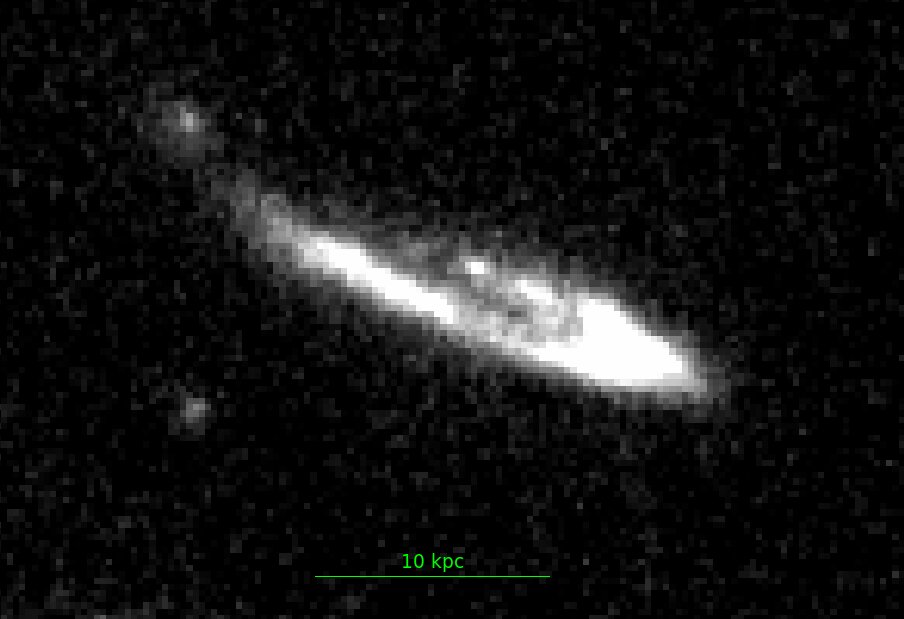
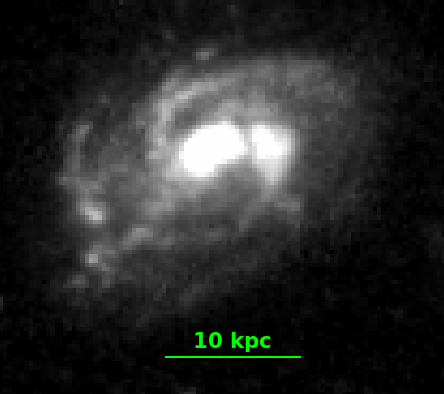
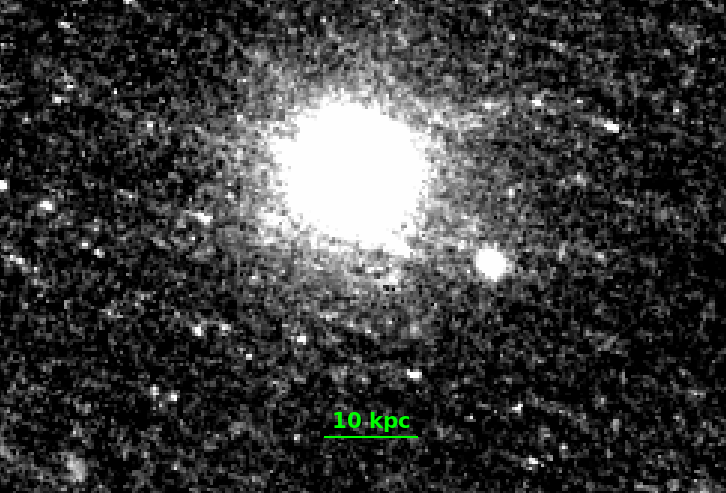
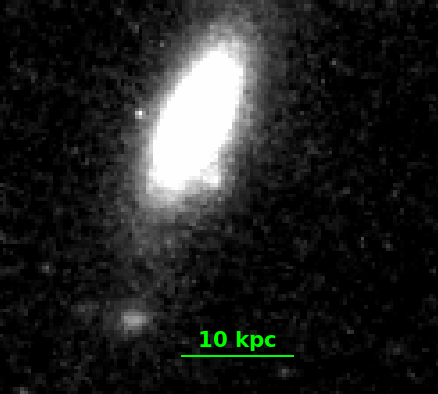
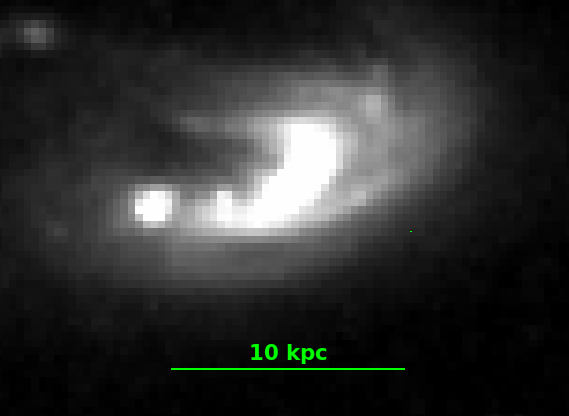
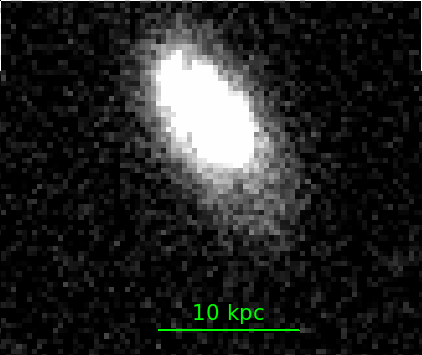
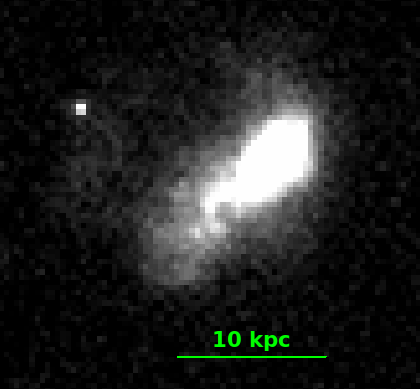
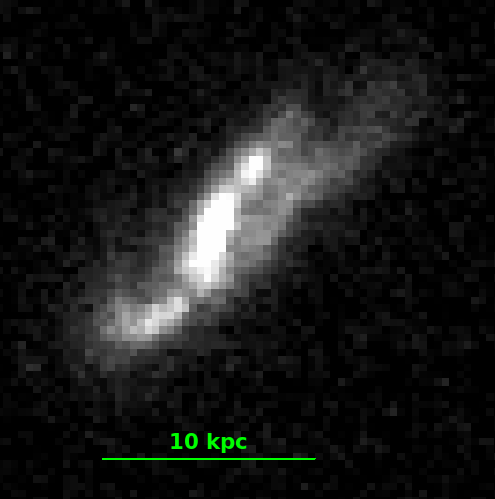
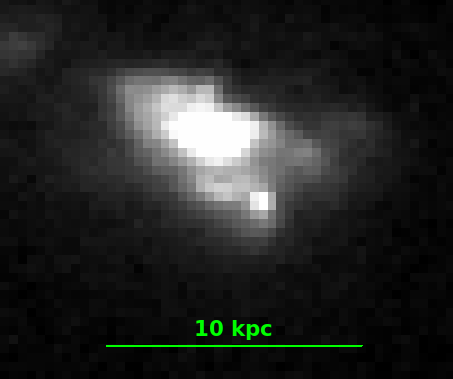
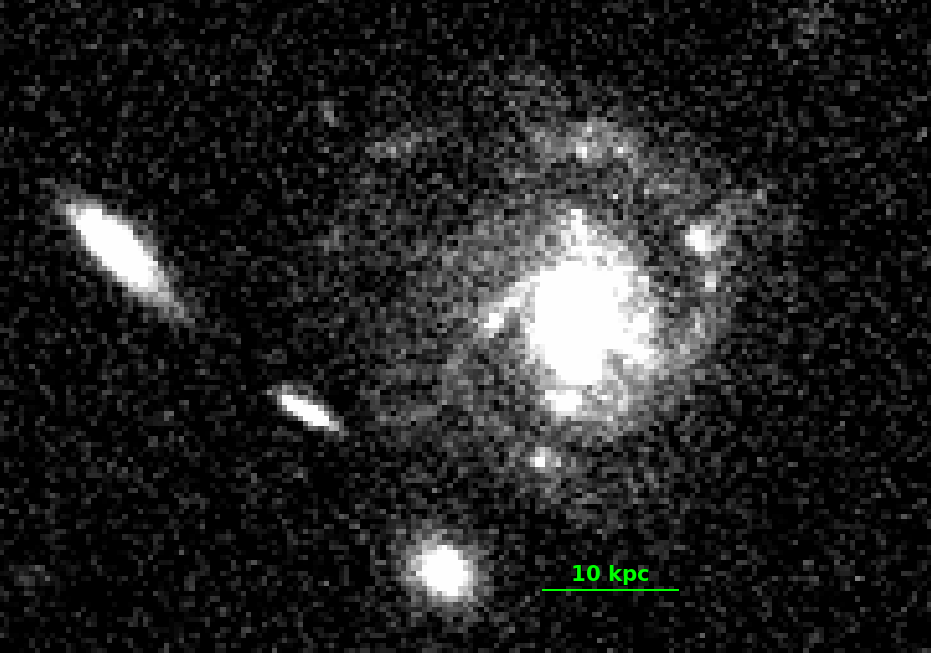
The images of the 97 jellyfish candidates are shown in Appendix B. In some cases, we give below a few indications on specific galaxies when we think it is useful and we indicate if clusters are merging whenever this information is available. In particular, we mention if the positions of the jellyfish candidates lie in the direction of the general elongation of the cluster, defined both from the position angle of the brightest cluster galaxy, from the alignment of the brightest cluster galaxies, and from the red-sequence galaxy density maps drawn by Durret et al. (2016) and Durret et al. (2019) when available. This direction should trace the orientation of the filamentary regions, at large scale, where each cluster is embedded, and along which one would expect the largest galaxy infall to happen (e.g. West, 1994; West et al., 2017). Thus, these regions are the privileged areas for infalling late-type galaxies to become jellyfish as they enter with high speed and move across the cluster denser environment.
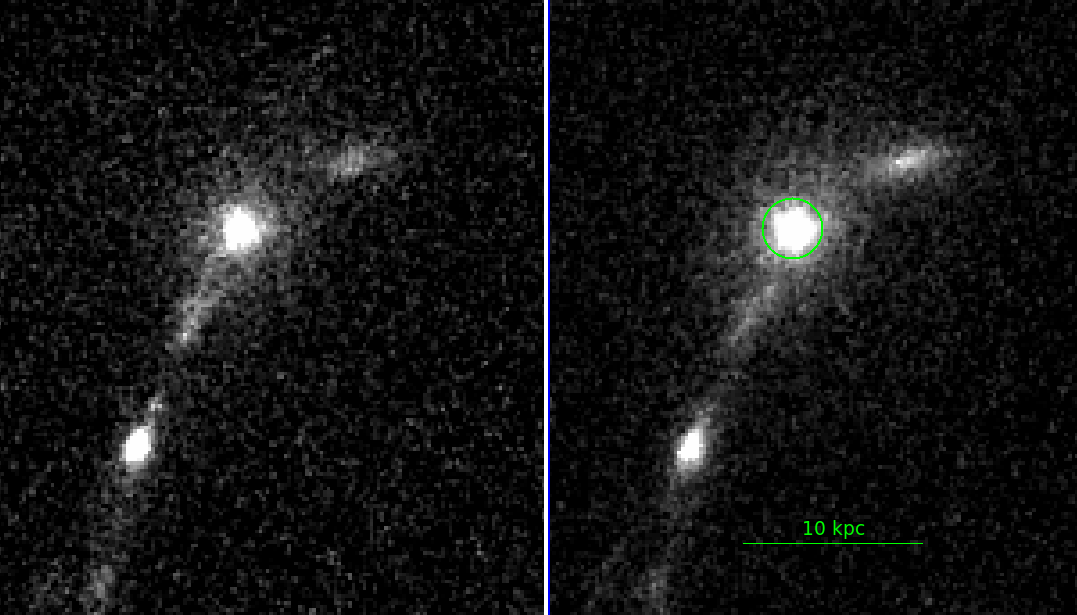
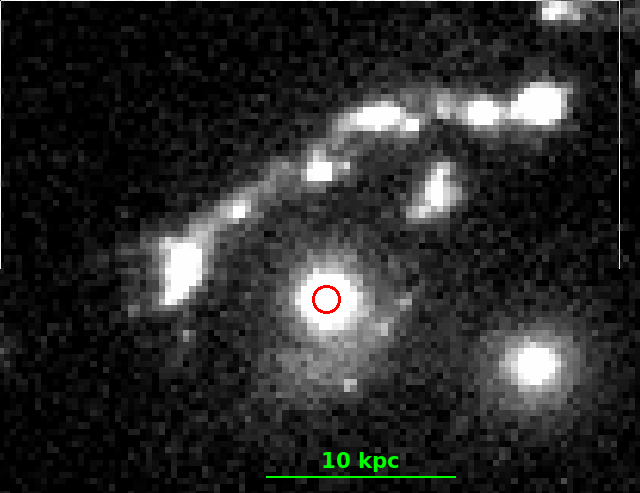
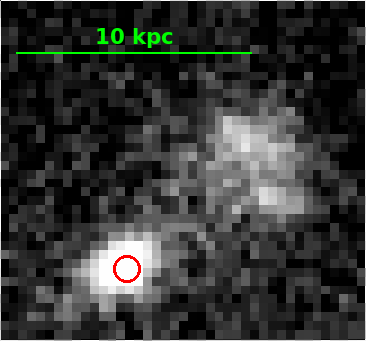
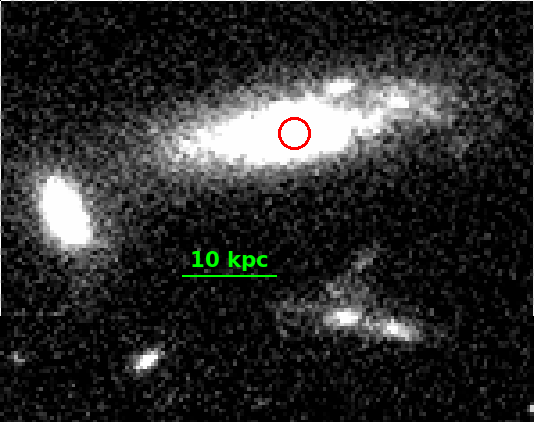
When two galaxies are located in the same frame, the galaxy with a spectroscopic redshift at the cluster redshift is indicated with a circle in images of Appendix B.
4.2.1 Cl 0016+16 (z=0.5455)
Images of the eight jellyfish galaxy candidates in Cl0016+16 are shown in Fig. 22.1. Out of the eight jellyfish galaxies (out of 103 galaxies at the cluster redshift), four are well aligned with the general cluster elongation (see Durret et al. (2019), Fig. B.1), and three others are not far from this region/direction.
4.2.2 Abell 209 (z=0.206)
4.2.3 Cl 0152.7-1357 (z=0.831)
Images of the six jellyfish galaxy candidates (out of 66 galaxies at the cluster redshift) are shown in Fig. 24. All of them are in the Northern part of this merging cluster (see Guennou et al. (2014) and references therein), which is the main zone covered by the HST image. Based on X-ray data and on a large number of galaxy spectroscopic redshifts, Girardi et al. (2005) showed that Cl0152.7-1357 consists of three galaxy clumps of different mean velocities: a low velocity clump in the central-South-West region, a high velocity clump in the Eastern region, and a weaker Eastern clump.
4.2.4 Abell 383 (z=0.1871)
4.2.5 MACS J0416.1-2403 (z=0.396)
Images of the eight jellyfish galaxy candidates (out of 205 galaxies at the cluster redshift) are shown in Fig. 26. Galaxy f may be superimposed on a gravitational arc. Out of the eight jellyfish galaxies, seven seem to be roughly spatially aligned with the main cluster merging axis.
4.2.6 MACS J0429.6-0253 (z=0.399)
Images of the two jellyfish galaxy candidates (out of only two galaxies at the cluster redshift) are shown in Fig. 27, none of them being located along the main cluster elongation area.
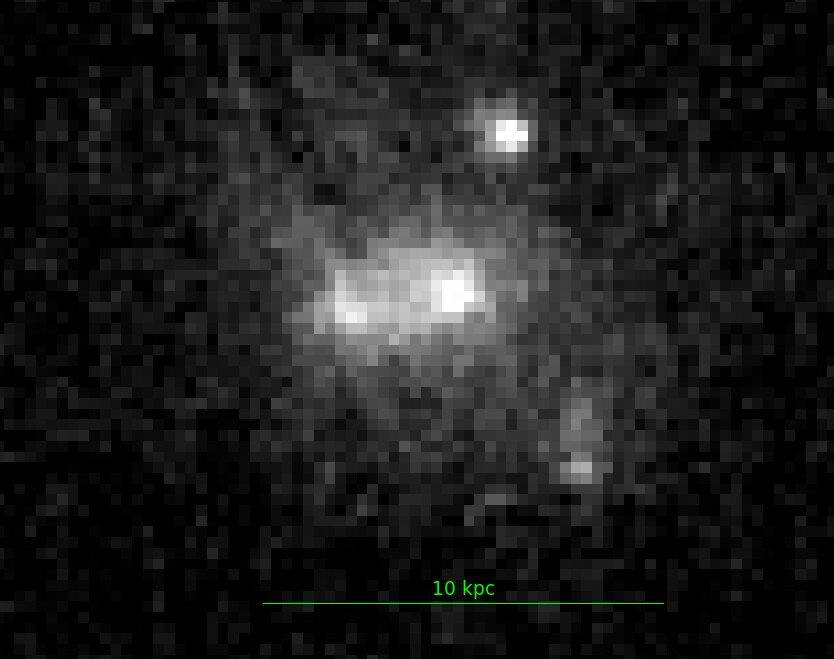
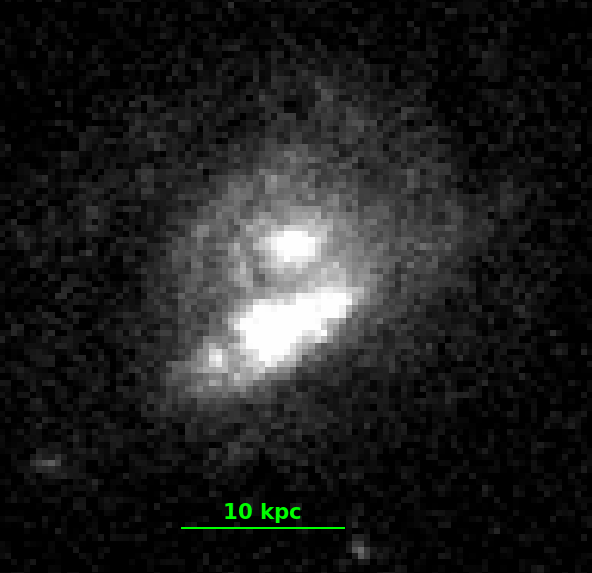
4.2.7 MACS J0454.1-0300 (z=0.5377)
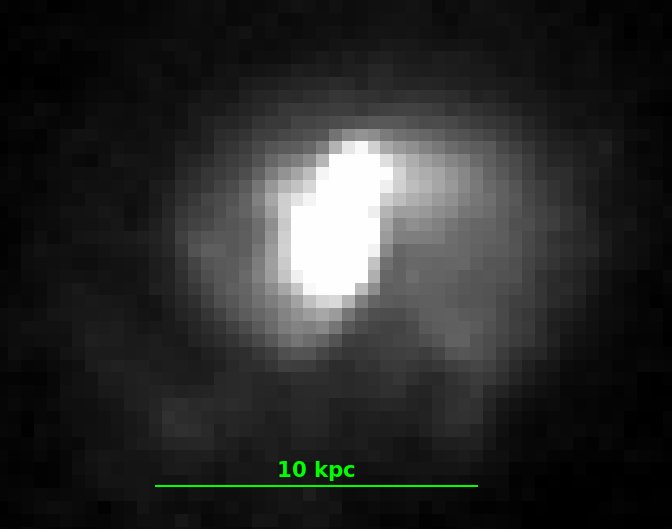
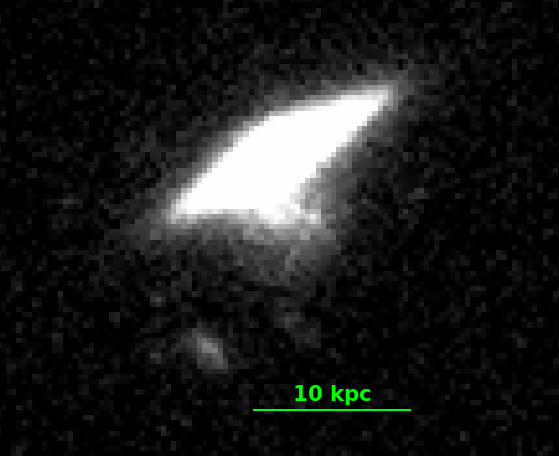
Images of the five jellyfish galaxy candidates (out of 92 galaxies at the cluster redshift) are shown in Fig. 28. Galaxy a may not be a jellyfish galaxy, but we keep it in the sample because of its two nuclei. Two galaxies follow the main cluster elongation, and a third one is close-by.
4.2.8 Abell 851 (z=0.4069)
4.2.9 LCDCS 0172 (z=0.6972)
The images of the nine candidate jellyfish galaxies (out of 45 galaxies at the cluster redshift) are displayed in Fig. 30, and show no particular spatial distribution.
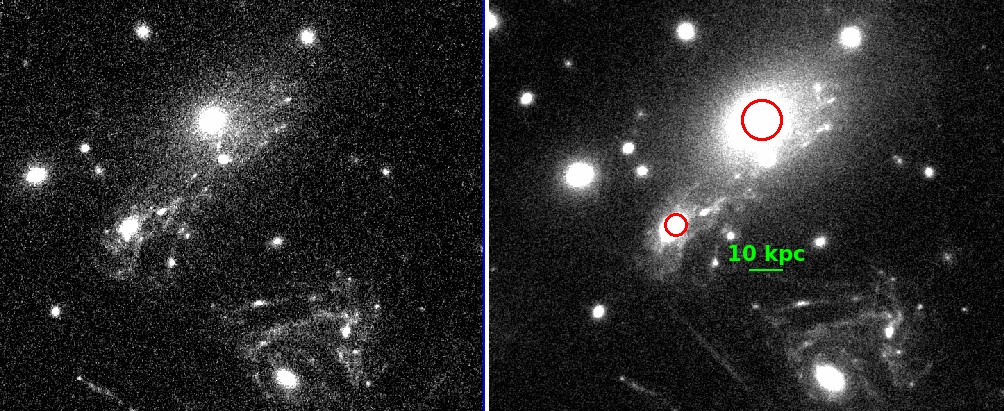
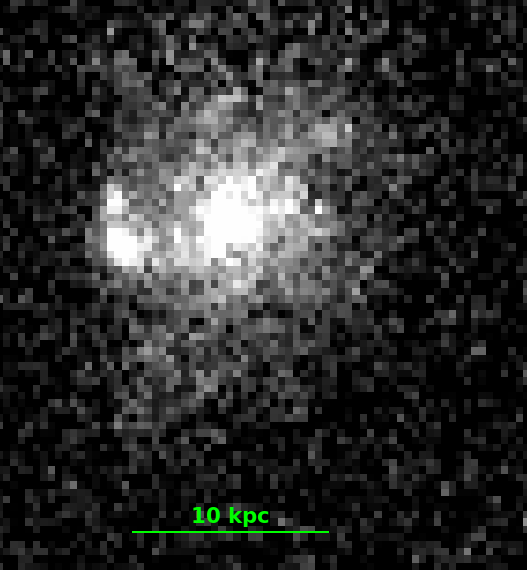
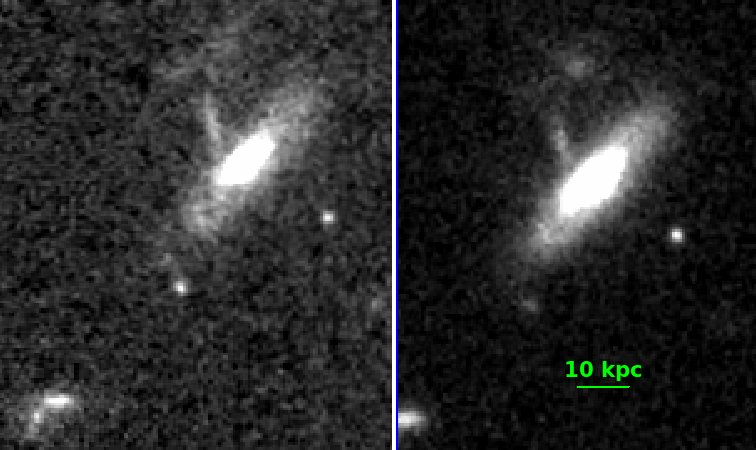
4.2.10 MACS J1149.5+2223 (z=0.544)
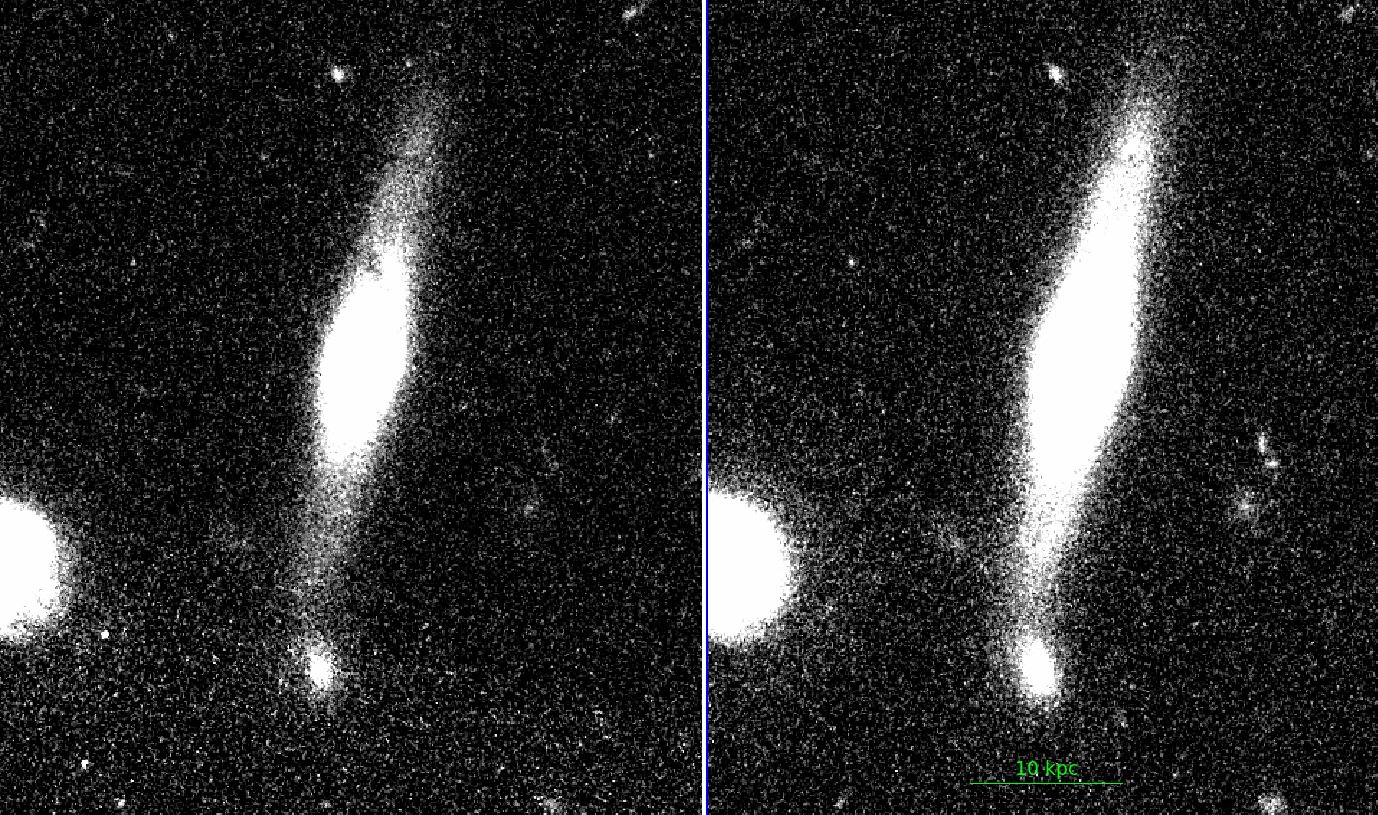
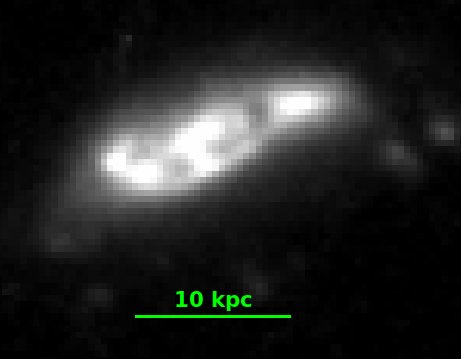
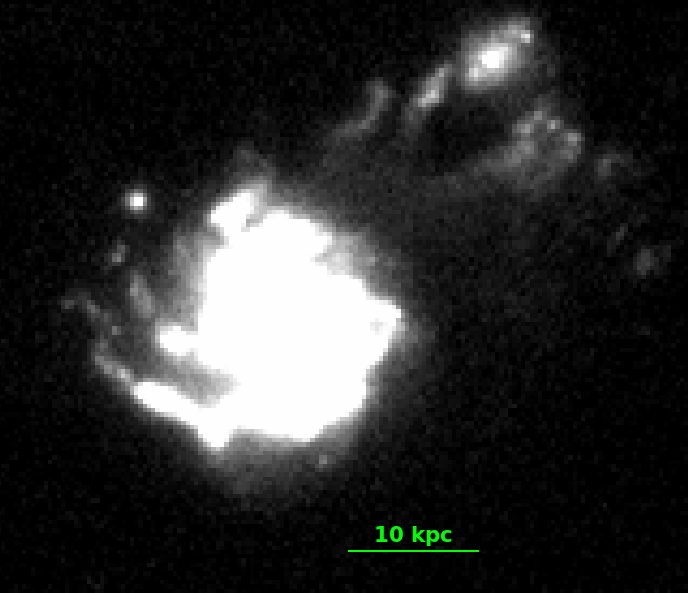
Images of the four jellyfish galaxy candidates (out of 106 galaxies at the cluster redshift) are shown in Fig. 31. Three of them follow the main cluster elongation. Galaxies c and d are interacting, with many filaments in their neighbourhood. Thus the image also shows their environment.
4.2.11 MACS J1206.2-0847 (z=0.44)
Images of the three jellyfish galaxy candidates (out of 64 galaxies at the cluster redshift) are shown in Fig. 32. Two of these galaxies are located along the main cluster elongation.
4.2.12 LCDCS 0541 (z=0.5414)
Images of the seven jellyfish galaxy candidates (out of 80 galaxies at the cluster redshift) are shown in Fig. 33. Their spatial distribution shows no particular trend. The bright arc North and East of galaxy e is a gravitational arc.
4.2.13 [MJM98]_034 (z=0.383)
4.2.14 LCDCS 0829=RXJ1347 (z=0.451)
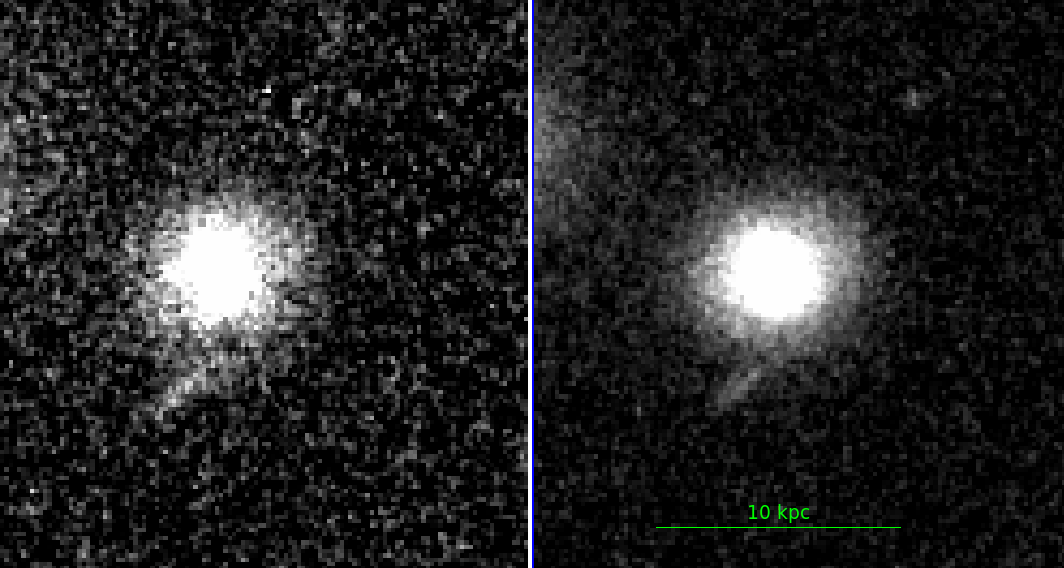
Image of the single jellyfish galaxy candidate (out of 35 galaxies at the cluster redshift) is shown in Fig. 35. Its position is roughly aligned with the cluster elongation.
4.2.15 LCDCS 0853 (z=0.7627)
Images of the seven jellyfish galaxy candidates (out of 20 galaxies at the cluster redshift) are shown in Fig. 36. All seven galaxies are located in the South-East quarter of the cluster.
4.2.16 3C 295 (z=0.4600)
Images of the eight jellyfish galaxy candidates (out of 30 galaxies at the cluster redshift) are shown in Fig. 37. They show no particular distribution throughout the cluster. Due to different spatial coverage, some appear in both filters, others only in one.
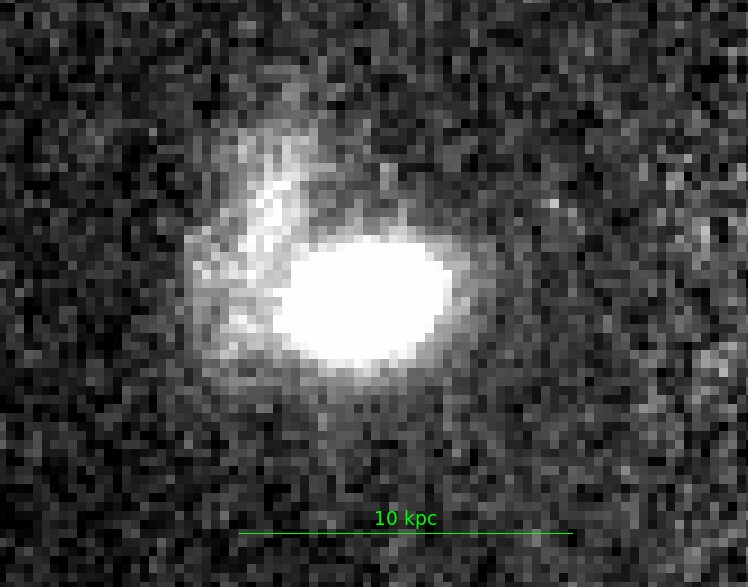
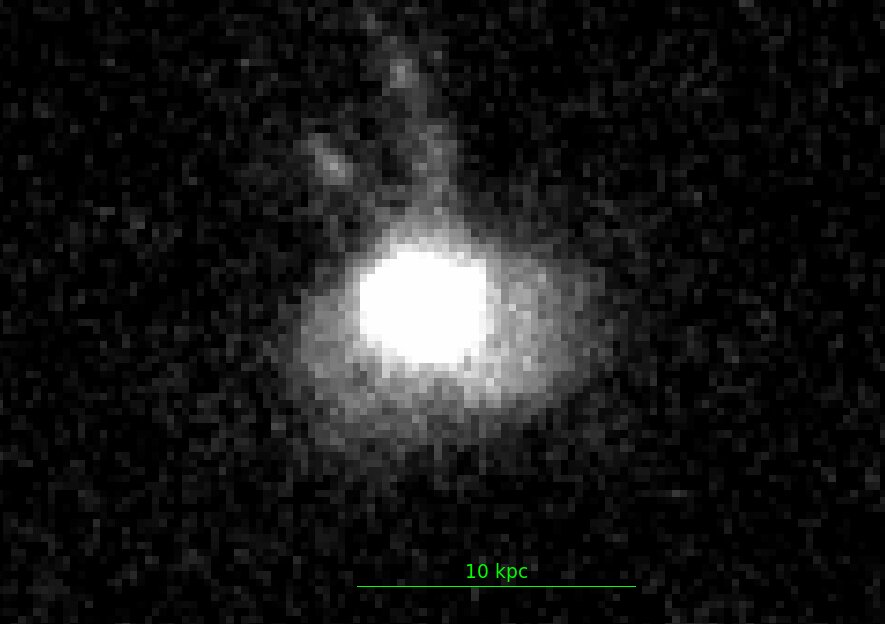
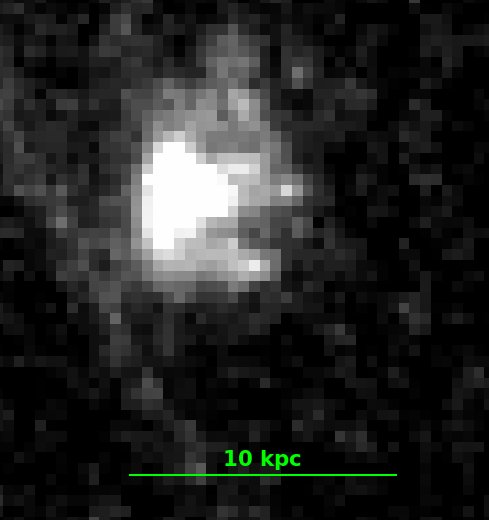
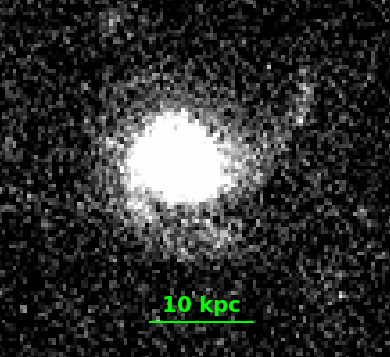
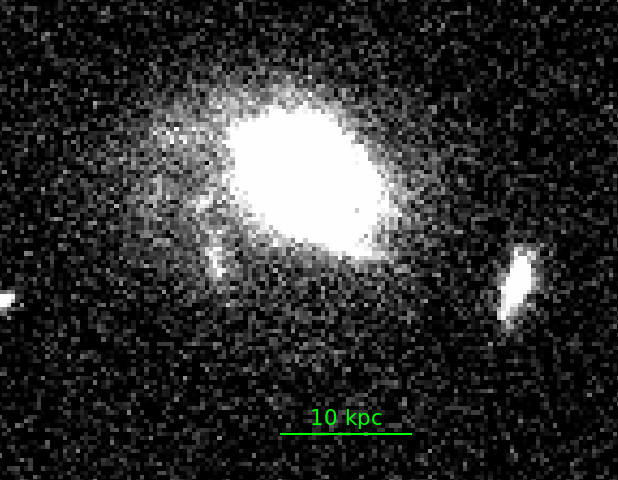
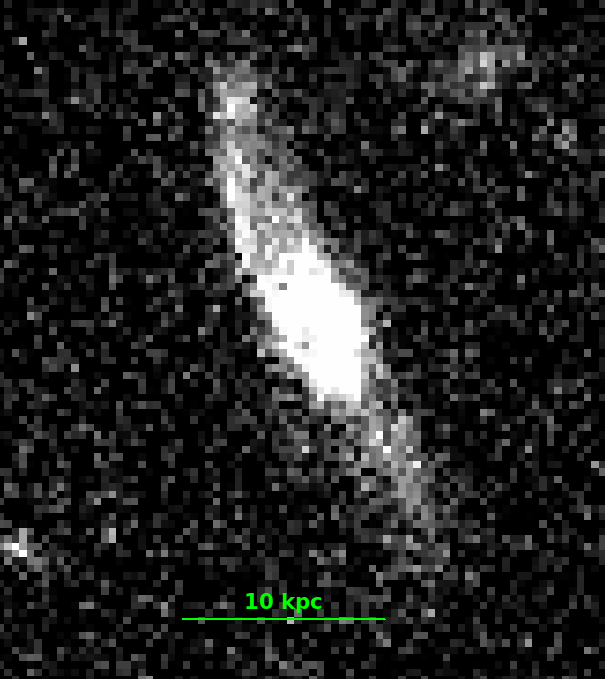
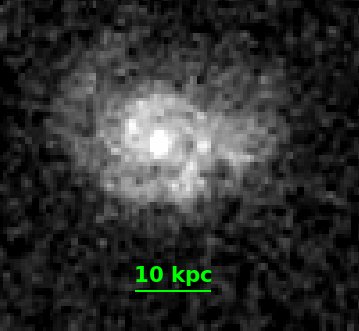
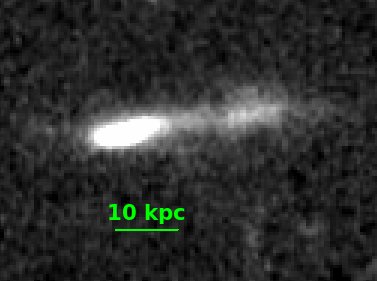
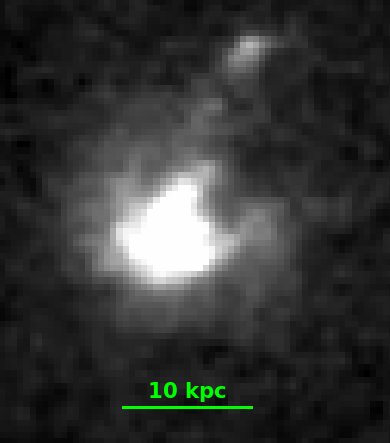
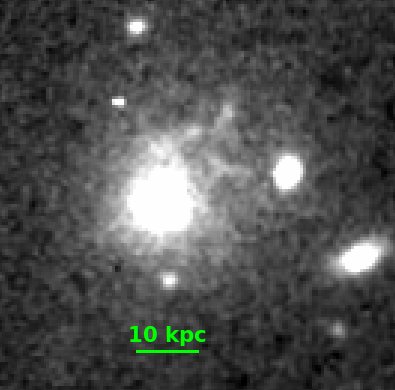
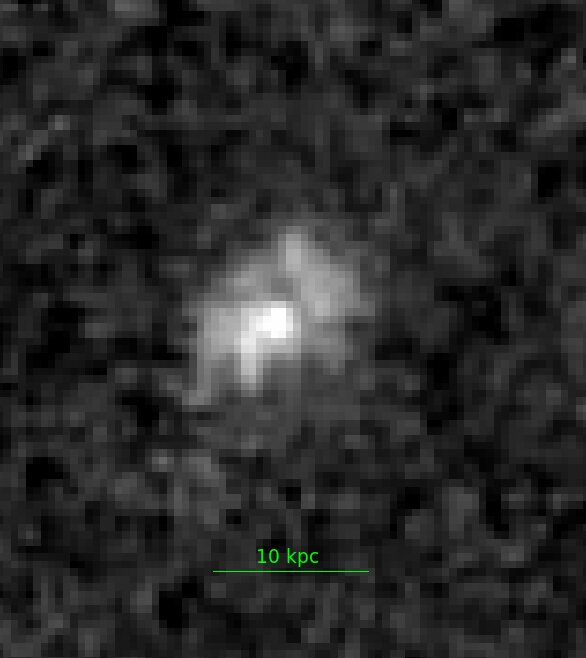
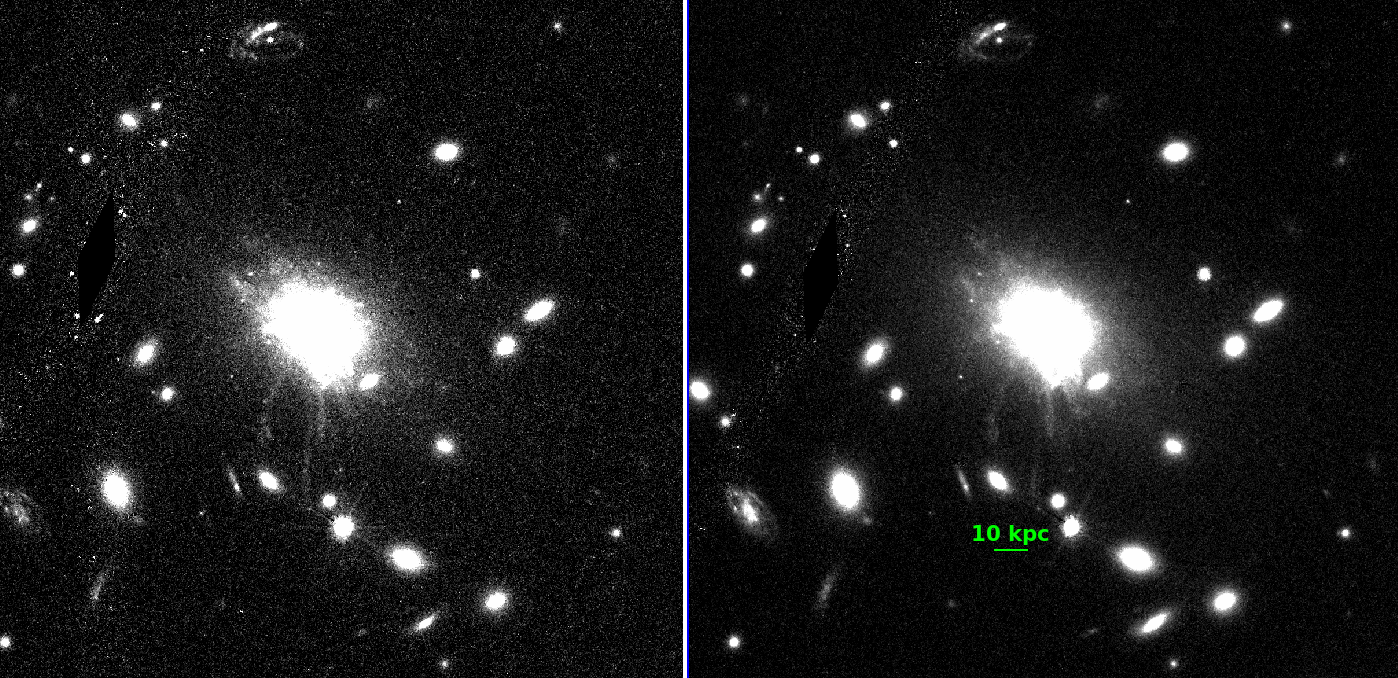
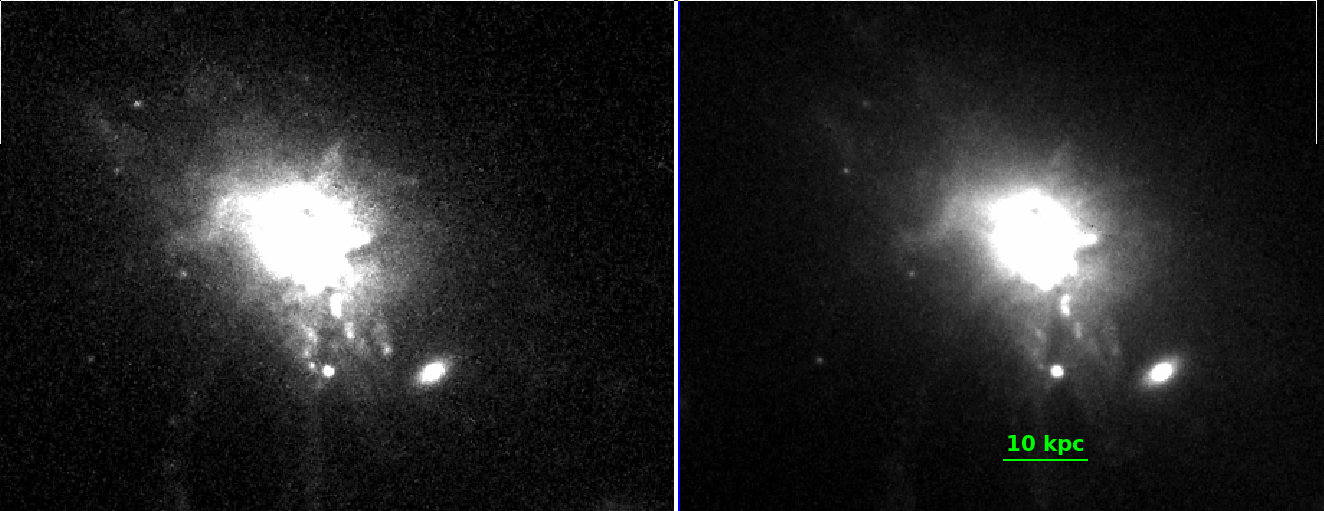
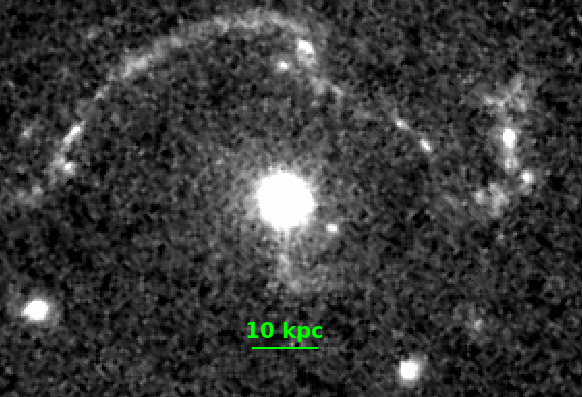
4.2.17 RX J1532.9+3021 (z=0.345)
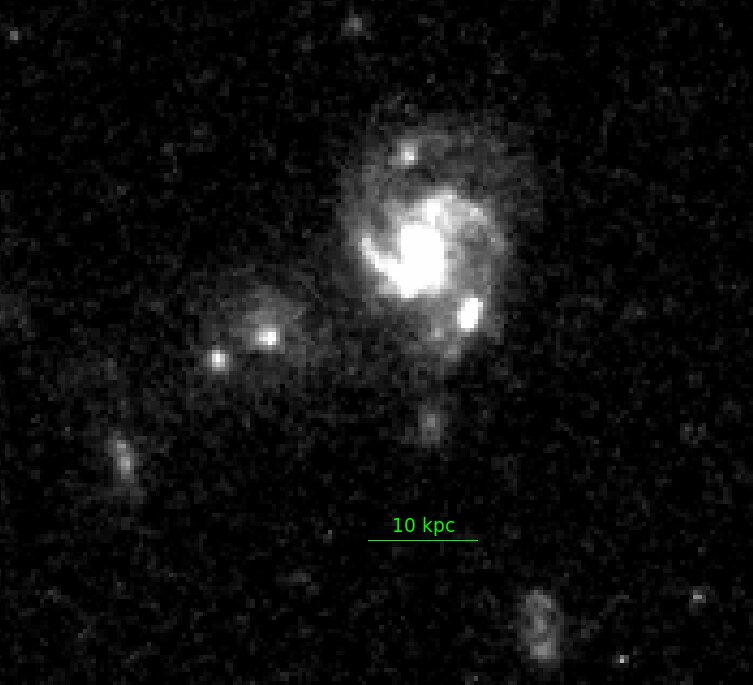
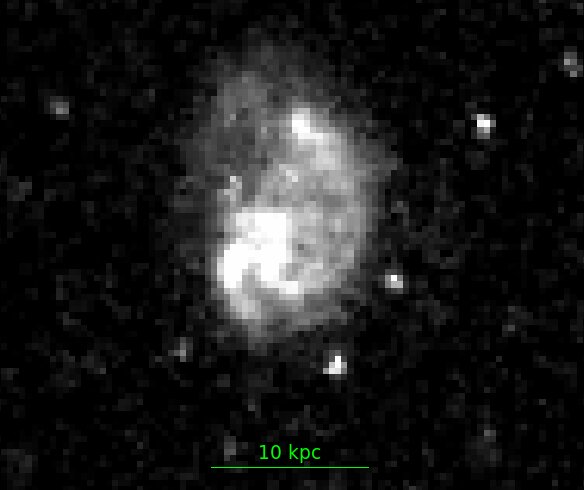
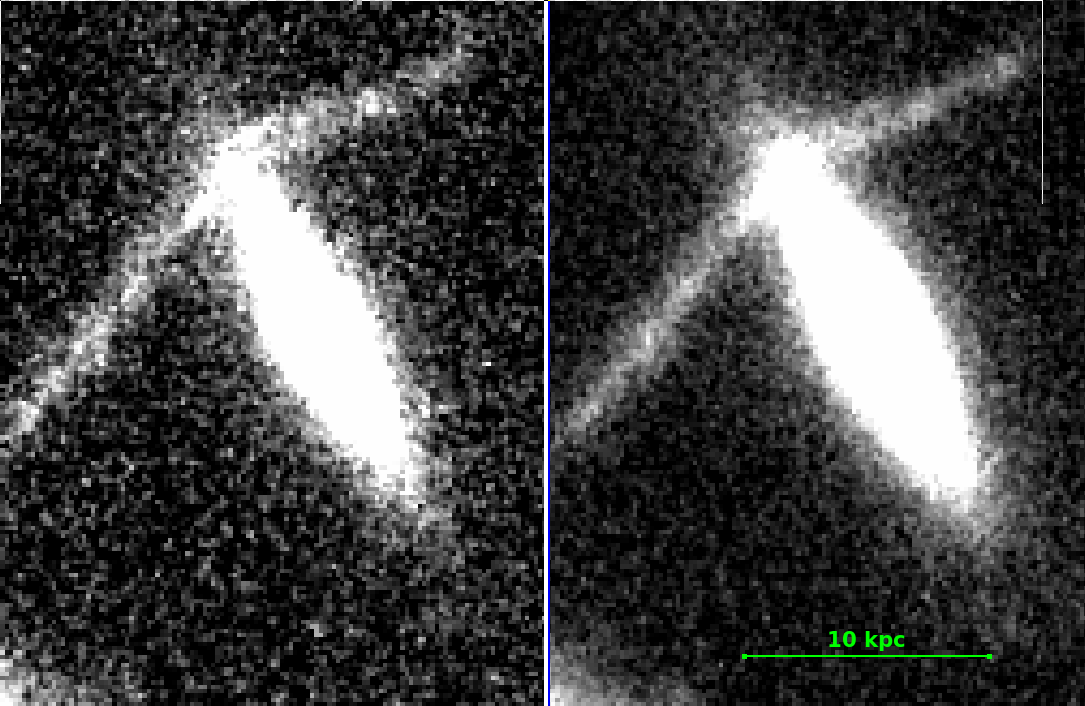
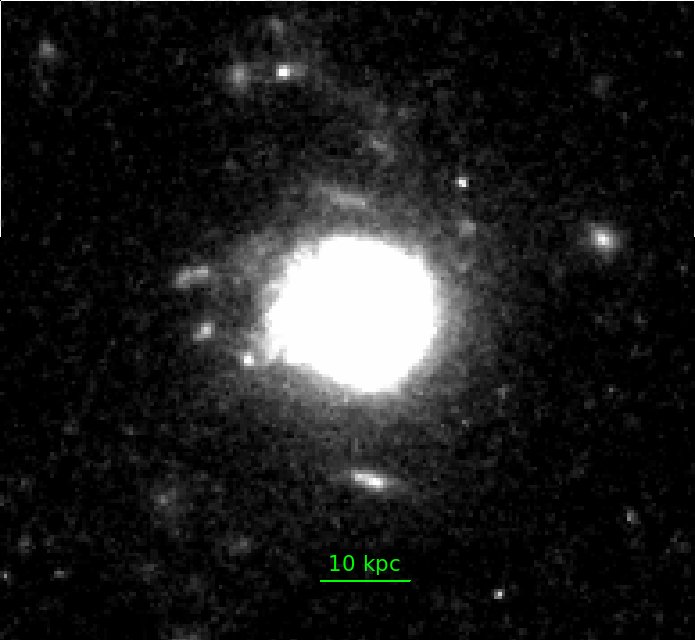
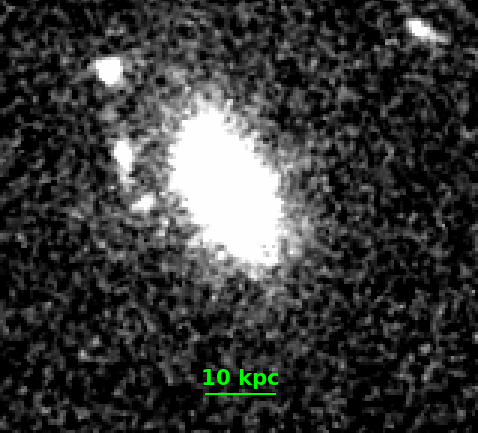
Image of the single jellyfish galaxy candidate (this galaxy is in fact the brightest cluster galaxy, and there is only one other galaxy with a measured redshift in the cluster) is shown in Fig. 38, as well as a zoomed image showing a disturbed structure.
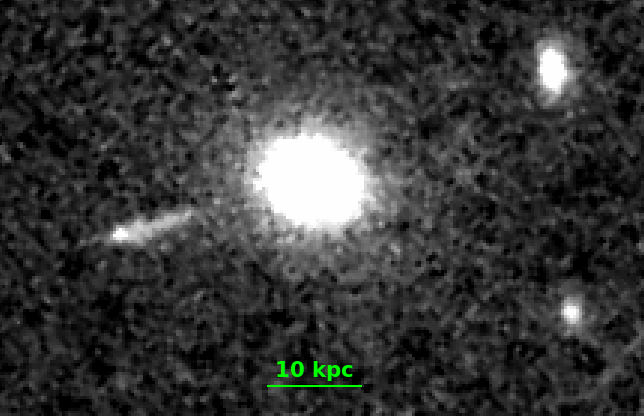
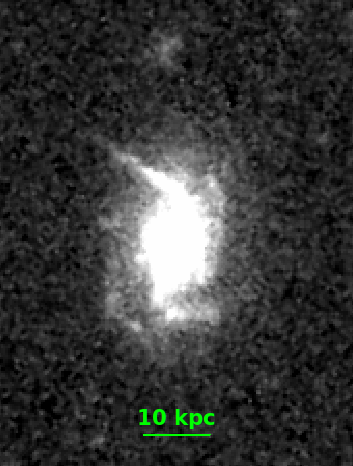
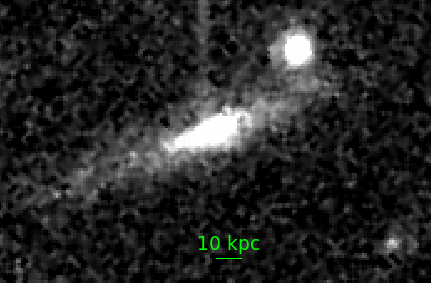
4.2.18 MS 1621.5+2640 (z=0.426)
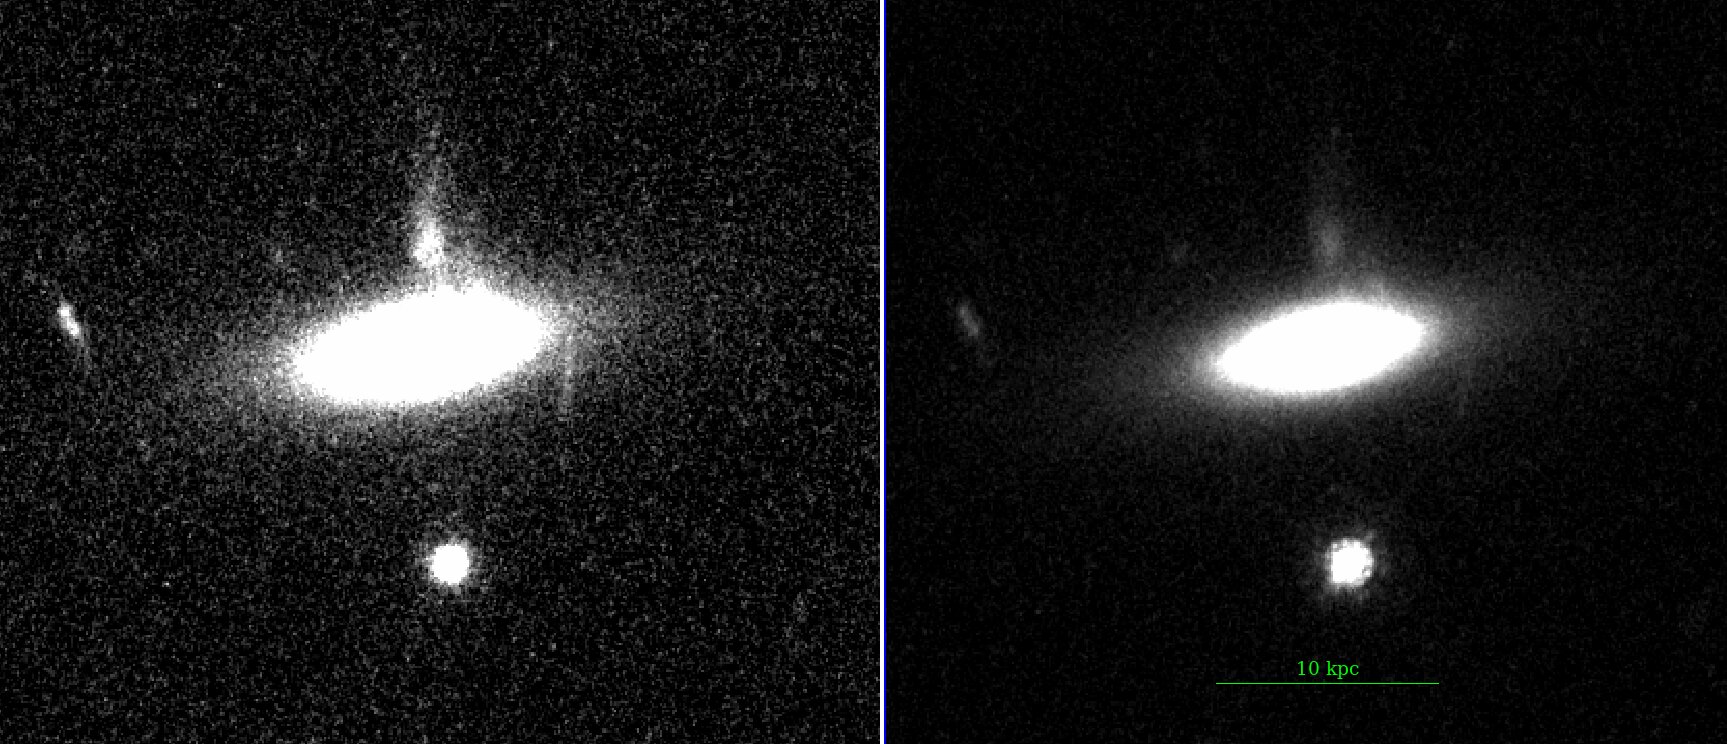
Images of the three jellyfish galaxy candidates (out of 31 galaxies at the cluster redshift) are shown in Fig. 39. They show no particular distribution in the cluster. The two filters do not cover exactly the same region. Galaxy a may be interacting with one or two galaxies, but spectroscopic redshifts are not available for these objects. Galaxy b has a plume of emission to the South, and seems to be surrounded by gravitational arcs in the North. Spectroscopy is also needed to confirm the jet-like feature East of galaxy c.
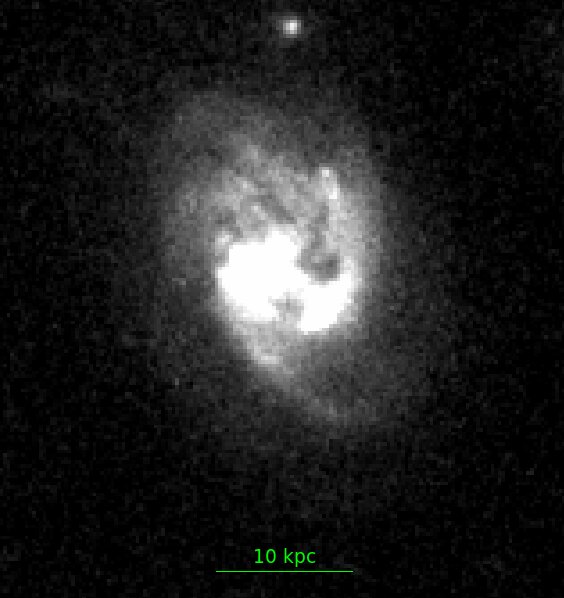
4.2.19 RX J1716.4+6708 (z=0.813)
Image of the single jellyfish galaxy candidate (out of 22 galaxies at the cluster redshift) is shown in Fig. 40.
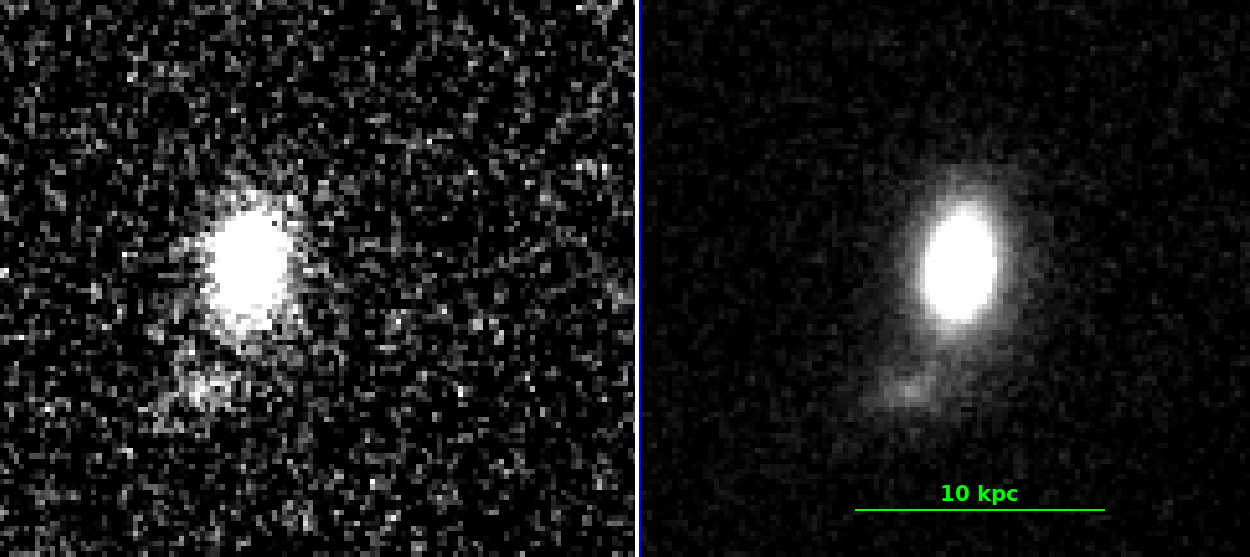
4.2.20 MACS J1931.8-2634 (z=0.352)
Images of the two jellyfish galaxy candidates (out of only three galaxies at the cluster redshift) are shown in Fig. 41.
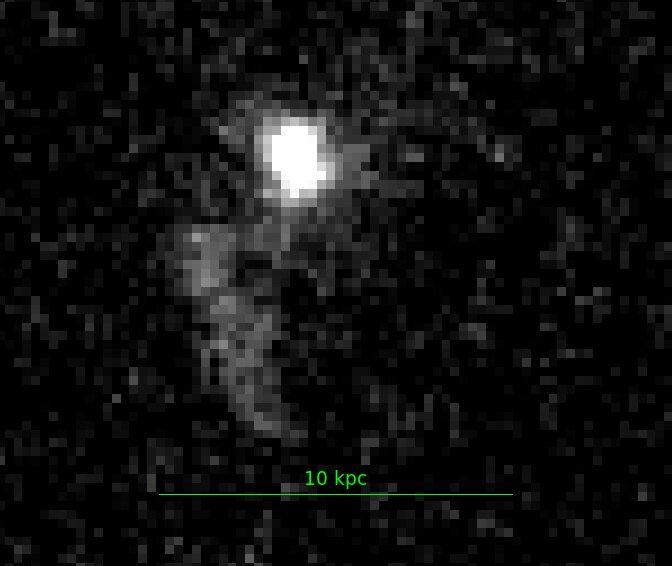
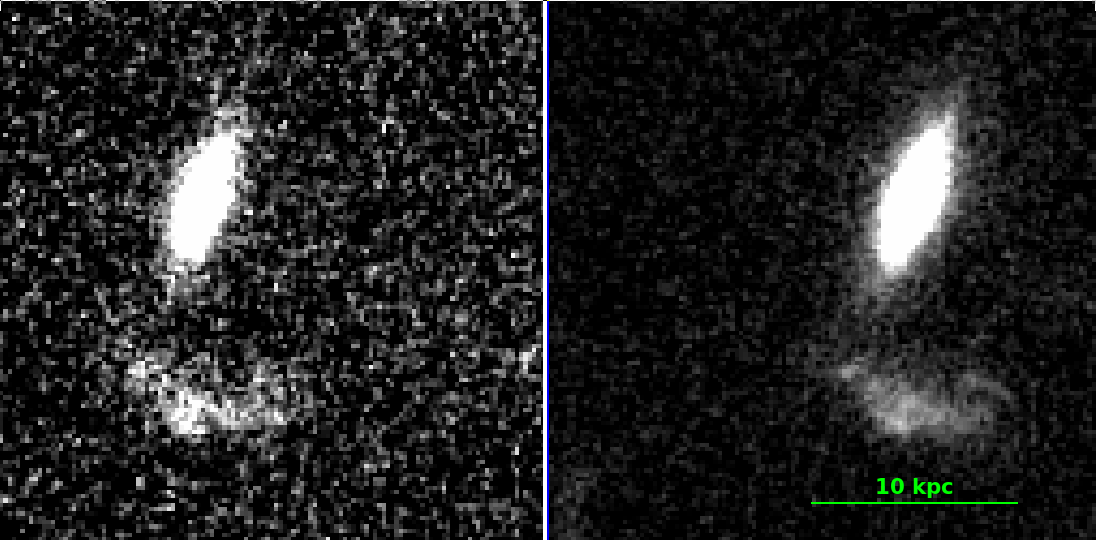
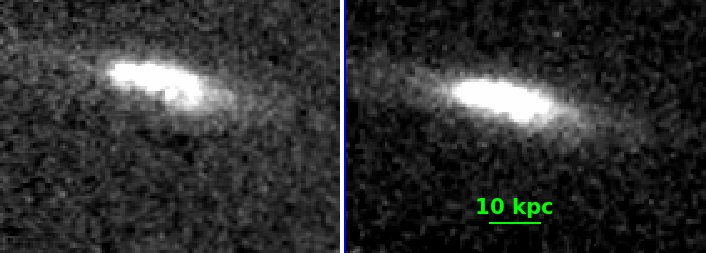
4.2.21 MS 2053.7-0449 (z=0.583)
Image of the single jellyfish galaxy candidate (out of 32 galaxies at the cluster redshift) is shown in Fig. 42. It lies exactly North of the cluster centre, positioned along the direction of the cluster elongation.
4.2.22 RX J2248.7-4431 (z=0.348)
Images of the five jellyfish galaxy candidates (out of 42 galaxies at the cluster redshift) are shown in Fig. 43. Two out of five galaxies are located within the cluster elongation area/direction.
5 Jellyfish galaxy candidate properties
5.1 Spatial distribution relative to the cluster centre
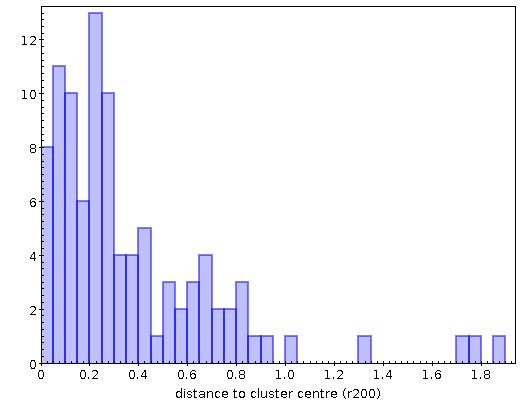
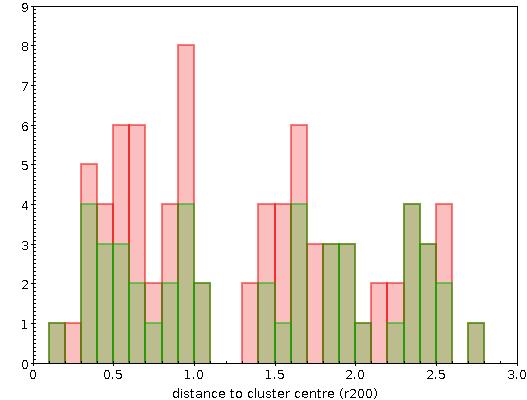
The histogram of the projected distances of jellyfish galaxy candidates to the centre of the respective cluster is shown in Fig. 6, where we compare the result already shown for MAC0717 but limited to within 1800 kpc (on the left) with the results obtained for all the other clusters taken together (right panel). This figure shows that the number of jellyfish galaxy candidates in the central region of MACS0717 is rather small, whereas it is large in the ensemble of all the other clusters. Unlike for MACS0717, our coverage of the remaining clusters is far from complete; nonetheless, this result indicates that in MACS0717 there seems to be a real absence of jellyfish galaxy candidates in the innermost cluster region.
5.2 Spectral energy distribution
5.2.1 SED fitting for jellyfish galaxy candidates in MACS J0717.4+3745
We matched our catalogue of 81 jellyfish galaxy candidates detected in MACS0717 with the eight band optical and infrared ground-based catalogue covering the entire region of MACS0717 described in Section 2. We found 79 galaxies in common using a match radius of 1.5 arcsec.
We then used LePhare (Ilbert et al., 2006), through the GAZPAR interface777https://gazpar.lam.fr/home, to fit the spectral energy distributions (SED) of these 79 jellyfish galaxy candidates with the Bruzual & Charlot (2003) models and the Chabrier (2003) initial mass function: based on an input catalogue with positions, magnitudes and corresponding errors, and in our case spectroscopic redshift, LePhare fits the galaxy SED, computes absolute magnitudes in the input bands, and infers, from the best fit template in each case, the stellar mass, star formation rate, specific star formation rate, mean stellar population age, as well as other quantities that we will not consider here. The input parameter space was carefully selected so as to cover the expected characteristics of late-type galaxies with probable SF activity.
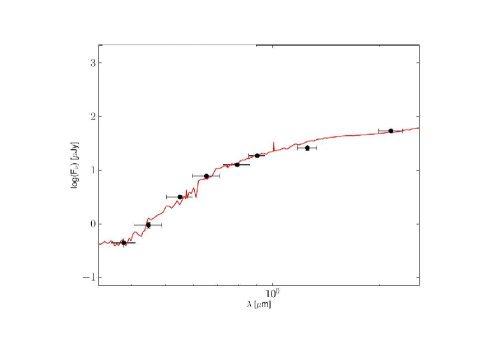
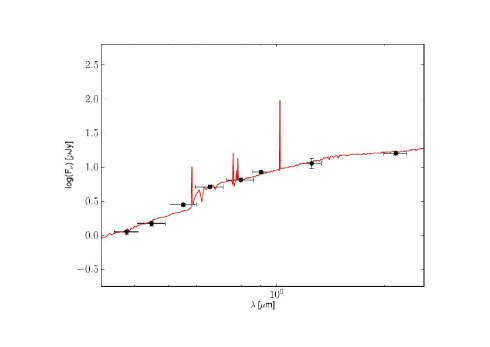
We can note that for all 79 galaxies but a few the best fit template spectrum includes an H line, and among these about 80% of the template spectra include all the main emission lines in the optical ([OII]3727, [OIII]4959, 5007, H and H), thus implying that the majority of our jellyfish candidates are forming stars. As an illustration of the obtained fits, we show in Fig. 7 the SED and best fit templates for two galaxies, one with only a weak H emission line and one with several emission lines in the best fit template. We see that these fits are quite good, and this was indeed the case for all galaxies that GAZPAR/LePhare analysed.
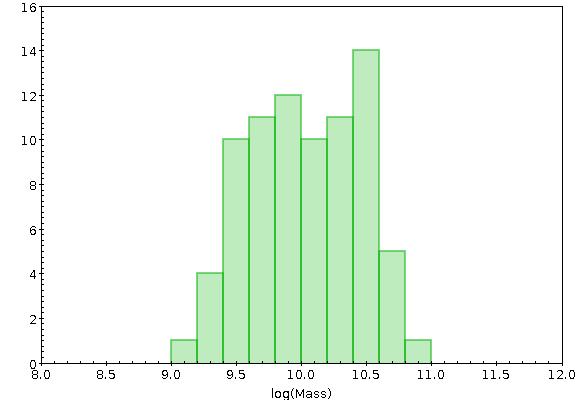
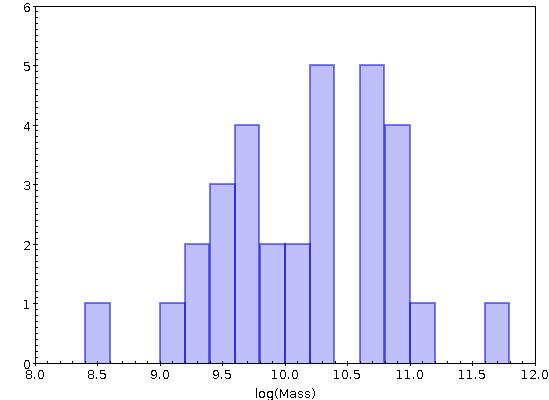
The histogram of jellyfish galaxy candidate stellar masses in MACS0717 is shown in the left-hand panel of Fig. 8. The galaxies cover the range of stellar masses between and M⊙. We divided the sample into high-mass (log M ) and low-mass (log M ) galaxies and checked their spatial distribution but found no difference between these two samples.
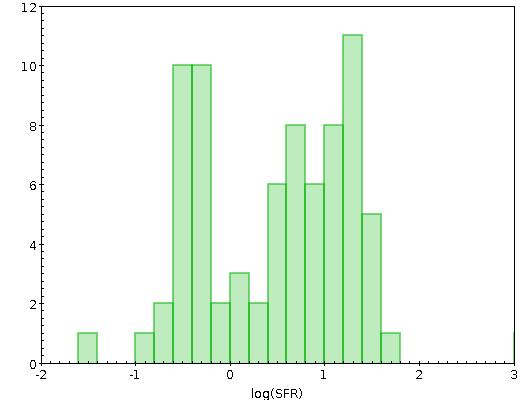
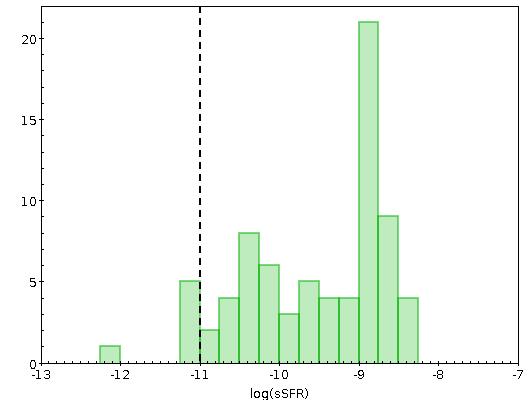
The histogram of jellyfish galaxy candidate star formation rates for MACS0717 is shown in the left hand panel of Fig. 9. The SFRs cover a large range, essentially between 0.1 and 60 M⊙ yr-1. We also show in Fig. 10 the histogram of the specific star formation rates in MACS0717: values go from to yr-1 (except for two galaxies that have very low sSFRs and do not appear on the figure), and more than 30 galaxies have sSFR yr-1. We mark on the sSFR histograms the indicative value of log(sSFR) below which galaxies are commonly considered to be quiescent.
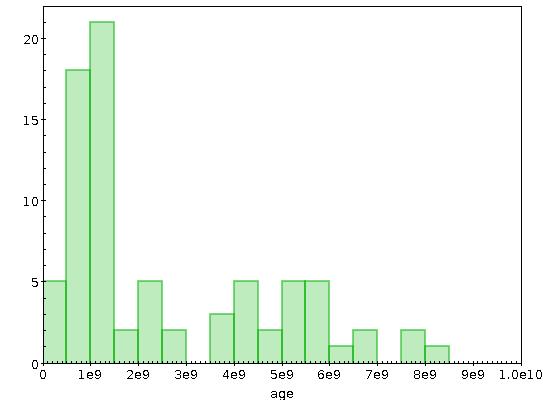
The histogram of the stellar population age for the jellyfish galaxy candidates in MACS0717 is shown in Fig. 11. We can see that more than half of the galaxies are, on average, younger than yrs, so the stellar population is globally quite young.
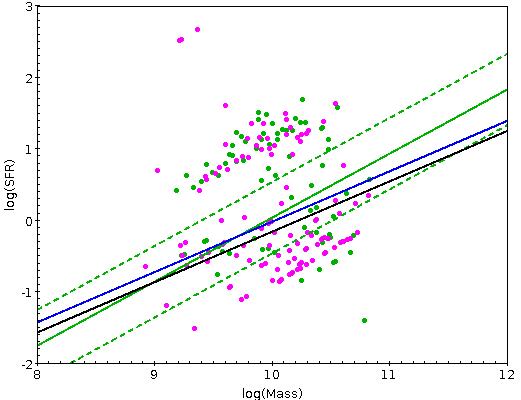
The relation between the SFR and galaxy stellar masses is shown in Fig. 12. We superimposed on this plot the main sequence of SF galaxies as determined by Peng et al. (2010), based on a very large sample of galaxies from the SDSS and zCOSMOS surveys, and its dispersion that we estimated to be around the relation (see their Fig. 1). We see that 12 (15%) jellyfish galaxies are below this sequence, 23 (29%) are in the interval of Peng et al. (2010), and the 44 other ones (56%) lie above the SF main sequence.
In agreement with the previously noted fact that SEDs of the jellyfish galaxies in MACS0717 are in majority best fitted by a spectrum including one or several emission lines, this confirms that, in average, jellyfish galaxy candidates seem to have a higher SFR than “normal” star forming galaxies of the same stellar mass. Figure 12 suggests that the majority seems to form a sequence parallel to that of Peng et al. (2010), but with a SFR about 10 times higher. There are, however, a few cases of very low specific star formation rates: these galaxies are apparently quenched, as indicated by the log(sSFR) criterion (see Fig. 10).
As a comparison, we also obtain an SED fit for 442 galaxies in the same redshift interval but not classified as jellyfish candidates. Out of these, 113 galaxies can be considered as non-quiescent (specific star formation rate log(sSFR)). We also include these galaxies in Fig. 12. One can see that they cover more or less the same region as the jellyfish candidates. However, if we calculate the average sSFR for the jellyfish candidates and for this control sample, both limited to logsSFR (respectively: 71 and 113 galaxies), we find respective values of and , suggesting that the sSFR is about 3 times larger for jellyfish candidates. In view of the errors on these quantities, this value of 3 should not be taken at face value, but it does suggest that jellyfish galaxies have a sSFR higher than that of “normal” galaxies.
We also overplot on Fig. 12 (left panel) the relations found by Vulcani et al. (2018) for disks of ram pressure stripped galaxies (in blue), and undisturbed galaxies (in black). One can note that at least half of our jellyfish candidates are located above both their sequences.
As a final check, and since jellyfish galaxies are very often systems with an increased star formation rate (see the Introduction), we verified if our results were affected by classification errors in the following manner. We divided our sample in two sub-samples based on the classF column of Table 2: types 1 and 2 on one side, types 3, 4 and 5 on the other. We then checked the numbers of each type in Fig. 12 (left), to see if the galaxies with a SFR lower than the main sequence were in majority of types 1 or 2 (i.e. galaxies that may not be jellyfish galaxies after all). The percentages of jellyfish galaxy candidates of types 1 and 2 with a SFR below, in, and above the Peng sequence are comparable to those given above for all the jellyfish galaxy candidates. We therefore consider that galaxies with a low SFR are not necessarily doubtful jellyfish galaxies. This means that a number of our jellyfish candidates are indeed undergoing a phase of low star formation activity.
5.2.2 AGN activity in MACS0717 jellyfish candidates
An interesting link between the presence of jellyfish features and AGN activity was explored by Poggianti et al. (2017a), who found a strong correlation between these parameters for the most extreme examples of jellyfish galaxies in their GASP sample. Motivated by this, we checked if any of our jellyfish candidates in MACS0717 showed signs of hosting an AGN. This is a hard task with the limited data available so, considering the possibilities, we opted for using the MIR criteria, based on WISE colors, developed by Mateos et al. (2012) and Stern et al. (2012). Both are optimized to select luminous AGN so we will likely just uncover the tip of the iceberg.
We used the Table Access Protocol (TAP) Query service of TOPCAT (Taylor, 2005) to access and download the DR8 tractor catalogue limited to the area covered by the HST observations. This catalogue contains magnitudes in all four WISE bands, extracted by the DESI team in preparation for their Legacy Survey, that go about 1 magnitude deeper than the original AllWISE ones (D. Schlegel, private communication). We converted these de-redenned AB magnitudes to the Vega system, following the DESI webpage information888https://www.legacysurvey.org/dr8/description/, to apply directly the above mentioned criteria. We then matched this catalogue with our own: for a search radius of 1.5 arcsec, 79 of our 81 galaxies had data in the DR8 tractor catalogue, allowing us to check their W1-W2 color index. Out of these, only two barely pass the Stern et al. (2012) threshold for identifying AGN, i.e. a color index W1-W2¿0.8, imposing as well a S/N¿5 for the WISE individual magnitudes. These are galaxies #9 and #59 of Table 2. Applying the stricter Mateos et al. (2012) criterion, in the W1-W2 versus W2-W3 color plane, results in no AGN candidates.
Our marginal AGN candidates are located in regions of high density. One lies on top of the 1 Mpc central radius (black circle in Fig. 3), to the right, has v/, W1-W2=0.90 and J class 4 attributed by both FD and SC: it is galaxy #9 of Table 2, marked with a red symbol in Fig. 3. The other one lies close to the northern edge of the yellow vertical ellipse of Fig. 3, where it is marked by a blue symbol (galaxy #63; J class 2 and 3 by FD and SC, respectively) and has v/ and W1-W2=0.84. The respective stellar masses of galaxies #9 and #59 are and M⊙, and their respective SFRs are 6.9 and 14.7 M⊙ yr-1. However, if these galaxies indeed host an AGN, then the LePhare output parameters can only be taken as indicative since they are likely affected by larger uncertainties (the SED fits did not take into account any AGN contribution).
5.2.3 SED fitting results for other CLASH clusters
| Cluster | # jellyfish |
|---|---|
| candidates | |
| Abell 209 | 2 |
| Abell 383 | 2 |
| MACS J0416.1-2403 | 8 |
| MACS J0429.6-0253 | 2 |
| MACS J1149.5+2223 | 4 |
| MACS J1206.2-0847 | 3 |
| LCDCS 0829 | 1 |
| RX J1532.9+3021 | 1 |
| MACS J1931.8-2634 | 2 |
| RXC J2248.7-4431 | 5 |
In our cluster sample, there are 11 CLASH clusters listed in Table 4, in which we find a total of 31 jellyfish galaxy candidates. These galaxies have optical and infrared magnitudes available (up to 17 bands between 225 nm and 1.6 m, from the CLASH program, see section 2).
We fit SEDs of these 31 galaxies in the same way as those in MACS0717 with GAZPAR/LePhare. The best fit template spectrum includes an H line for all but two galaxies and, except for these two, more than half of the best fit template spectra include all main emission lines in the optical ([OII]3727, [OIII]4959, 5007, H and H), here also suggesting that the majority of these jellyfish galaxy candidates are forming stars.
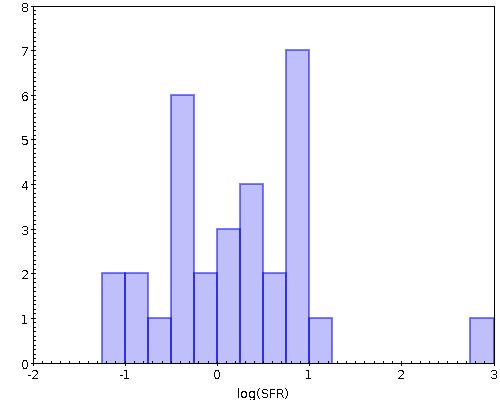
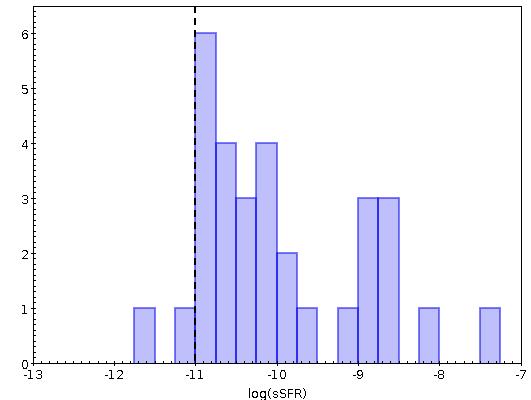
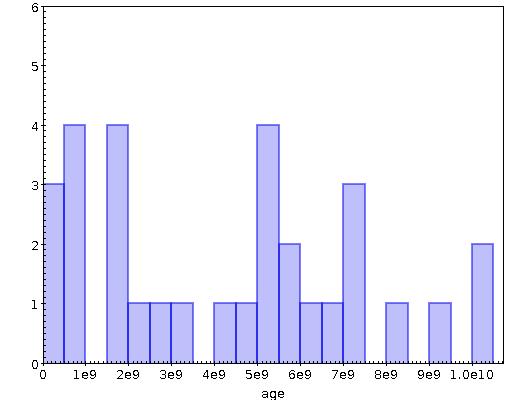
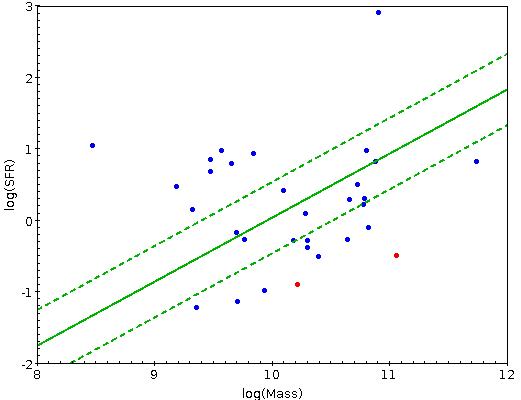
Similar plots to those shown for MACS0717 are given in the right panels of Figs. 8 to 12. We can see that stellar masses of these 31 galaxies cover a range comparable to that covered by the jellyfish galaxy candidates in MACS0717. Their SFRs are also comparable to those in MACS0717, but we can note that only two galaxies out of 31 (6%) have SFR M⊙ yr-1 (though one is possibly overestimated), whereas there are 25 (32%) in MACS0717. Fig. 12 also shows that while MACS0717 seems to be quite rich in jellyfish galaxy candidates having a high SFR, for the other clusters a clear assessment for comparison is difficult due to their incomplete coverage. The distribution of the specific star formation rate is quite different in the two samples (Fig. 10): 35 (44%) of the galaxies in MACS0717 have sSFR yr-1 while the distribution of sSFRs for the 31 other jellyfish galaxy candidates is “smoother”, with 12 (39%) galaxies having sSFR yr-1, though very few are quiescent (sSFR yr-1). Consistently, the distributions of the mean ages of the stellar populations of the two samples are also quite different, as seen in Fig. 11: half of the galaxies in MACS0717 are on average younger than yrs, while the age distribution in the sample of 31 galaxies is flatter.
Again, we underline that these comparisons are merely indicative, since the sample of 31 jellyfish galaxy candidates results from a spectroscopic and spatial coverage that is quite incomplete, and therefore by no means identical to that of MACS0717.
We also looked for variations of the stellar mass, SFR and sSFR with redshift for these 31 galaxies, but the dispersion is large, specially for the first two quantities, so we cannot claim there are clear correlations.
Finally, we checked if there was a correlation between the jellyfish classification and the stellar mass, both in the 79 galaxies of MACS0717 and in the 31 galaxies belonging to other clusters, and indeed found none, in agreement with the results of Poggianti et al. (2016).
5.3 Clusters with no jellyfish galaxy candidate identified
There are 17 clusters in our sample in which no jellyfish galaxy candidate was detected (see Table 1). For 13 of them, there are only between one and three galaxies with a spectroscopic redshift available at the cluster redshift, and located in the zone covered by HST images. For the remaining four clusters, BMW-HRI_J122657.3+333253, ZwCl 1332.8+5043, MACS J1423+24, and Abell 2261, there are respectively 23, 6, 7, and 14 galaxies with a spectroscopic redshift available at the cluster redshift, and located in the zone covered by HST. So obviously, at least in the last three of these four clusters, the absence of jellyfish galaxies in these clusters can simply be due to the small number of available redshifts.
6 Discussion and conclusions
We searched for jellyfish galaxy candidates in an initial sample of 40 clusters in the redshift range from the DAFT/FADA and CLASH surveys with HST optical images available. To this purpose, two of us examined the shapes of all galaxies with a spectroscopic redshift in the approximate cluster range. This approach led us to find one or several jellyfish galaxy candidates in 23 clusters (from the original set of 40), that were classified from J=1 to J=5, following the classification scheme proposed by Ebeling et al. (2014). In the remaining 17 clusters we found no jellyfish candidate. We analysed cluster MACS0717 separately, because it has a large HST coverage and spectroscopic catalogue: in this system, we found 81 jellyfish candidates. In the remaining 22 clusters, we detect a total of 97 jellyfish galaxy candidates.
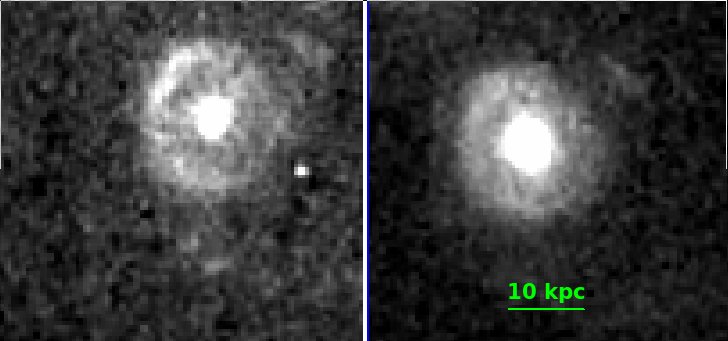
For all these jellyfish candidates, we give positions, redshifts, magnitudes in one or two optical filters (usually F606W and F814W), and show images in the Appendix. Whenever images are available for the galaxies in these two wavebands, we provide both: the comparison of galaxy images in the F606W and F814W filters shows that our candidates are morphologically quite similar in both, but with more evidence for star formation in the bluer filter. as expected.
A colour-magnitude diagram for MACS0717 shows that most of the 81 jellyfish candidates are blue and located below the cluster red sequence. This is reinforced by the UVJ diagram (Williams et al., 2009), where only two galaxies appear to be quenched; all remaining ones seem to be SF galaxies, even if several of them lie in the region of dust obscured objects (thus can be red sequence objects). For the 79 jellyfish candidates in this cluster having multiwavelength data available, the SED fitting that was carried out with LePhare finds that almost all are best fit by template spectra that have one or several of the main optical emission lines usually associated with ongoing star formation. As a consequence, the stellar mass – SFR plane (where these quantities were also obtained by LePhare directly from the best fit template spectra), shows that at least 80% of the jellyfish candidates are star-forming galaxies - and among these SF systems, about 70% have increased SFR relatively to the main sequence galaxies. The SED fit results thus provide another indication that the majority of jellyfish galaxies in this cluster have notably high SFR for their stellar masses (about 60% have sSFR yr-1, stellar masses ranging from to M⊙). Though affected by the usual uncertainties associated with any SED fitting method, this result is similar to what was obtained at low redshift by Poggianti et al. (2016).
If we now look at the location of these galaxies inside the cluster, their redshift histogram does not hint for any particular placement along the line-of-sight: jellyfish candidates share the global redshift distribution of all galaxies within the structure (i.e. all galaxies within the adopted redshift interval for this system), so it is impossible to infer any particular kinematical behavior. As for their spatial distribution on the plane of the sky, jellyfish candidates spread throughout the cluster and its extended filament but avoid the cluster central, densest region. Since MACS0717 filaments are well detected in projection, and the redshift histogram of the whole structure (Fig. 1) is, rather surprisingly, Gaussian-like, it does look as if the main infall, at large scale, should essentially take place along the plane of the sky, in the areas where we found our jellyfish candidates.
In the cluster core, and apparently in compliance with the model of Safarzadeh & Loeb (2019), jellyfish galaxy candidates are almost absent, which may further be a result of the very rough core environment of this massive merging cluster. A detailed study of the inner 1 Mpc carried out with combined optical and X-ray data by Ma et al. (2009) does point to much more complex dynamics in the cluster core (when compared with what we can infer from the global redshift histogram of Fig. 1). Interestingly enough, Ellien et al. (2019) analyzed the distribution of intra-cluster light (ICL) in this system and detected a large amount of it in the cluster core but no such light in the cosmic filament. As ICL is thought to be made up of disrupted galactic material, the findings of Ellien et al. (2019) corroborate the existence of a harsh environment in the core, contrasting with softer conditions along the filament. This is expected and the distribution of jellyfish galaxy candidates found in this work may reflect that, quite probably, transient phenomena such as jellyfish features cannot survive for long in the tumultuous core of MACS0717.
From all these pieces of evidence, we think that most jellyfish candidates identified here could be a population of rather recent infallers that have felt the first impact and effects of penetrating into a denser environment, which altered their morphology and generally increased their SFR. A tentative MIR analysis singles out two possible AGN hosts among the jellyfish candidates located in the denser cluster regions.
On the other hand, the apparent paucity of jellyfish galaxies in the cluster core could simply be the result of a selection effect, imposed by the wavelengths that we rely upon to identify them - probing, approximately, restframe B and V optical emission. Though these wavebands have been successfully used by Poggianti et al. (2016) to select their GASP jellyfish candidates at redshifts 0.04-0.07, we expect that at the higher redshifts of our sample, the surface brightness of jellyfish structures becomes significantly dimmer. Moreover, tails and other jellyfish characteristics can indeed lie undetected in some filters since the material making up the jellyfish structures emits at selective wavelengths, as documented by several examples mentioned in Section 1. Just to highlight a couple of illustrative examples, and regardless of their location within the host cluster, we can mention FGC1287 in Abell 1367 that has a 250 kpc-long HI tail with no optical counterpart (Scott et al., 2012), and D100 in Coma, which presents a remarkably long and narrow ( kpc) H gas tail, whereas the optical image shows an apparently normal spiral galaxy (Cramer et al., 2019).
Such galaxies with tails are rather extreme examples of jellyfish characteristics but they seem to be located - at least in what concerns the low-redshift universe, i.e. mostly below z=0.05 but reaching up to z=0.2 - within the inner 40% of their cluster virial radius (i.e. within 1 Mpc) with very few exceptions (T. Scott, private communication). This is the case even for those with stellar tails - that could thus potentially be unveiled in our observations. So, as far as optically detected jellyfish galaxy candidates are concerned, there don’t seem to be many in the inner regions of MACS0717, at least as far as our images’ depth can probe, and none shows a conspicuous tail.
Unlike the large spectroscopic coverage we have for MACS0717, that allowed us to detect in a more complete way jellyfish candidates in this cluster, the lack of redshifts in the case of most of the other clusters that we analysed prevents us from drawing major conclusions. Our aim here was simply to detect candidates, characterize them and make, whenever possible, a comparison with what was found for MAC0717. The jellyfish candidates detected in all remaining 22 clusters cover the same stellar masse range but don’t seem to avoid the centre of their host clusters, as seen in Fig. 6. This might explain the generally lower SFR values (only reaching about M⊙ yr-1) when compared with jellyfish candidates that are members of MACS0717.
Finally, and considering the whole sample together, we next attempt to infer proportions of jellyfish galaxy candidates in the clusters analysed here and the existence of any trend with cluster relaxation states.
We already mentioned the incompleteness of our redshift catalogues for the various clusters. As jellyfish galaxies are most often quite bright, and/or show emission lines in their spectra, they may be easier to observe spectroscopically, and thus their proportion may be overestimated. Besides, since our aim is to detect jellyfish galaxies, we may have classified as such, galaxies which are merely somewhat strange–looking spirals with a distorted morphology. For these reasons, and due to the incompleteness of our sample, estimating the proportion of jellyfish galaxies in clusters remains difficult. We will therefore just give a few numbers. If we consider the 21 clusters for which more than ten spectroscopic redshifts are available, we find an average proportion of jellyfish galaxy candidates of 9.5% (by using the numbers in Table 1). If we now consider MACS0717, where statistics are more robust (81 jellyfish candidates detected, with a large spectroscopic and spatial coverage), we find a percentage of 13%. This seems to mean that jellyfish galaxies are not that rare after all, and it is a clear encouragement to pursue such studies with more complete spectroscopic data.
Since the main mechanisms leading to jellyfish galaxies appear to be RPS and/or harassment Poggianti et al. (see the Introduction and 2017b), the proportion of jellyfish galaxies can be expected to vary with the relaxation state of clusters to which they belong. To estimate this relaxation state, we looked at several properties: first, the histograms of all the redshifts available in a large zone around each cluster (for the DAFT/FADA clusters, these histograms were given by Guennou et al. (2014) and Durret et al. (2016)), for the other clusters we retrieved all the redshifts available in NED and drew their histogram in the approximate cluster redshift range. We also looked at the matter distribution based on a weak lensing analysis by Martinet et al. (2016) or on the shape of the red sequence density map by Durret et al. (2016) or Durret et al. (2019). For clusters with at least 10 spectroscopic redshifts available within the HST images analyzed in the present paper, we looked at the proportion of jellyfish galaxy candidates relative to the relaxation state of the cluster. With the available data, we found no relation between the proportion of jellyfish galaxy candidates and the relaxation state of the cluster.
Acknowledgements.
It is a pleasure to thank Tom Scott for enlightening discussions about RPS and its effect on cluster galaxies. We are grateful to the referee for her/his prompt report and interesting suggestions that helped to improve the paper. F. Durret acknowledges continuous financial support from CNES since 2002. C. Lobo acknowledges support by Fundaçao para a Ciência e a Tecnologia (FCT) through the research grants UIDB/04434/2020 and UIDP/04434/2020. M. Jauzac is supported by the United Kingdom Research and Innovation (UKRI) Future Leaders Fellowship ‘Using Cosmic Beasts to uncover the Nature of Dark Matter’ (grant number MR/S017216/1). This work is partly based on tools and data products produced by GAZPAR operated by CeSAM-LAM and IAP and we further acknowledge the dedicated support of O. Ilbert. This research has made use of the SVO Filter Profile Service (http://svo2.cab.inta-csic.es/theory/fps/) supported from the Spanish MINECO through grant AYA2017-84089. This research has also made use of the NASA/IPAC Extragalactic Database (NED), which is funded by the National Aeronautics and Space Administration and operated by the California Institute of Technology. We further acknowledge M. Taylor for developing TOPCAT, making our life so much easier.References
- Bekki (2009) Bekki, K. 2009, MNRAS, 399, 2221
- Bellhouse et al. (2019) Bellhouse, C., Jaffé, Y. L., McGee, S. L., et al. 2019, MNRAS, 485, 1157
- Bellhouse et al. (2021) Bellhouse, C., McGee, S. L., Smith, R., et al. 2021, MNRAS, 500, 1285
- Bertin & Arnouts (1996) Bertin, E. & Arnouts, S. 1996, A&AS, 117, 393
- Boselli et al. (2019) Boselli, A., Epinat, B., Contini, T., et al. 2019, A&A, 631, A114
- Bruzual & Charlot (2003) Bruzual, G. & Charlot, S. 2003, Monthly Notices of the Royal Astronomical Society, 344, 1000
- Chabrier (2003) Chabrier, G. 2003, PASP, 115, 763
- Cortese et al. (2007) Cortese, L., Marcillac, D., Richard, J., et al. 2007, MNRAS, 376, 157
- Cramer et al. (2019) Cramer, W. J., Kenney, J. D. P., Sun, M., et al. 2019, ApJ, 870, 63
- Durret et al. (2016) Durret, F., Márquez, I., Acebrón, A., et al. 2016, A&A, 588, A69
- Durret et al. (2019) Durret, F., Tarricq, Y., Márquez, I., Ashkar, H., & Adami, C. 2019, A&A, 622, A78
- Ebeling & Kalita (2019) Ebeling, H. & Kalita, B. S. 2019, ApJ, 882, 127
- Ebeling et al. (2014) Ebeling, H., Stephenson, L. N., & Edge, A. C. 2014, ApJ, 781, L40
- Ellien et al. (2019) Ellien, A., Durret, F., Adami, C., et al. 2019, A&A, 628, A34
- Fukugita et al. (1995) Fukugita, M., Shimasaku, K., & Ichikawa, T. 1995, PASP, 107, 945
- Fumagalli et al. (2014) Fumagalli, M., Fossati, M., Hau, G. K. T., et al. 2014, MNRAS, 445, 4335
- George et al. (2019) George, K., Poggianti, B. M., Bellhouse, C., et al. 2019, MNRAS, 487, 3102
- Girardi et al. (2005) Girardi, M., Demarco, R., Rosati, P., & Borgani, S. 2005, A&A, 442, 29
- Guennou et al. (2014) Guennou, L., Adami, C., Durret, F., et al. 2014, A&A, 561, A112
- Gullieuszik et al. (2020) Gullieuszik, M., Poggianti, B. M., McGee, S. L., et al. 2020, ApJ, 899, 13
- Gunn & Gott (1972) Gunn, J. E. & Gott, J. Richard, I. 1972, ApJ, 176, 1
- Ilbert et al. (2006) Ilbert, O., Arnouts, S., McCracken, H. J., et al. 2006, A&A, 457, 841
- Jáchym et al. (2014) Jáchym, P., Combes, F., Cortese, L., Sun, M., & Kenney, J. D. P. 2014, The Astrophysical Journal, 792, 11
- Jáchym et al. (2019) Jáchym, P., Kenney, J. D. P., Sun, M., et al. 2019, ApJ, 883, 145
- Jauzac et al. (2018a) Jauzac, M., Eckert, D., Schaller, M., et al. 2018a, MNRAS, 481, 2901
- Jauzac et al. (2018b) Jauzac, M., Harvey, D., & Massey, R. 2018b, MNRAS, 477, 4046
- Jauzac et al. (2012) Jauzac, M., Jullo, E., Kneib, J.-P., et al. 2012, MNRAS, 426, 3369
- Kalita & Ebeling (2019) Kalita, B. S. & Ebeling, H. 2019, ApJ, 887, 158
- Ma et al. (2009) Ma, C.-J., Ebeling, H., & Barrett, E. 2009, ApJ, 693, L56
- Ma et al. (2008) Ma, C.-J., Ebeling, H., Donovan, D., & Barrett, E. 2008, ApJ, 684, 160
- Martinet et al. (2016) Martinet, N., Clowe, D., Durret, F., et al. 2016, A&A, 590, A69
- Martinet et al. (2017) Martinet, N., Durret, F., Adami, C., & Rudnick, G. 2017, A&A, 604, A80
- Mateos et al. (2012) Mateos, S., Alonso-Herrero, A., Carrera, F. J., et al. 2012, MNRAS, 426, 3271
- McPartland et al. (2016) McPartland, C., Ebeling, H., Roediger, E., & Blumenthal, K. 2016, MNRAS, 455, 2994
- Moore et al. (1996) Moore, B., Katz, N., Lake, G., Dressler, A., & Oemler, A. 1996, Nature, 379, 613
- Moretti et al. (2020) Moretti, A., Paladino, R., Poggianti, B. M., et al. 2020, ApJ, 889, 9
- Munari et al. (2013) Munari, E., Biviano, A., Borgani, S., Murante, G., & Fabjan, D. 2013, MNRAS, 430, 2638
- Owen et al. (2006) Owen, F. N., Keel, W. C., Wang, Q. D., Ledlow, M. J., & Morrison, G. E. 2006, AJ, 131, 1974
- Peng et al. (2010) Peng, Y.-j., Lilly, S. J., Kovač, K., et al. 2010, ApJ, 721, 193
- Poggianti et al. (2016) Poggianti, B. M., Fasano, G., Omizzolo, A., et al. 2016, AJ, 151, 78
- Poggianti et al. (2019) Poggianti, B. M., Ignesti, A., Gitti, M., et al. 2019, ApJ, 887, 155
- Poggianti et al. (2017a) Poggianti, B. M., Jaffé, Y. L., Moretti, A., et al. 2017a, Nature, 548, 304
- Poggianti et al. (2017b) Poggianti, B. M., Moretti, A., Gullieuszik, M., et al. 2017b, ApJ, 844, 48
- Radovich et al. (2019) Radovich, M., Poggianti, B., Jaffé, Y. L., et al. 2019, MNRAS, 486, 486
- Rawle et al. (2014) Rawle, T. D., Altieri, B., Egami, E., et al. 2014, MNRAS, 442, 196
- Roman-Oliveira et al. (2021) Roman-Oliveira, F., Chies-Santos, A. L., Ferrari, F., Lucatelli, G., & Rodríguez Del Pino, B. 2021, MNRAS, 500, 40
- Roman-Oliveira et al. (2019) Roman-Oliveira, F. V., Chies-Santos, A. L., Rodríguez del Pino, B., et al. 2019, MNRAS, 484, 892
- Ruggiero et al. (2019) Ruggiero, R., Machado, R. E. G., Roman-Oliveira, F. V., et al. 2019, MNRAS, 484, 906
- Safarzadeh & Loeb (2019) Safarzadeh, M. & Loeb, A. 2019, MNRAS, 486, L26
- Schlafly & Finkbeiner (2011) Schlafly, E. F. & Finkbeiner, D. P. 2011, The Astrophysical Journal, 737, 103
- Schlegel et al. (1998) Schlegel, D. J., Finkbeiner, D. P., & Davis, M. 1998, The Astrophysical Journal, 500, 525
- Scott et al. (2012) Scott, T. C., Cortese, L., Brinks, E., et al. 2012, MNRAS, 419, L19
- Smith et al. (2010) Smith, R. J., Lucey, J. R., Hammer, D., et al. 2010, MNRAS, 408, 1417
- Stern et al. (2012) Stern, D., Assef, R. J., Benford, D. J., et al. 2012, ApJ, 753, 30
- Sun et al. (2007) Sun, M., Donahue, M., & Voit, G. M. 2007, ApJ, 671, 190
- Taylor (2005) Taylor, M. B. 2005, in Astronomical Society of the Pacific Conference Series, Vol. 347, Astronomical Data Analysis Software and Systems XIV, ed. P. Shopbell, M. Britton, & R. Ebert, 29
- Umetsu et al. (2018) Umetsu, K., Sereno, M., Tam, S.-I., et al. 2018, ApJ, 860, 104
- Vulcani et al. (2018) Vulcani, B., Poggianti, B. M., Gullieuszik, M., et al. 2018, ApJ, 866, L25
- Vulcani et al. (2019) Vulcani, B., Poggianti, B. M., Moretti, A., et al. 2019, MNRAS, 487, 2278
- West (1994) West, M. J. 1994, MNRAS, 268, 79
- West et al. (2017) West, M. J., de Propris, R., Bremer, M. N., & Phillipps, S. 2017, Nature Astronomy, 1, 0157
- Williams et al. (2009) Williams, R. J., Quadri, R. F., Franx, M., van Dokkum, P., & Labbé, I. 2009, ApJ, 691, 1879
- Yagi et al. (2010) Yagi, M., Yoshida, M., Komiyama, Y., et al. 2010, AJ, 140, 1814
- Yoshida et al. (2008) Yoshida, M., Yagi, M., Komiyama, Y., et al. 2008, ApJ, 688, 918
Appendix A Images of jellyfish galaxies in MACS J0717.5+3745
The images of our 81 jellyfish galaxy candidates in MACS0717 are shown below. For each galaxy, we indicate the classifications estimated by two of us in parentheses (as given in Table 3).
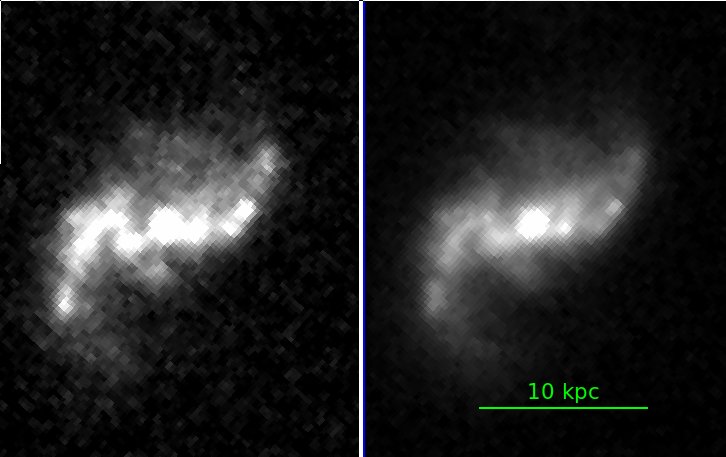
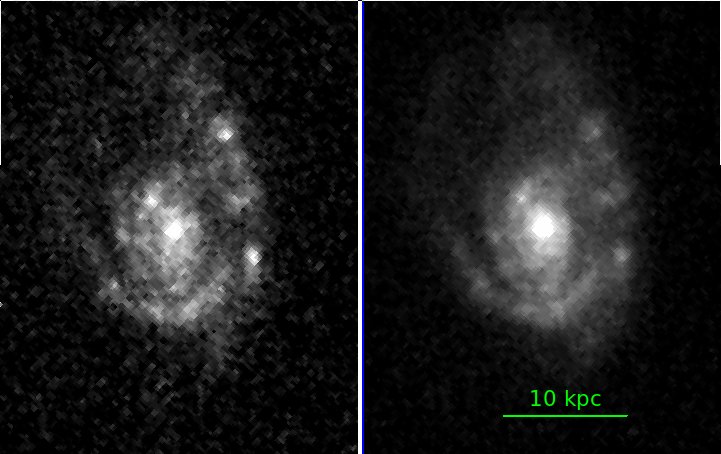
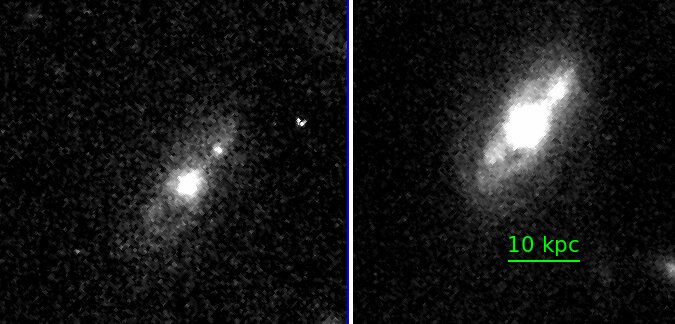
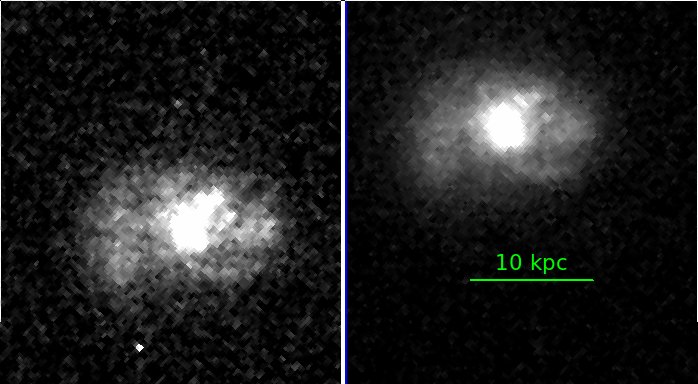
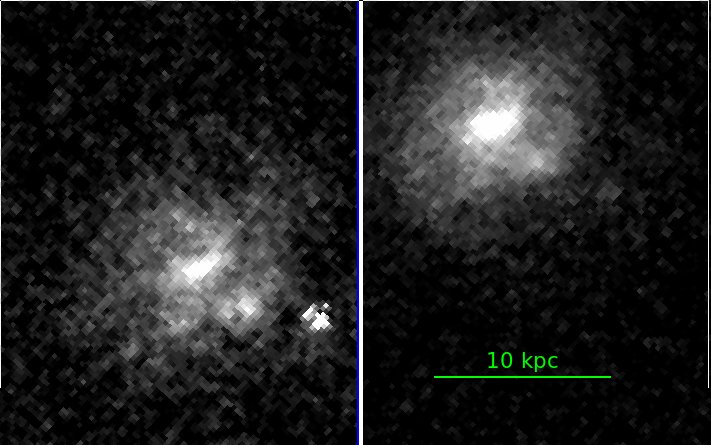
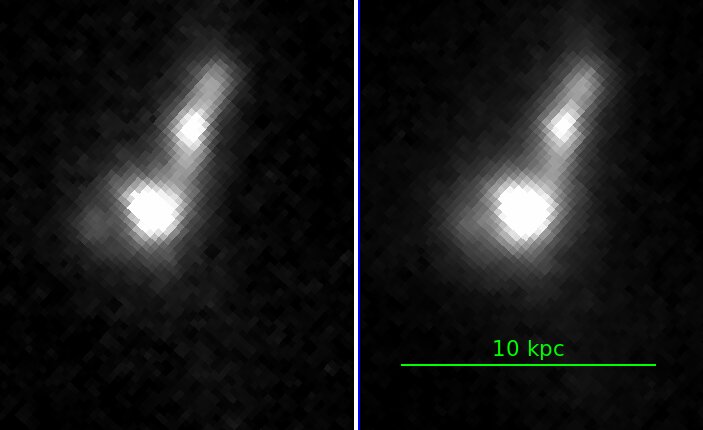
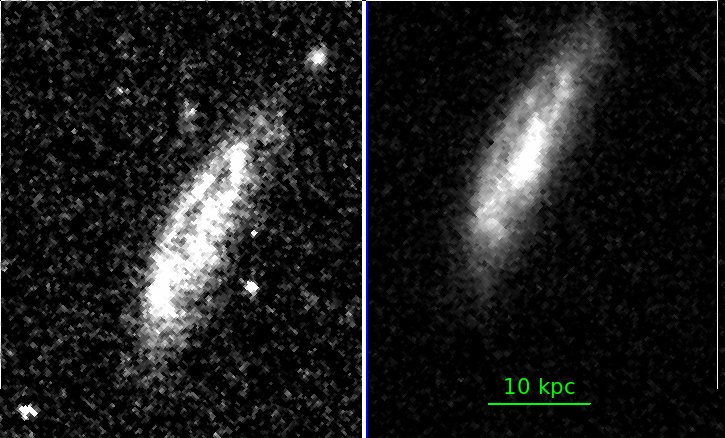
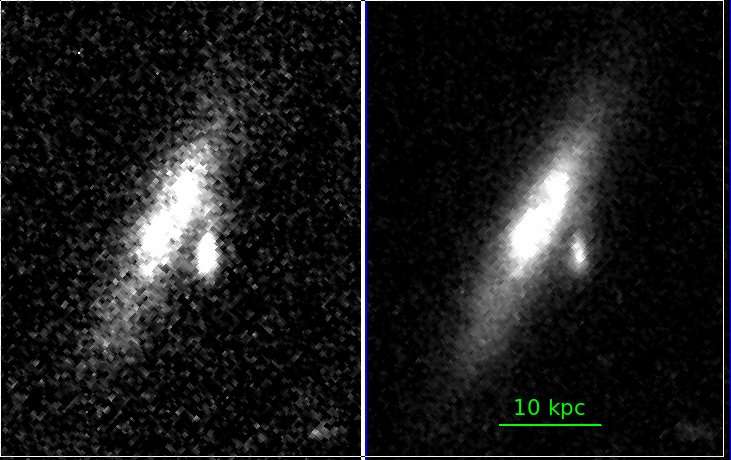
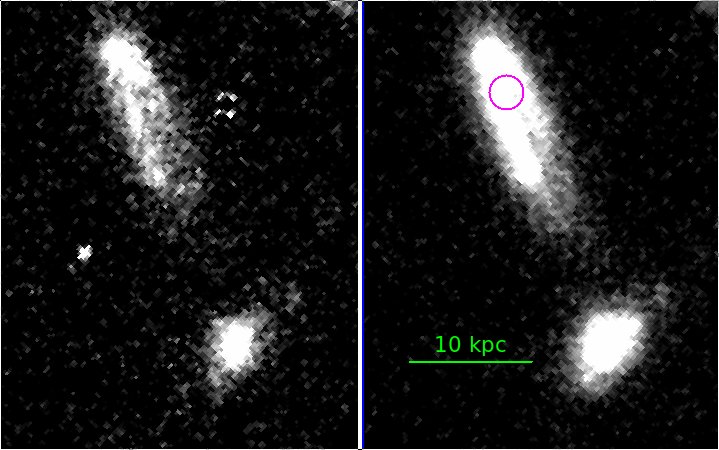
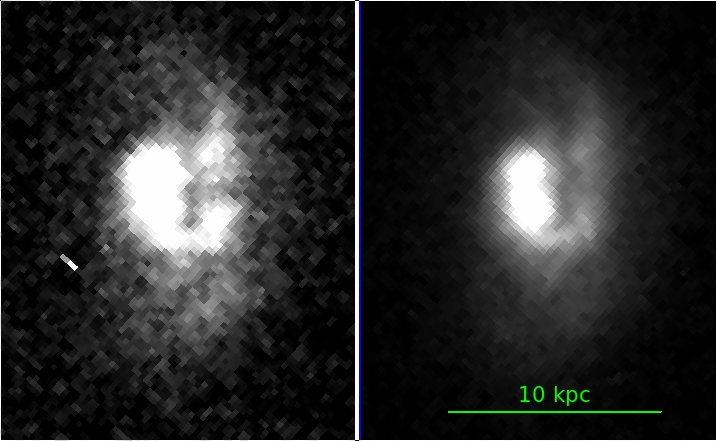
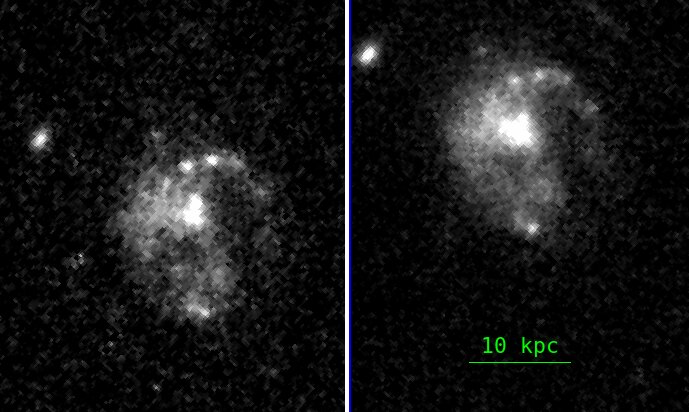
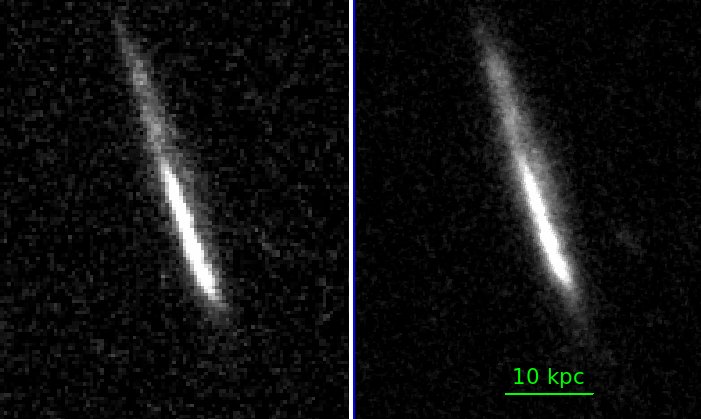
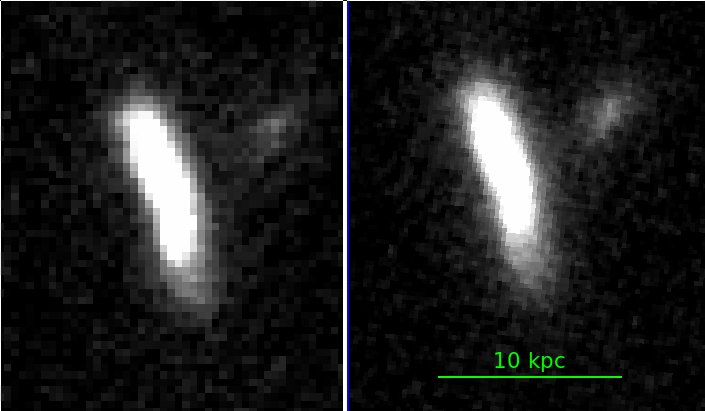
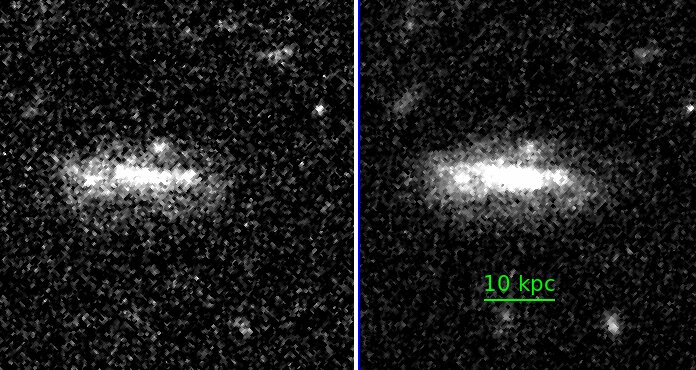
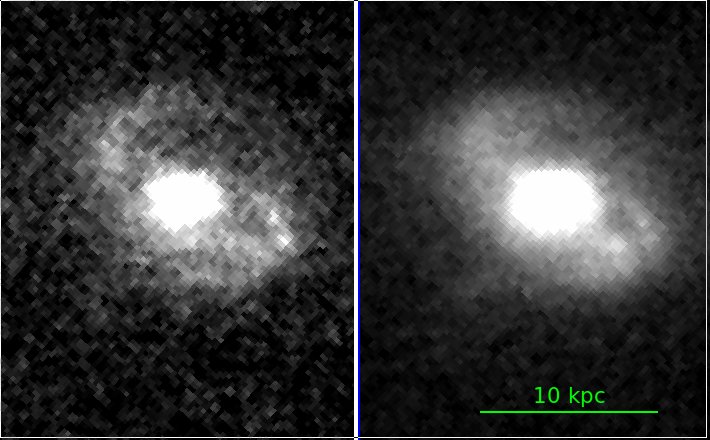
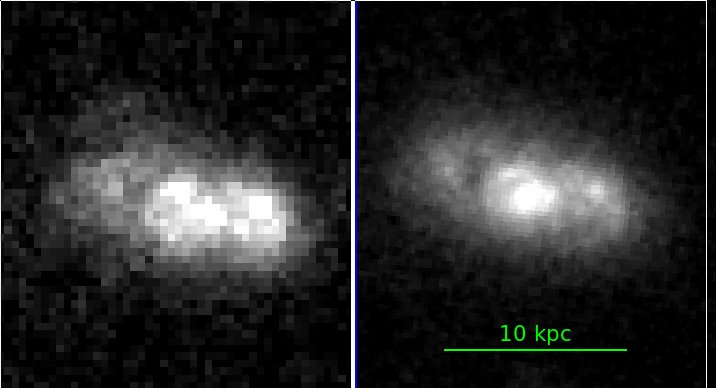
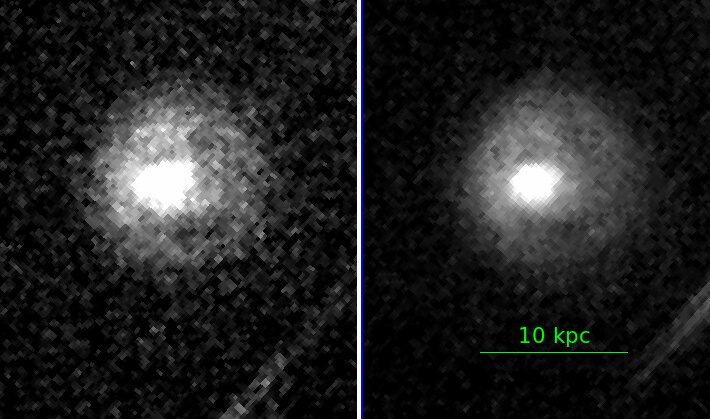
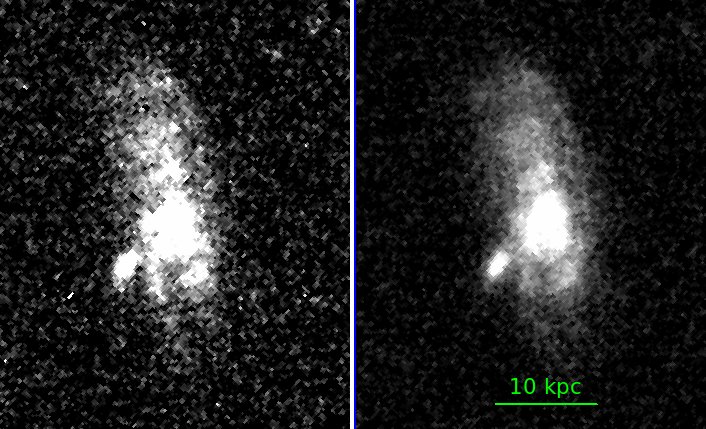
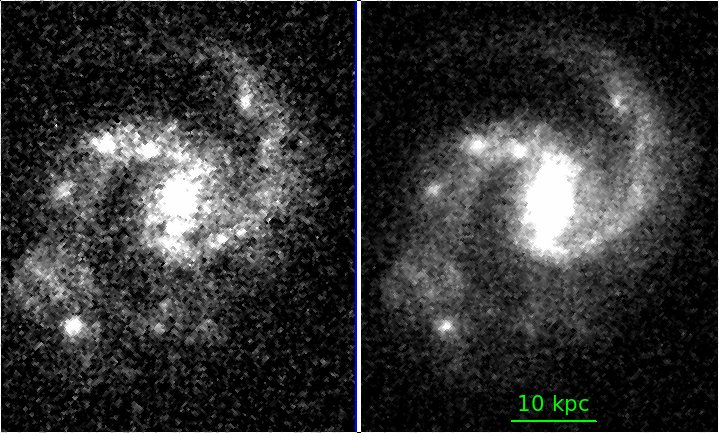
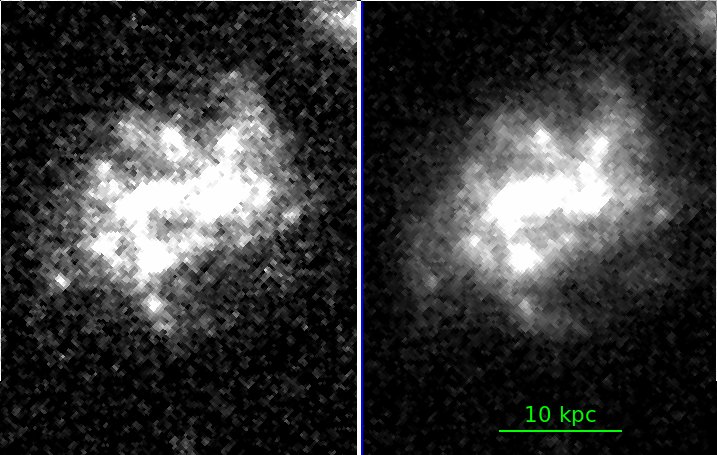
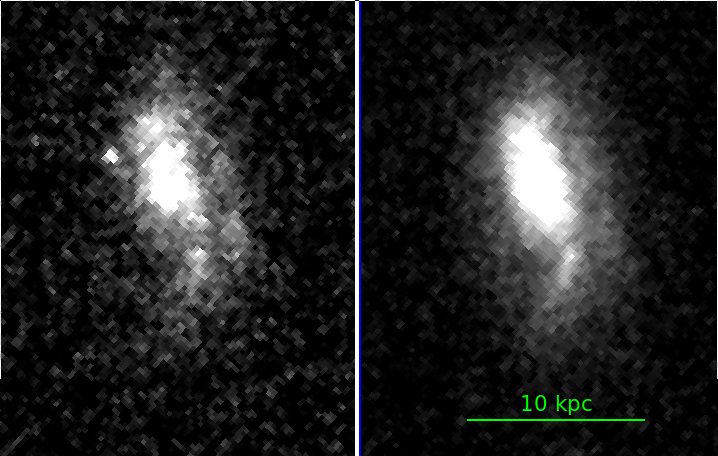
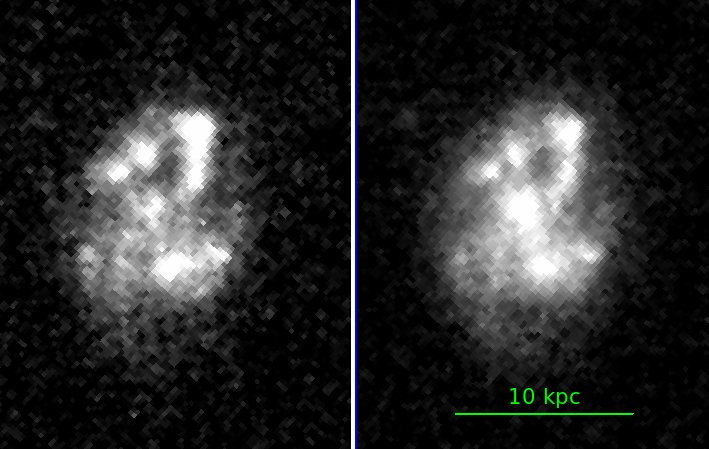
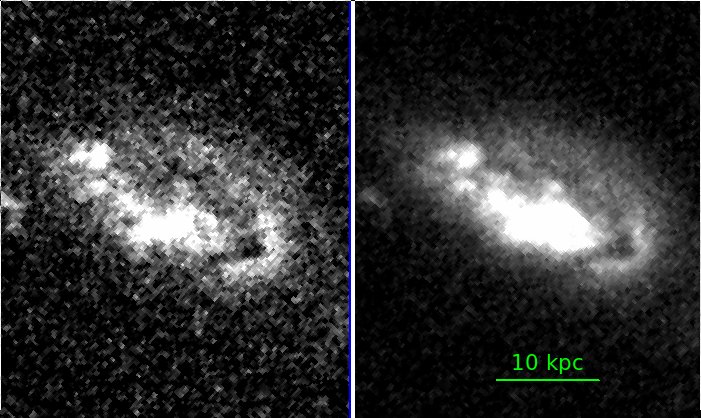
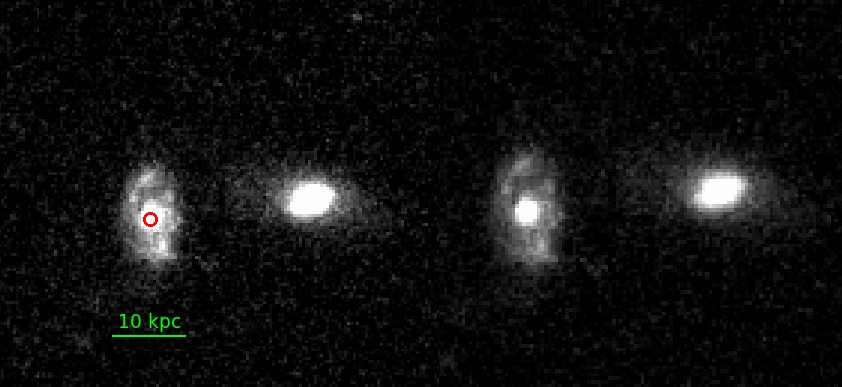
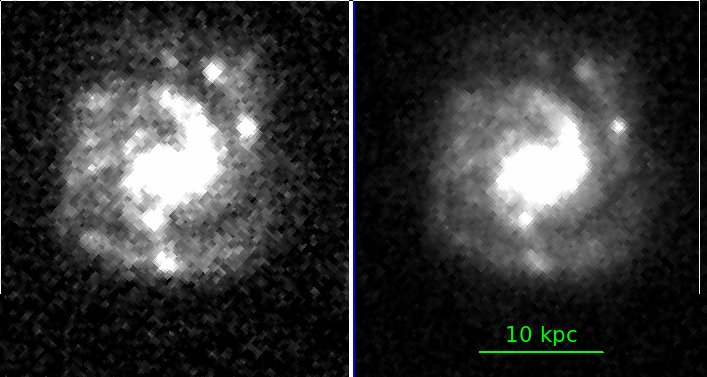
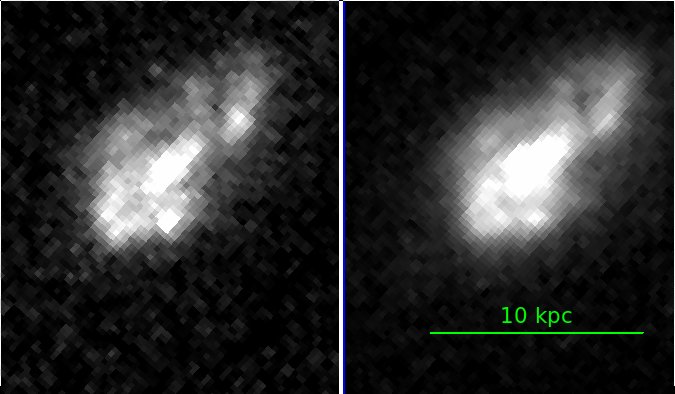
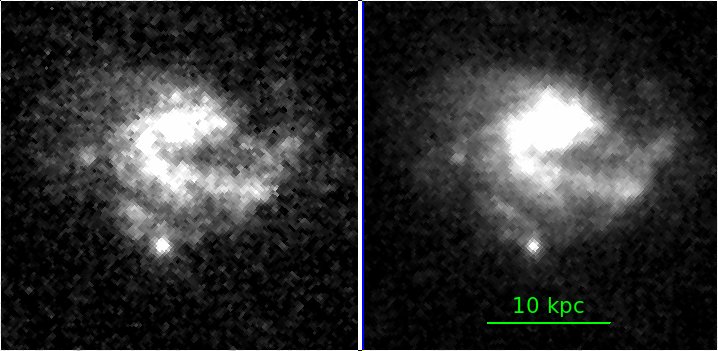
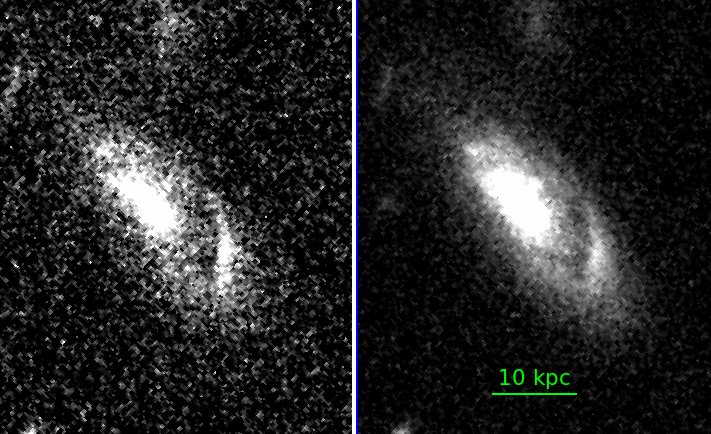
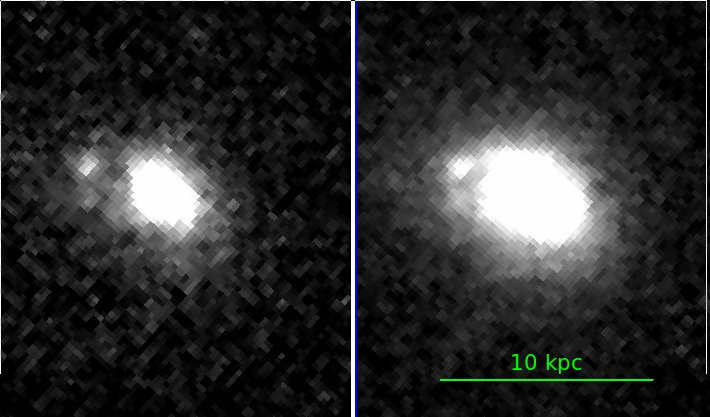
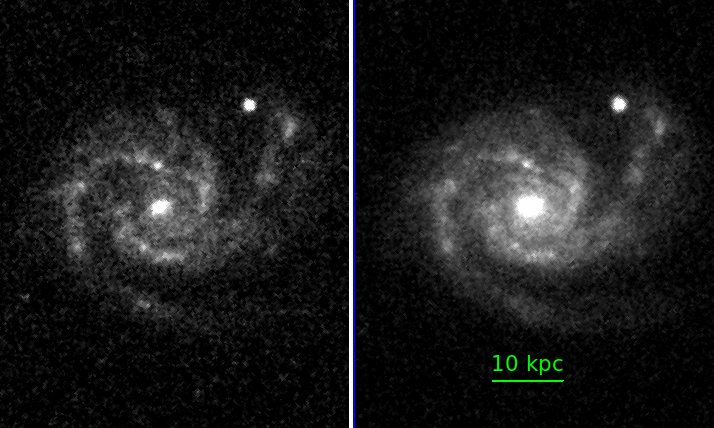
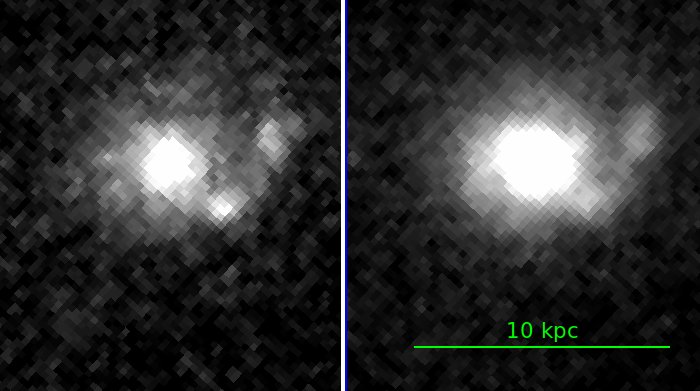
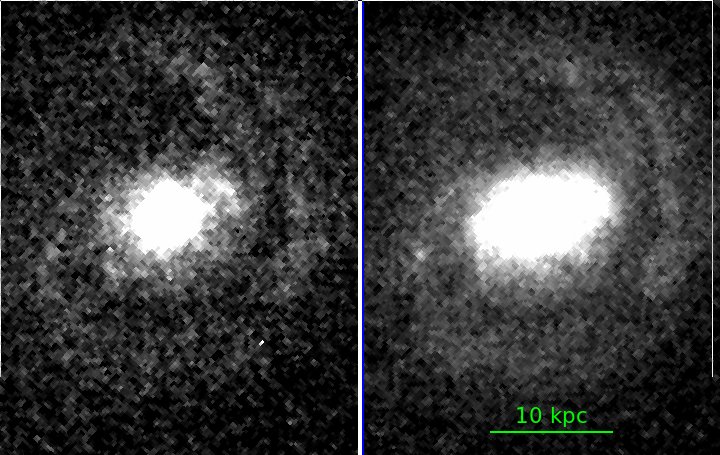
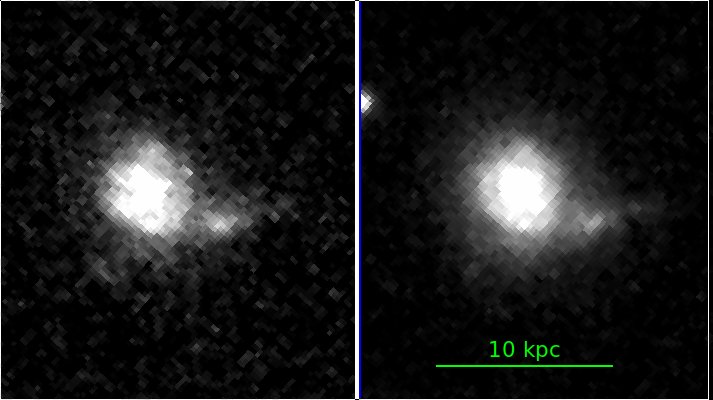
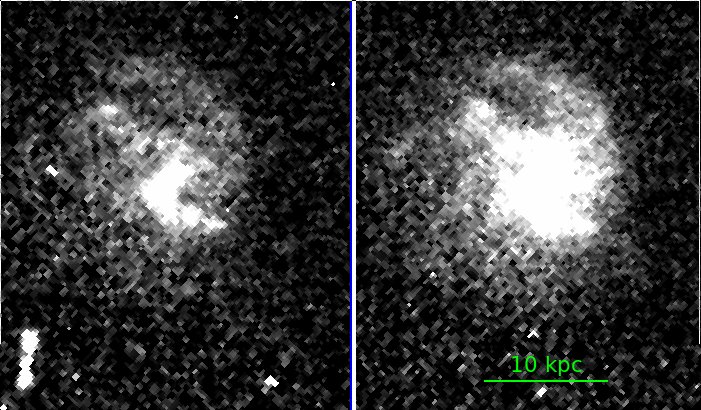
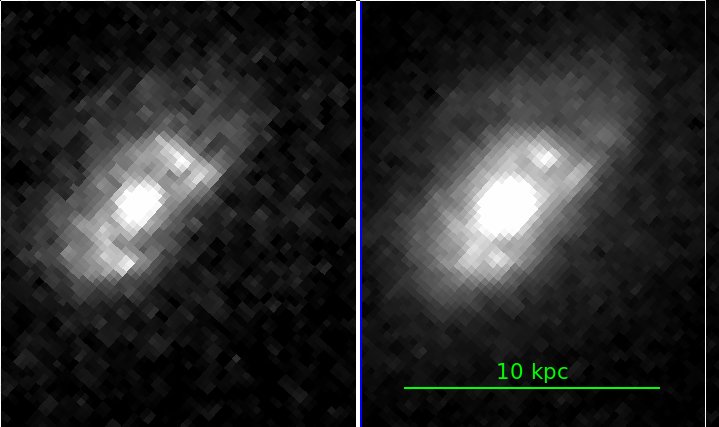
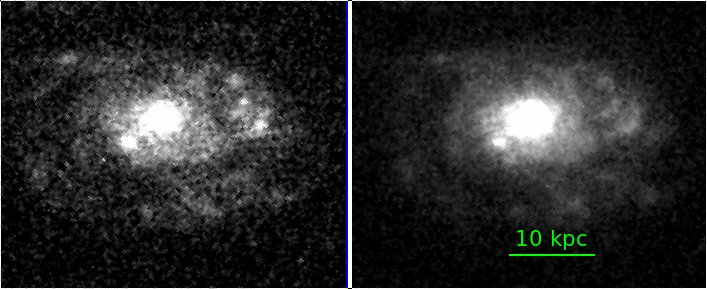
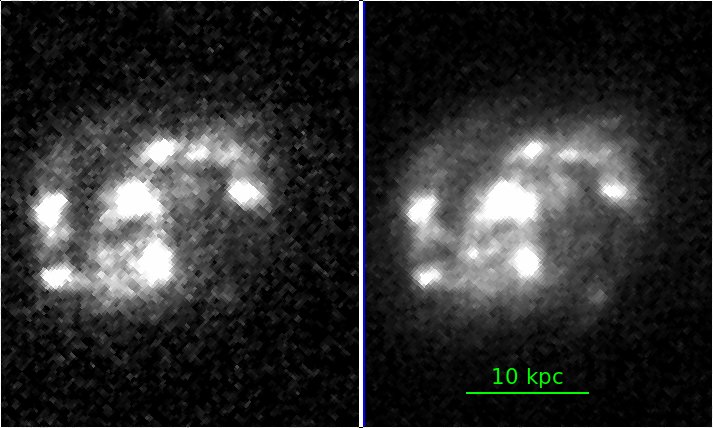
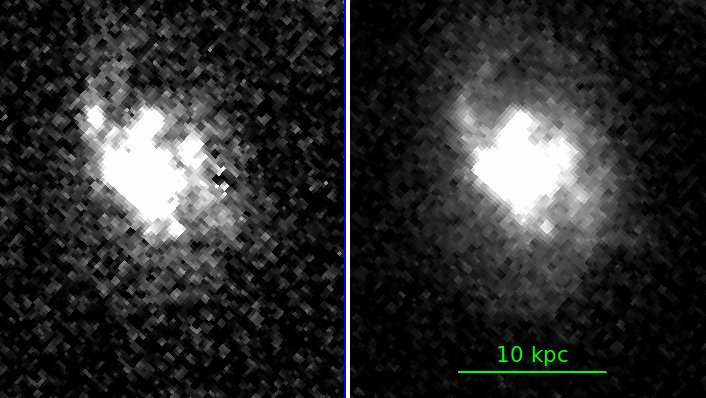
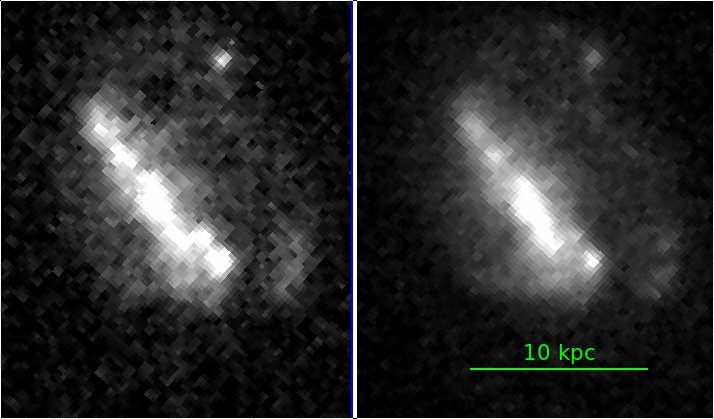
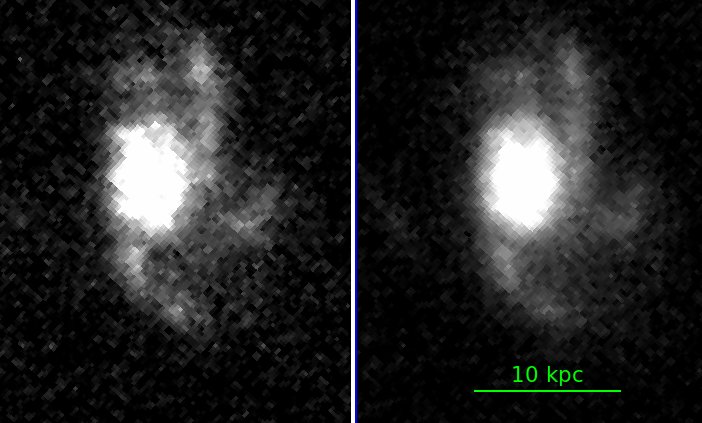
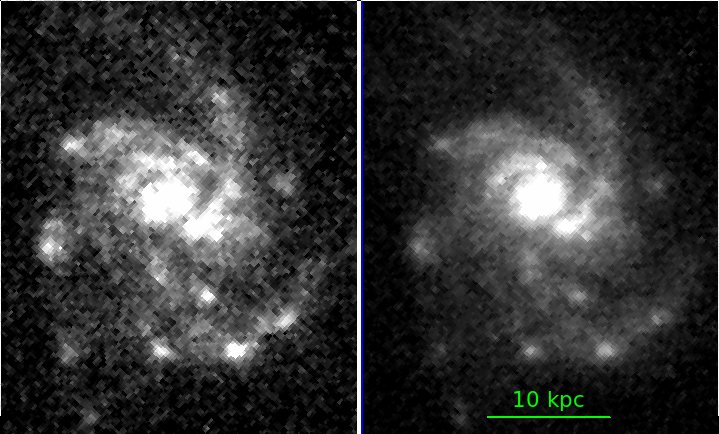
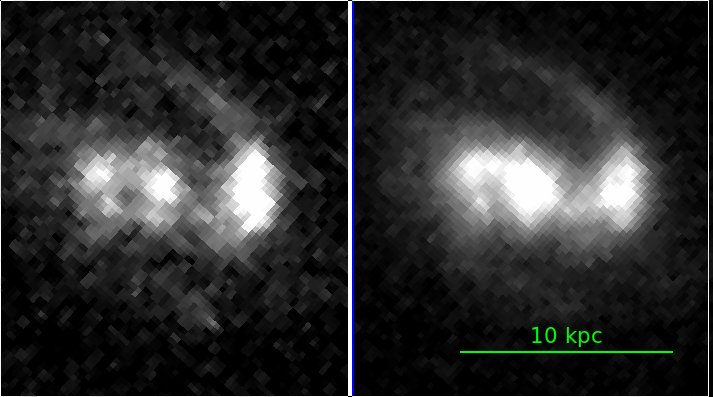
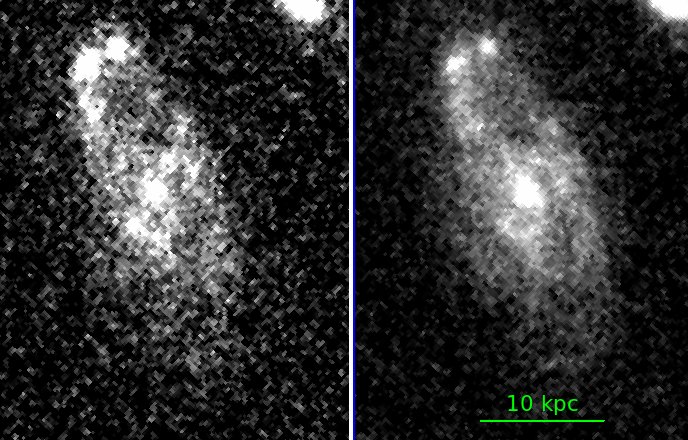
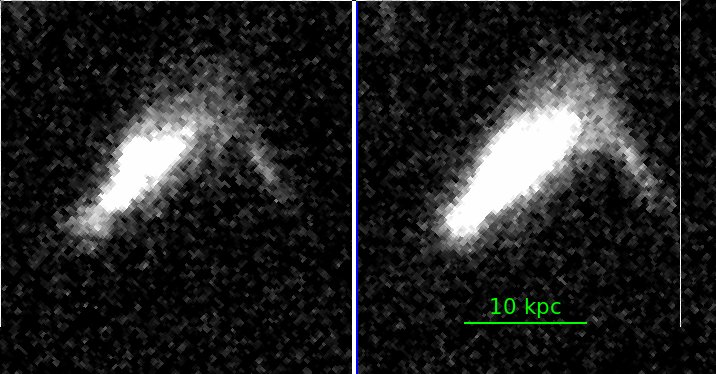
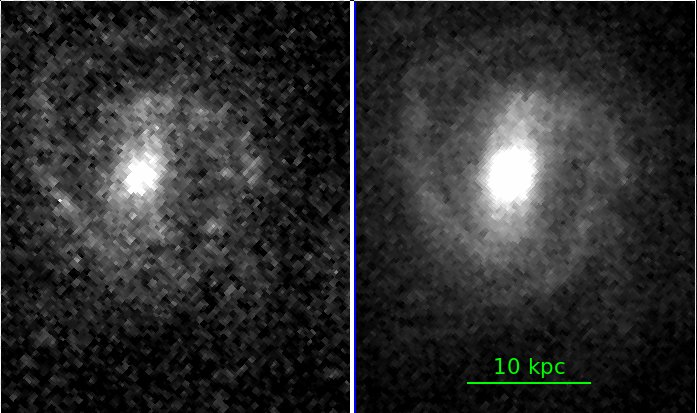
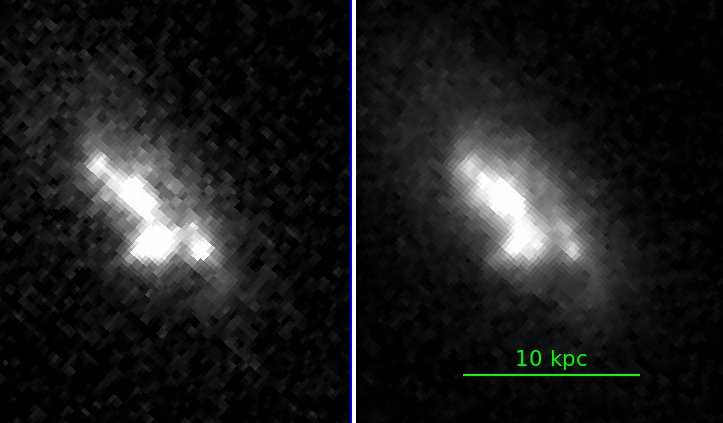
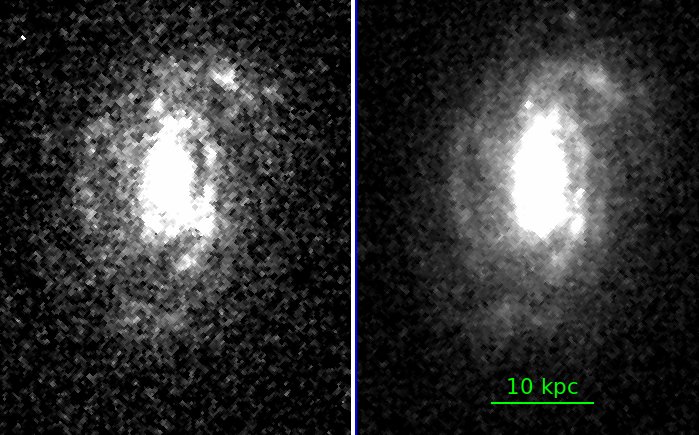
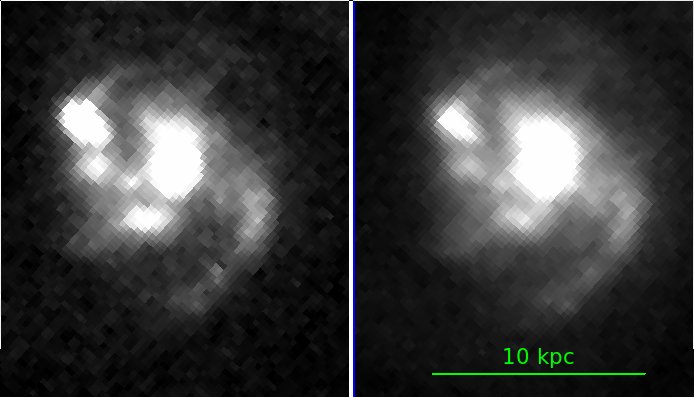
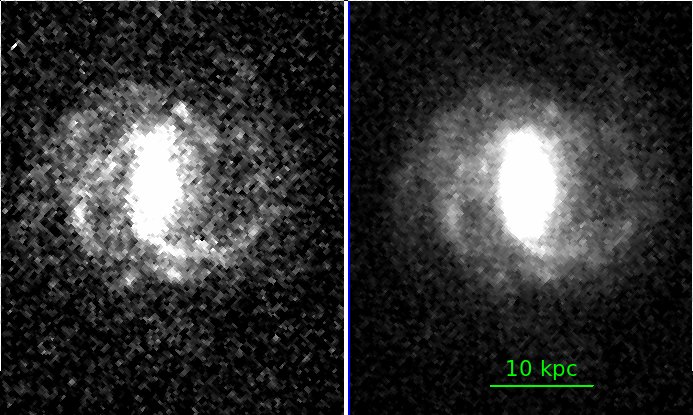
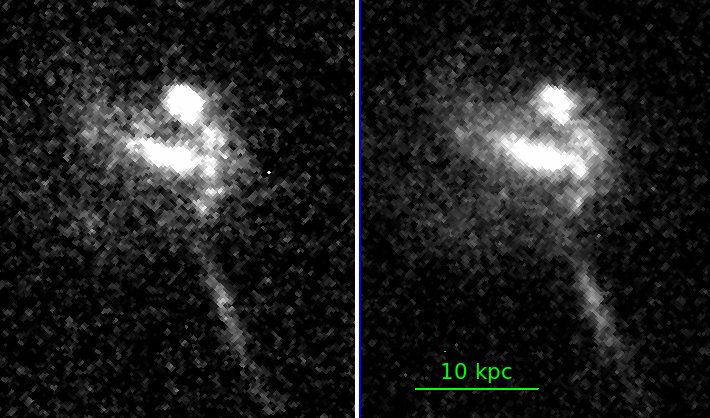
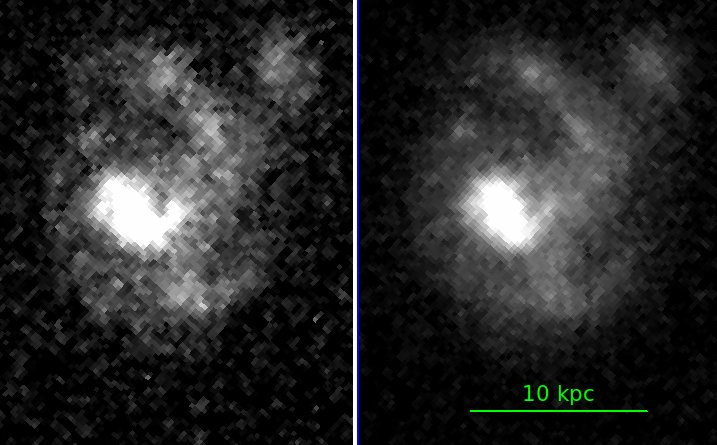
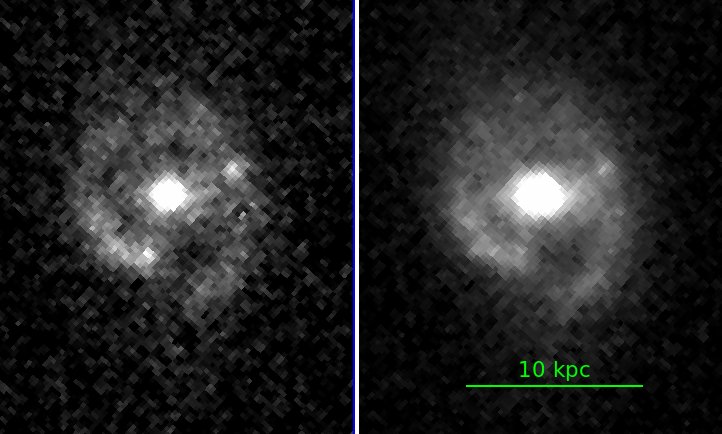
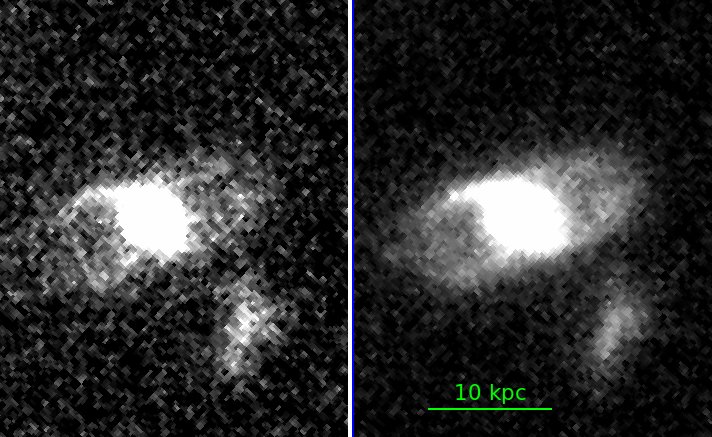
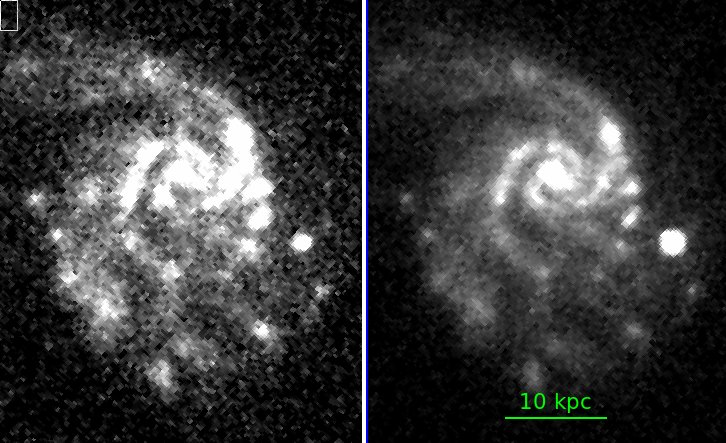
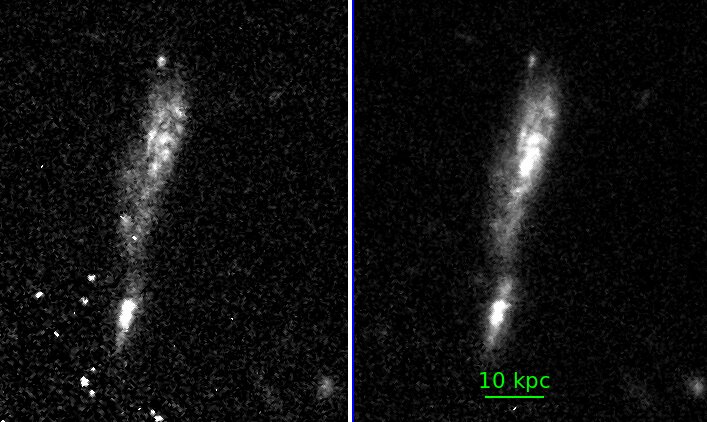
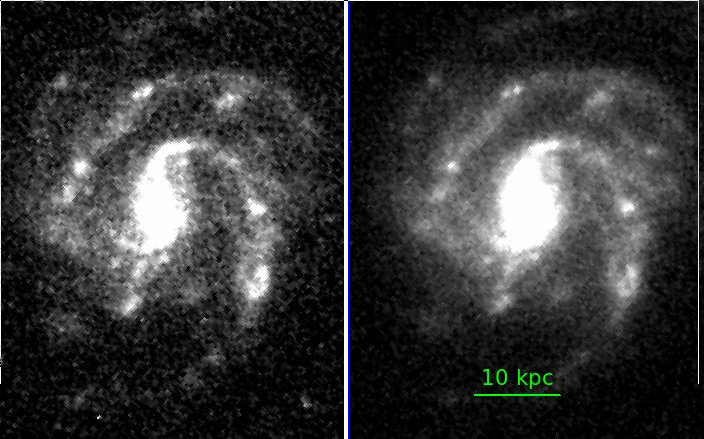
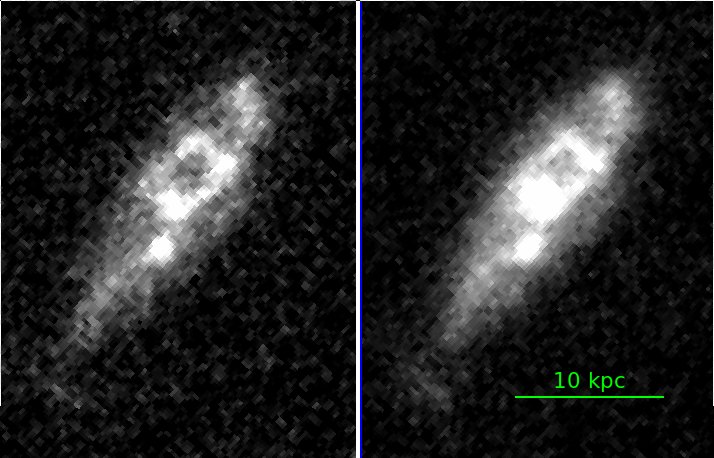
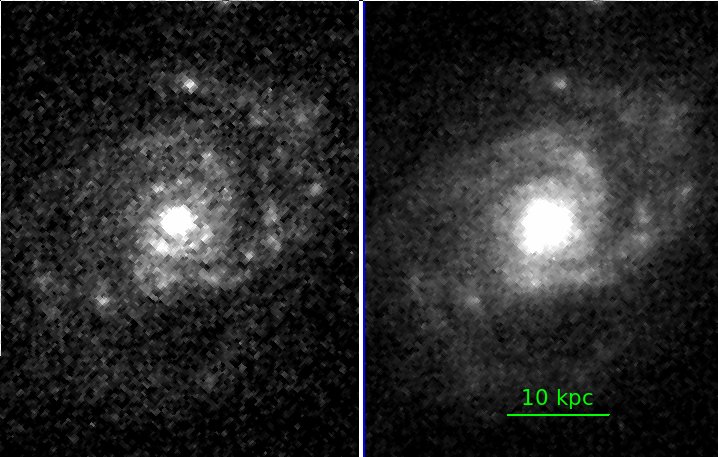
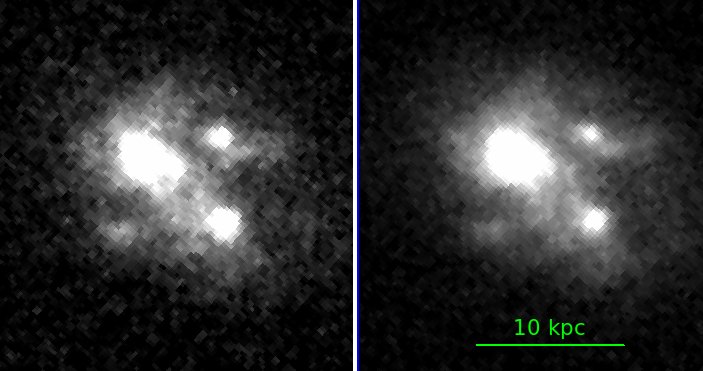
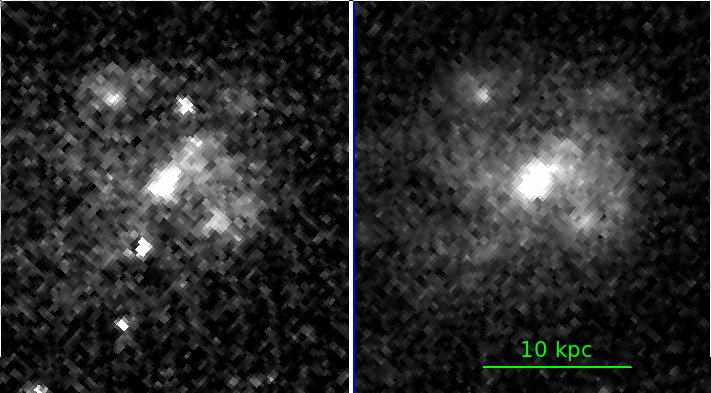
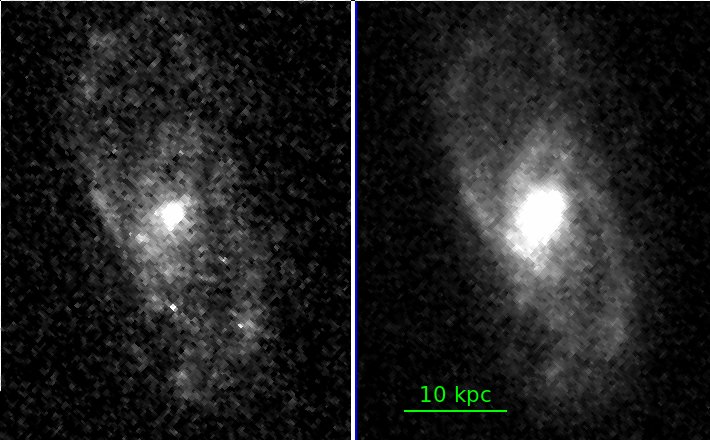
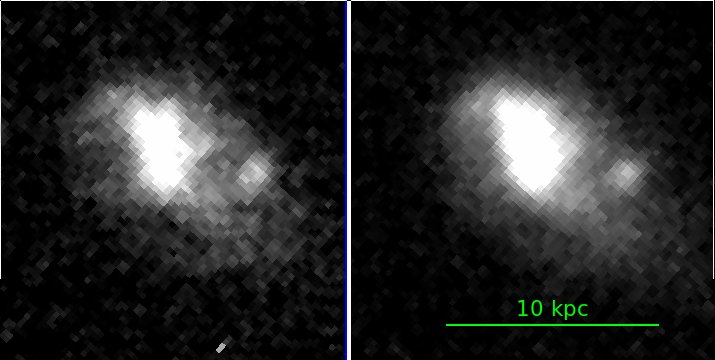
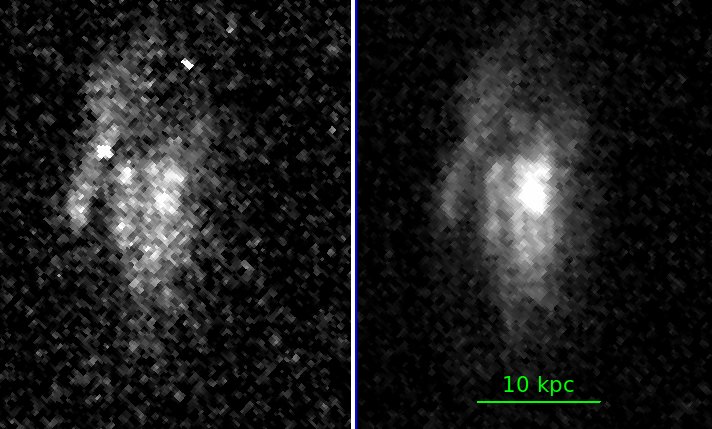
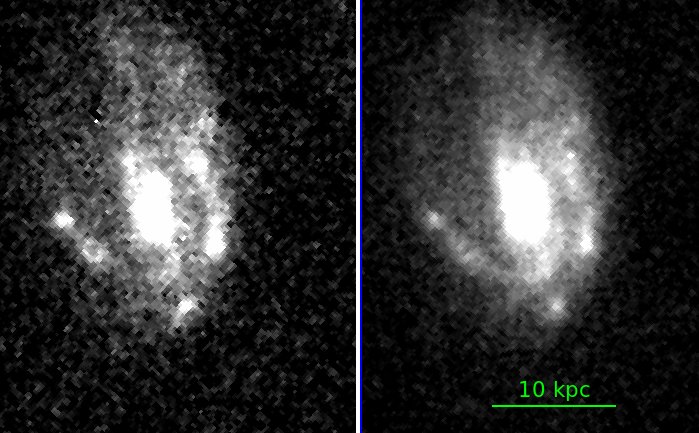
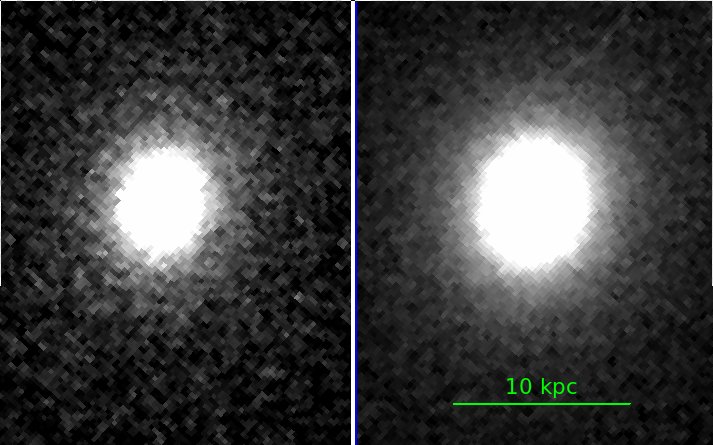
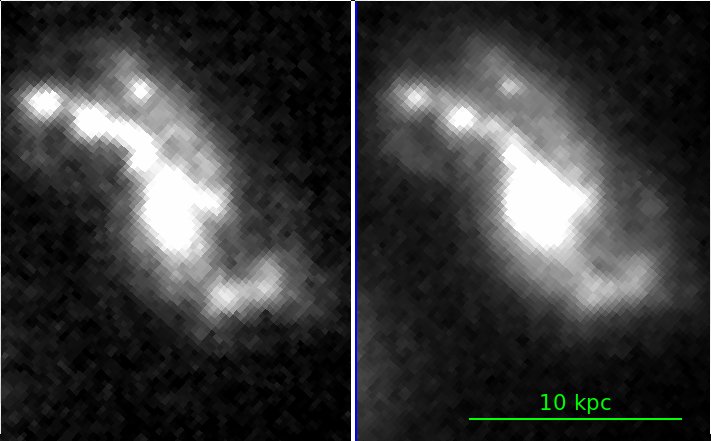
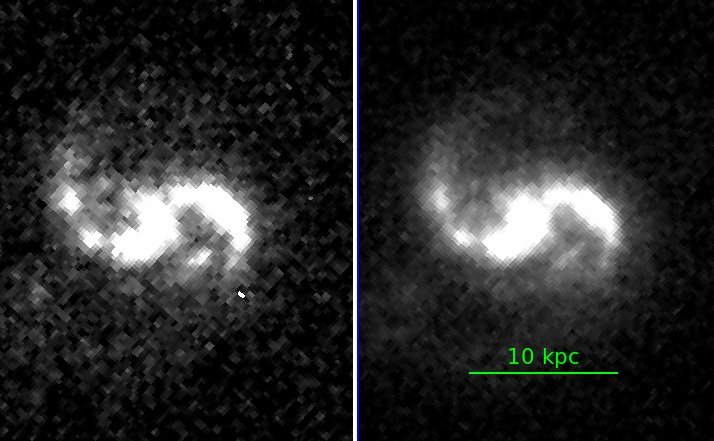
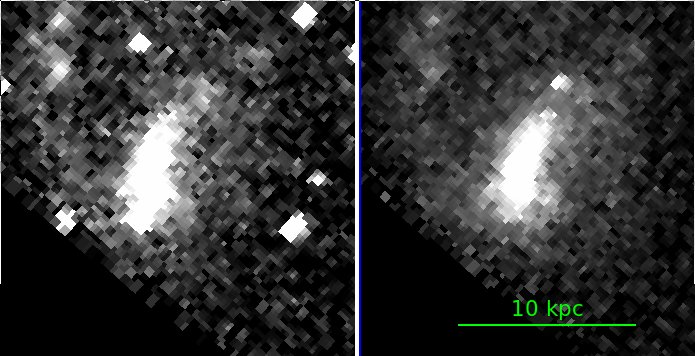
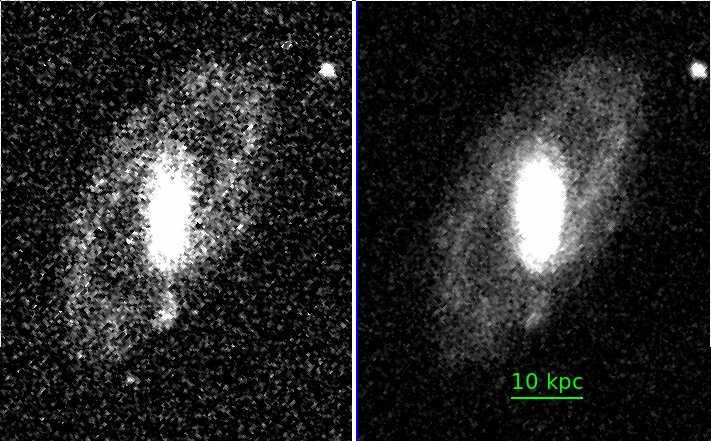
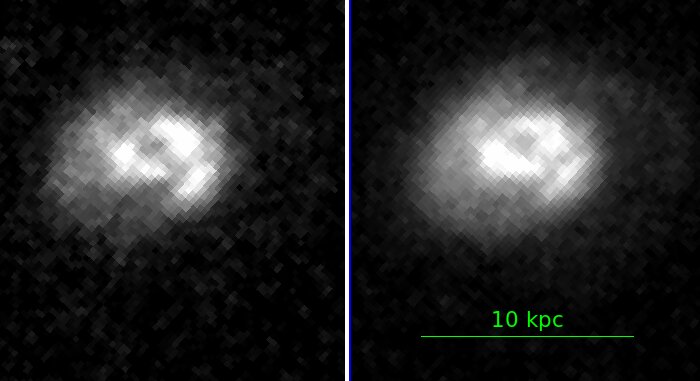
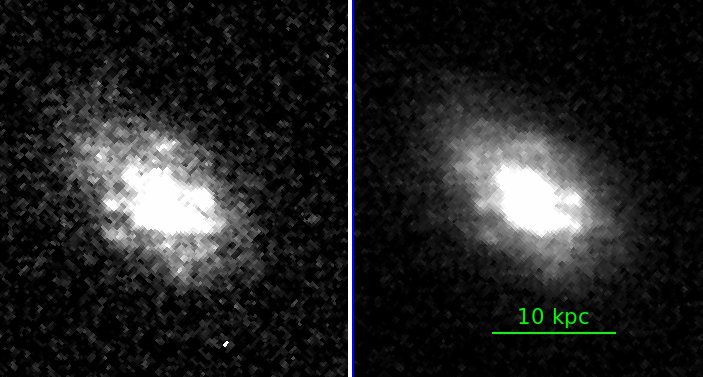
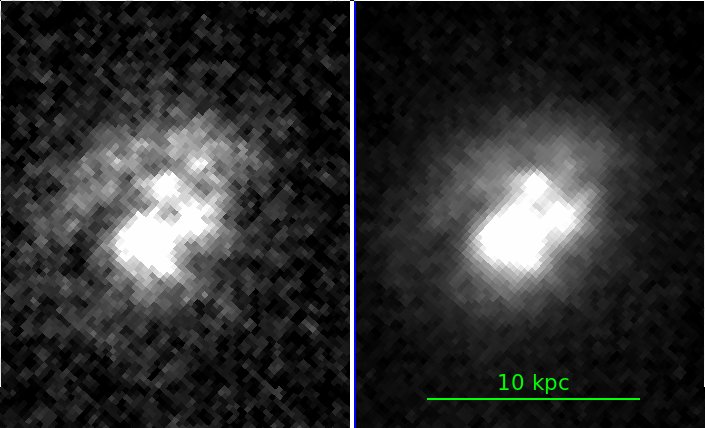
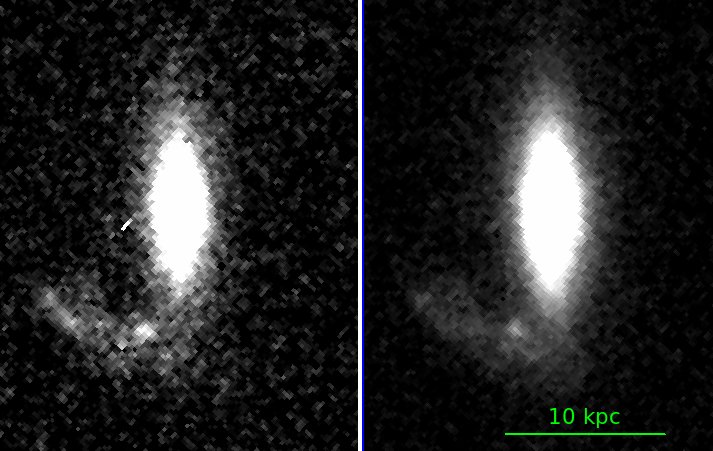
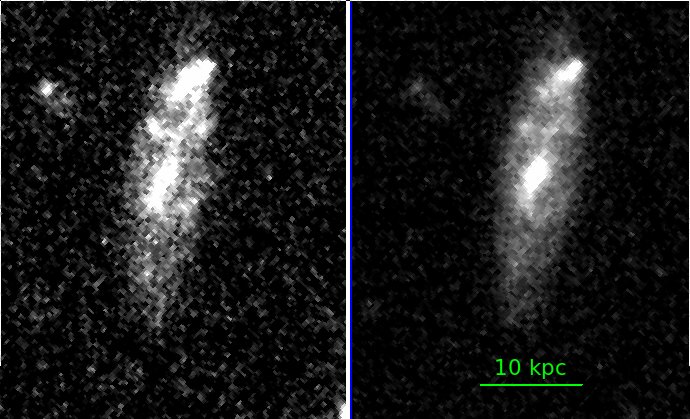
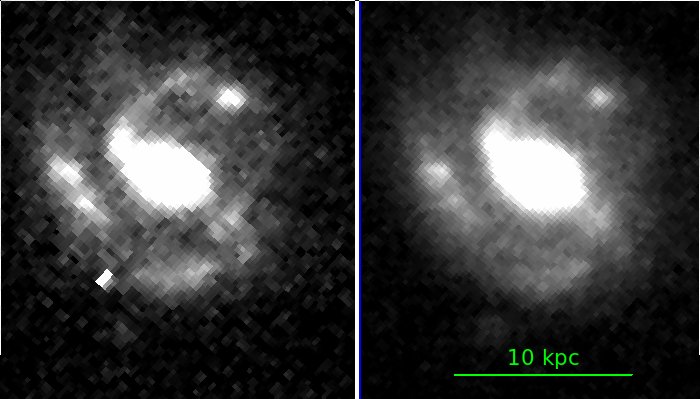
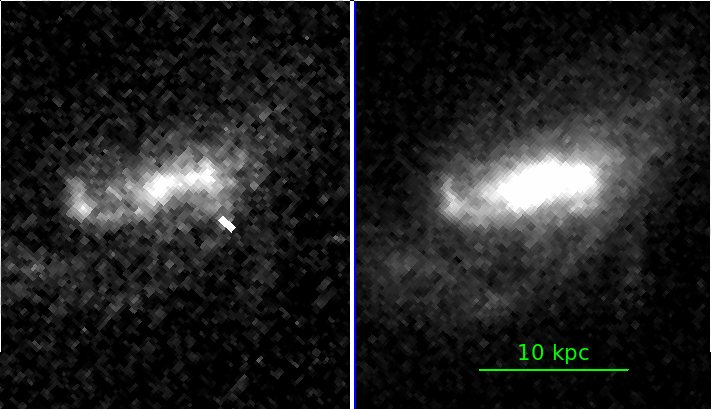
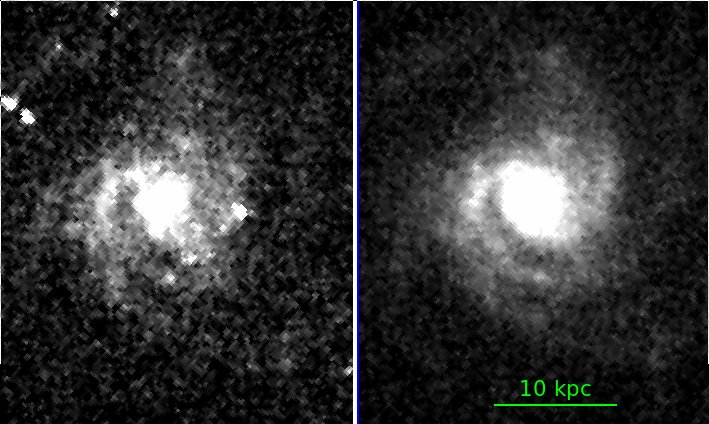
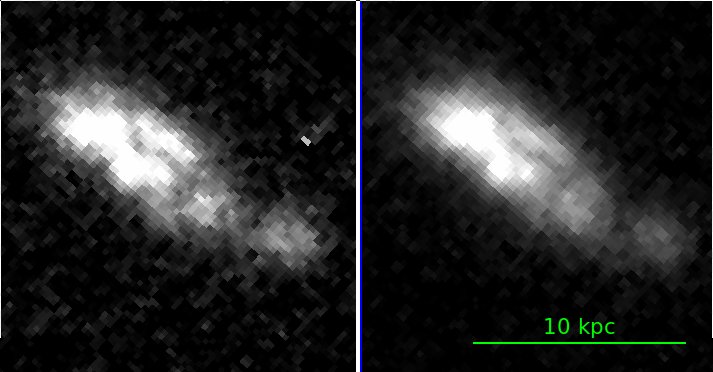
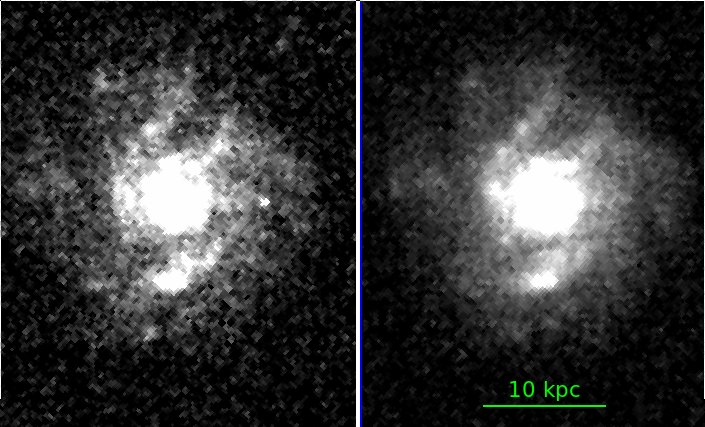
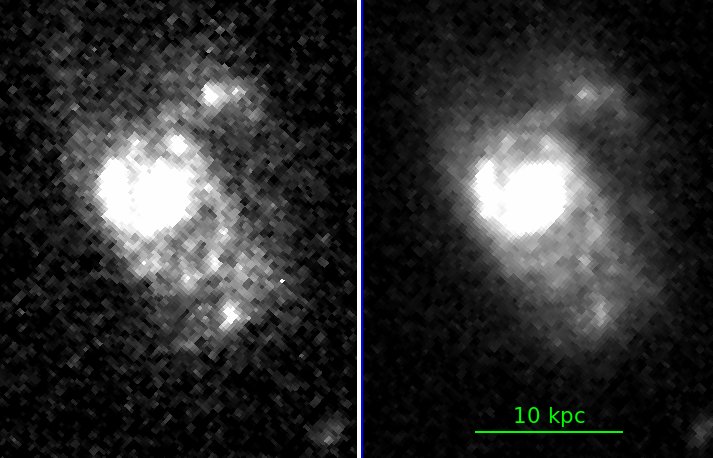
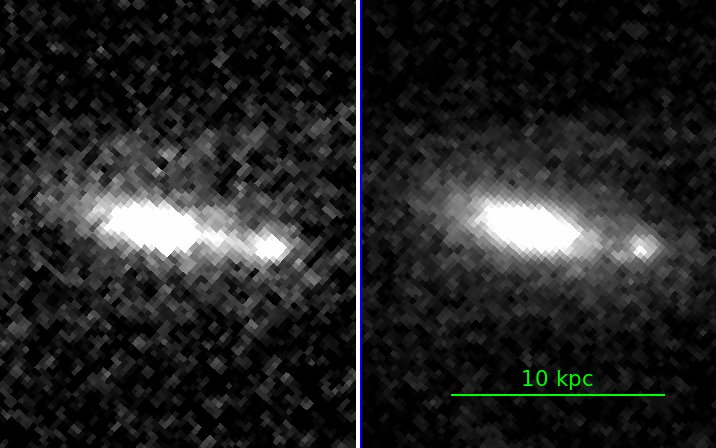
Appendix B Images of jellyfish galaxies in all clusters except MACS J0717.5+3745