Ultrafast scattering dynamics of coherent phonons in Bi1-xSbx in the Weyl semimetal phase
Abstract
We investigate ultrafast phonon dynamics in the Bi1-xSbx alloy system for various compositions using a reflective femtosecond pump-probe technique. The coherent optical phonons corresponding to the A1g local vibrational modes of Bi-Bi, Bi-Sb, and Sb-Sb are generated and observed in the time domain with a few picoseconds dephasing time. The frequencies of the coherent optical phonons were found to change as the Sb composition was varied, and more importantly, the relaxation time of those phonon modes was dramatically reduced for values in the range 0.5–0.8. We argue that the phonon relaxation dynamics are not simply governed by alloy scattering, but are significantly modified by anharmonic phonon-phonon scattering with implied minor contributions from electron-phonon scattering in a Weyl-semimetal phase.
Keywords: coherent phonon, phonon scattering, ultrafast spectroscopy, topological materials.
1 INTRODUCTION
In the past decade, topological materials, such as topological insulators (TIs), Dirac semimetals, and Weyl semimetals, have attracted much attention in condensed matter physics owing to growing interest in the fundamental properties of their surface (bulk) band structure [1, 2, 3, 4, 5], massless quasiparticle dynamics [6], spin dynamics [2, 7], carrier transport [8], and many other new physical effects [9, 10, 11, 12]. Topological materials, in particular TIs, have been considered also as promising materials for thermoelectric devices, taking advantage of their intriguing properties, such as low thermal conductivities [13], and large Seebeck coefficients [14]. Bi1-xSbx was first experimentally discovered to be a 3D TI in 2008 (Ref. [6]), and has been recently predicted to be a Weyl semimetal for some compositions with a specific atomic arrangement [15]. In addition, structural changes in Bi1-xSbx depending on the composition have been theoretically predicted [16, 17] and are thought to be an important factor in the stabilization of topological properties in the alloy system.
Although among TIs, Bi2Se3, Bi2Te3 and Sb2Te3 have been extensively investigated from the point of view of ultrafast dynamics [18, 19, 20, 21, 22, 23], an alloy system like Bi1-xSbx has rarely been studied because of the difficulty in precisely controlling the composition , with which the electronic band structure of the Bi1-xSbx system changes from semiconducting to a simple semimetal (SM) with band crossover [24, 25], a TI with a gapless surface state, and even to a Weyl semimetal with a Weyl node at a non zone-center position [26, 27].
In practice, the physical information for the Bi1-xSbx system has been limited [28, 29], and only a few experimental studies have been reported on Dirac quasiparticles [2, 3, 6]. Moreover, while the properties of lattice vibrations, phonons, have been examined for the Bi1-xSbx system by Raman scattering [30, 31, 32], the presence of instrumental broadening due to slit and laser line widths [31] as well as serious background from Rayleigh scattering [32] may limit the accuracy of such measurements. These limitations make the indirect measurement of precise phonon lifetimes on picosecond and femtosecond time scales generally difficult to achieve using conventional Raman measurements. Our motivation here is the direct measurement of the dephasing dynamics of coherent phonons on sub-picosecond time scales and this approach offers strong advantages regarding the accuracy of the dephasing time values over those indirectly estimated by line widths from conventional Raman measurements.
Phonon scattering, such as electron-phonon, anharmonic phonon-phonon, defect-phonon (or alloy) scatterings, are important issues in the field of thermoelectric and topological devices, since phonon scattering determines the thermal conductivity [13] and the mobility of Dirac quasiparticles [6]. Thus, exploring the ultrafast dynamics of, e.g., anharmonic phonon-phonon scattering and alloy scattering, on a sub-picosecond time scale, is a challenging issue required for the development of new topological devices. Such dynamical studies of the phonon scattering processes will offer key physical information not only for device applications, but also for the understanding of the fundamental physical properties of topological alloy systems.
Here we explore the ultrafast scattering dynamics of coherent phonons in the Bi1-xSbx alloy system for various compositions by using a femtosecond pump-probe technique with 20 fs time resolution. The coherent optical phonons corresponding to the local vibrations of Bi-Bi, Bi-Sb, and Sb-Sb bonds were detected, and the relaxation rate of the Sb-Sb phonon was found to strongly decrease for 0.5. We discuss the phonon relaxation dynamics from the viewpoint of alloy scattering, electron-phonon scattering, and anharmonic phonon-phonon scattering.
2 MATERIALS AND METHODS
2.1 Samples
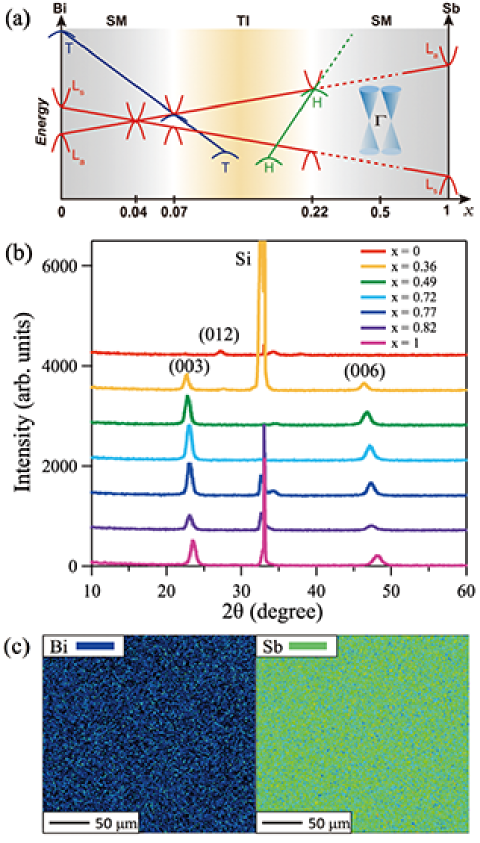
The samples used in this study were highly orientated polycrystalline Bi1-xSbx alloy films prepared by radio frequency magnetron sputtering [33]. Thin film samples were successfully deposited onto a Si (100) substrate with different compositions = 0, 0.36, 0.49, 0.72, 0.77, 0.82 and 1.0 by carefully tuning the sputter power of each target. According to the reported electronic band structures in the literature for the Bi-Sb system, the addition of Sb to Bi shifts the and upper bands downwards and the lower band upwards [figure 1(a)], resulting in the alloy changing from a semimetal to a topological insulator [24, 25]. The topological insulating composition range is between 0.07 and 0.22, indicating that the -point band is inverted with respect to the electronic band in Bi [6, 34]. For our samples, the = 0.36 alloy was a semimetal with a narrow band gap (less than several tens of a meV) at the -point [4, 25]. The two samples = 0.49 and 0.82 are close to the compositions theoretically predicted to form in the Weyl semimetal phase [15]. All films were approximately 16-nm-thick and X-ray diffraction (XRD) measurements showed that they were highly orientated polycrystalline films as can be seen in figure 1(b) except for the pure Bi sample which showed the presence of off-orientation peaks. The average grain size in the out-of-plane direction estimated from Scherrer’s formula [35] was 17 nm, a value nearly equivalent to the film thickness, suggesting that single grains were formed from the substrate/film interface to the film surface. This trend was observed regardless of the Sb content, and thus the effect of grain boundary scattering on is expected to be negligible. It should be noted that the (003) and (006) peaks shift toward higher angle with increasing Sb content suggesting that the lattice constant, , decreases upon alloying with Sb which has a smaller atomic radius.
The composition of the films was evaluated by electron probe micro analysis (EPMA) as shown for the case of = 0.49 in figure 1(c). To reduce uncertainty in the composition, the value of the Sb content, , was measured at five different positions on the sample, and averaged. We have also measured the transient reflectivity change signal at different sample positions, confirming that the signal did not vary. Furthermore, the compositional mapping displayed in figure 1(c) confirms a uniform distribution of both elements over the substrate surface. To prevent oxidation, samples were capped by a 20-nm-thick ZnS-SiO2 layer without breaking the vacuum. ZnS-SiO2 capping layers have long been used as a dielectric layer in optical disc applications [36] and are completely transparent to near infrared light making no contribution to the observed signal.
2.2 Experimental methods
Time-resolved measurements using a reflection-type pump-probe setup were carried out to observe the coherent phonon signal [37, 38]. The light source was a mode-locked Ti:sapphire laser oscillator with a center wavelength of 830 nm, providing ultrashort pulses of 20 fs duration and operated at a 80 MHz repetition rate. The pump and probe beams were focused by an off-axis parabolic mirror on the samples to a diameter of 19 m and 15 m, respectively, assuring nearly homogeneous excitation [39, 40, 41]. The fluence of the pump beam was fixed at 855 , while that of the probe was set to of the pump beam, 43 . The penetration depth of the laser beam estimated from the absorption coefficients was about 17–20 nm [42], which is larger than the sample thickness (16 nm). Thus, in the present study the optical excitation was homogeneous over the entire sample thickness and the effects of the penetration depth did not play a role on the observed coherent phonon spectra. The delay between the pump and the probe pulses was scanned up to 15 ps by an oscillating retroreflector operated at a frequency of 19.5 Hz [43]. The transient reflectivity change () was recorded as a function of pump-probe time delay. The time zero was determined as the position of the initial drop, which was confirmed with a Bi semimetal sample [44]. The measurements were performed in air at room temperature.
3 RESULTS AND DISCUSSION
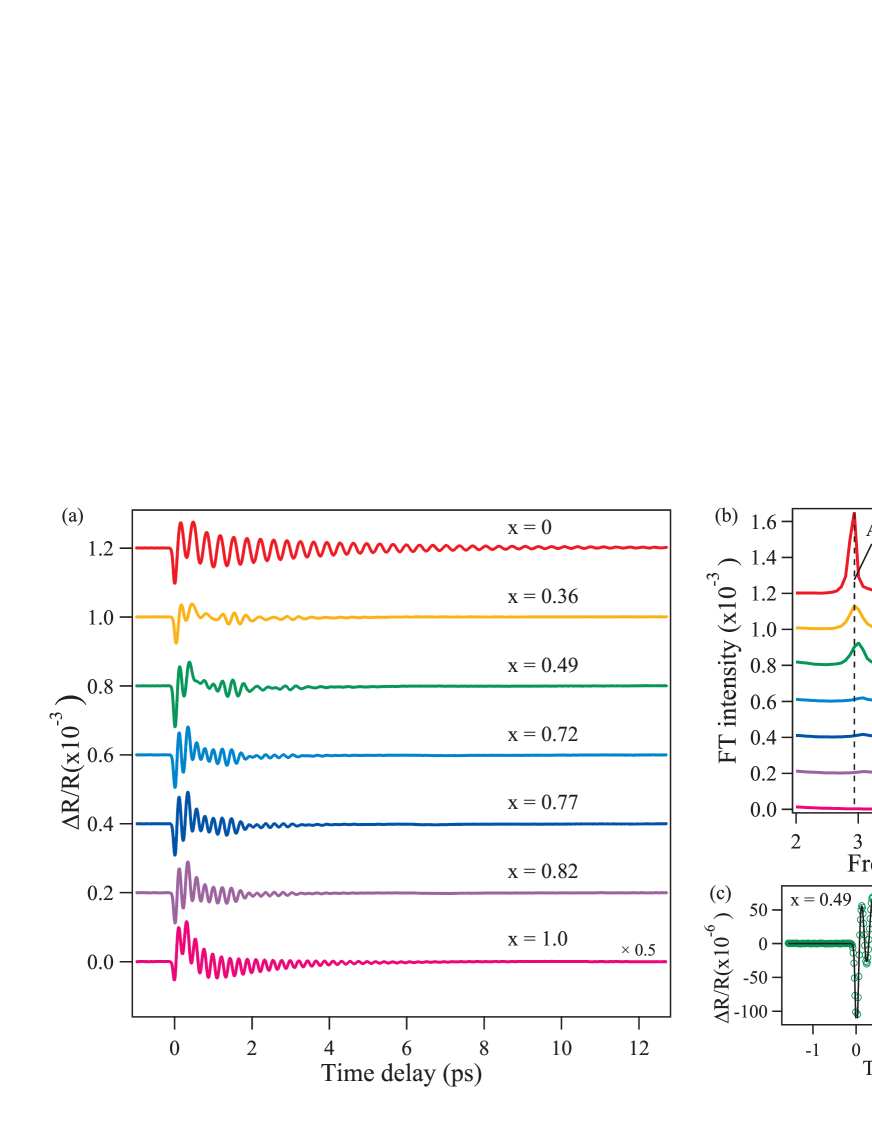
Figure 2(a) shows the isotropic reflectivity changes () observed in Bi1-xSbx films with different compositions. The coherent phonon signal, superimposed on the photoexcited carrier relaxation background, was observed as a function of the time delay. It is interesting to note that the frequency and oscillation pattern of the coherent phonons differ depending on the composition , under a constant pump fluence. We also note that the amplitude of the coherent phonon decreased when the Sb concentration was in the range of = 0.36 - 0.82. The observed large decrease in amplitude may possibly be due to damping of the coherent lattice vibrations due to atomic disorder, i.e., alloy scattering. The relaxation time of the coherent phonons was also found to shorten when the Sb concentration was in the range of = 0.36 - 0.82. In particular, for = 0.49, the coherent phonon oscillation was strongly damped for the time delays of 1 and 3 ps (or exhibited a beat pattern), implying the existence of multiple phonon modes [28].
Figure 2(b) shows the Fourier transformed (FT) spectra obtained from the time domain data shown in figure 2(a). We note here that the non-oscillatory carrier relaxation component was subtracted first and then the FT was carried out to check if the carrier background affected the peak position or peak width of the FT. It was confirmed that the peak position and width did not change with and without subtracting the carrier background. Thus, to retain the original oscillatory information we have displayed the FT without subtraction of the non-oscillatory component. In total, three distinct peaks can be observed, which are assigned to the A1g modes of Bi-Bi (2.93 THz for = 0), Bi-Sb (3.63 THz for = 0.36), Sb-Sb (4.54 THz for = 1), respectively. The peak frequencies observed in the FT spectra obtained from the time domain data are reasonably consistent with Raman scattering data [31, 30, 32].
In order to estimate the relaxation time of the coherent phonon mode for various Sb concentrations , we carried out curve fitting of the time domain data shown in figure 2(a) using a linear combination of damped harmonic oscillators and an exponentially decaying function. For the semimetal systems like Bi and Sb, the oscillatory component is well described by a cosine function under the conditions of the displacive excitation of coherent phonons (DECPs) [37]. Thus, the fitting function used was [28, 45]:
| (1) |
where , , , are the amplitude, relaxation time, frequency, and initial phase of the coherent phonons, respectively. The subscripts indicates the three A1g modes of Bi-Bi ( = 1), Bi-Sb ( = 2), and Sb-Sb ( = 3). is the Heaviside function convoluted with Gaussian to account for the finite time-resolution, while and are the amplitude and relaxation time of the carrier background, respectively. As can be seen in figure 2(c) the quality of the fit was good.
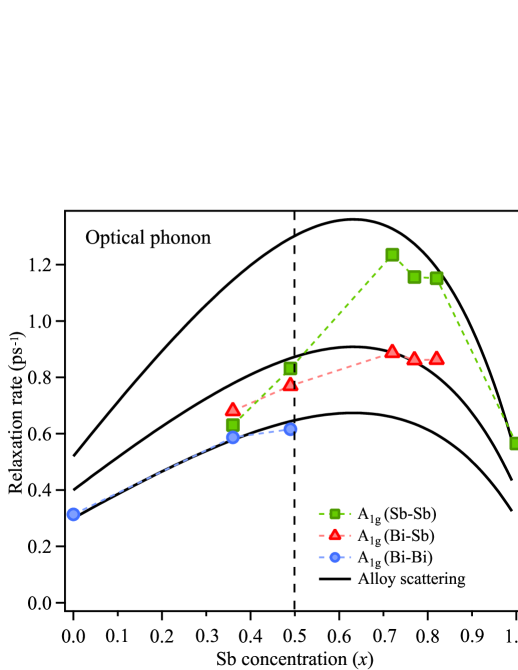
Figure 3 shows the phonon scattering rate , the inverse of the relaxation time, of the coherent phonon oscillations as a function of the Sb concentration () obtained by a fit using equation (1). Interestingly, the phonon scattering rate is largest for Sb concentrations of about = 0.7. The scattering rate 1/ of the coherent A1g phonon in the Bi1-xSbx alloy is given by the sum of the intrinsic anharmonic phonon-phonon scattering , the alloy scattering , and the electron-phonon scattering . The term is given by the Klemens formula [46], where is the effective anharmonic constant, is the phonon distribution function, and and are the frequencies of the longitudinal acoustic (LA) or transverse acoustic (TA) and the A1g phonons, respectively [44]. Note that the anharmonic phonon–phonon scattering term is assumed to be a constant because the anharmonic decay channel depends mainly on the distribution of lower lying TA and LA phonons and thus on the lattice temperature. For the general case with a constant crystal structure, changes in would be expected to be negligibly small at a constant lattice temperature. We have estimated the lattice temperature rise for Bi ( = 0) upon excitation using the two-temperature model (TTM) [47, 48], which predicts a temperature rise of 50 K [23]. Although the lattice specific heat will slightly increase when the composition () becomes larger (e.g., by 20% as varies up to 0.12 [49]), we know from TTM calculations that for larger lattice specific heat values, the lattice temperature rise will decrease. Therefore, we conclude that the lattice temperature is nearly constant or the temperature change is small for the different compositions. In the latter sections, however, we will show varies with the composition .
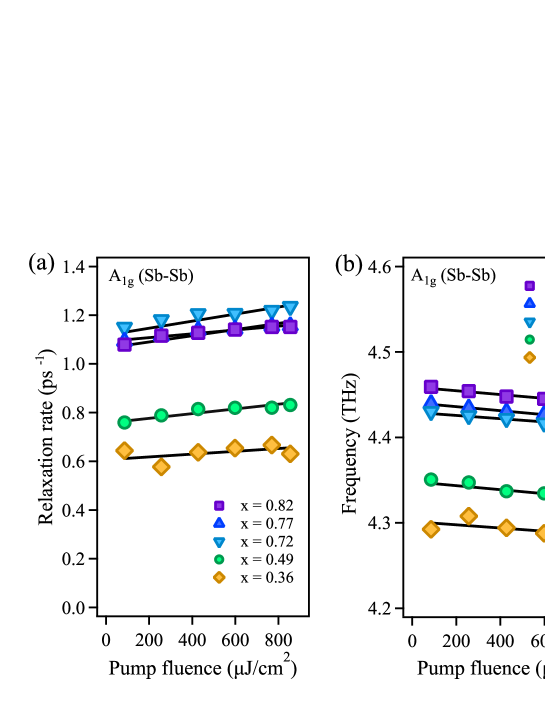
To examine possible contributions from electron-phonon scattering , the pump fluence dependence of the relaxation rate (the inverse of the dephasing time) and the frequency are presented as a function of the pump fluence in figure 4. At present, reliable data for the variation of the carrier density over the entire composition in the Bi1-xSbx system is not available [27], but the photogenerated carrier density is of the same magnitude, as figure 3 was obtained under a constant fluence. As electron-phonon scattering would occur near the Fermi-level (Ef) for the semimetal or Weyl semimetal phase [50], we can examine the effect of the carrier density on the electron-phonon scattering near the Ef by the analysis shown in figure 4. Here the frequency and relaxation rate represent the real and imaginary parts of the phonon self-energy, respectively, depending on the photo-excited carrier density [51]. Assuming , where is the pump fluence, we fit the frequency and relaxation rate to and , respectively, to obtain, for =0.49, = 4.35 THz, = – 0.024 THzcm2/mJ and = 0.757 ps-1, = 0.097 ps-1cm2/mJ, respectively. Both the relaxation rate and frequency exhibited a linear and small change (10 %) as the pump fluence was varied from 86 to 855 , as can be seen in the fitting parameters (A and B). The contribution from is, however, considered to be insufficient to explain the observed larger change (50 %) in the relaxation rate (figure 3). As discussed above, alloy scattering is expected to play a significant role in Bi1-xSbx alloys [52], and therefore we examined an alloy scattering model for the phonon scattering rate in figure 3.
The scattering rate due to the alloy scattering can be expressed using the phonon frequency [53, 54] as,
| (2) |
where is the volume per atom, is an alloy constant, and is the vibrational density of states per unit volume. Here, the total vibrational density of states is given by the sum over phonon branch ,
| (3) |
where is the wavevector. The scattering-rate constant is given by three different contributions,
| (4) |
where the first contribution is due to the mass difference, the second due the isotope effect, and third strain effects. Here we focus on the mass difference, which plays the dominant role in scattering in the alloy Bi1-xSbx [52]. The mass difference constant is given by,
| (5) |
where is the mass ratio of atoms with mass , and is the average mass given by . The term depends on the atomic concentration , and therefore is given by
| (6) | |||||
where the atomic mass of Bi is 208.98, and that of Sb is 121.76, with being given in unified atomic mass units. Thus, the term shown in equation (2) can be written as,
| (7) | |||||
In addition, here, we apply the Einstein model for the term shown in equation (3) due to the nearly flat dispersion for the optical phonon mode [55], and thus we assume that all the phonon modes for the optical phonon branch have the same frequency . According to the Einstein model, equation (3) can be reduced to,
| (8) |
where is the number of unit cells. Thus, is independent of the Sb concentration . Based on the above considerations, can be finally written as,
| (9) | |||||
where is a proportional constant. Since the exact values of both and constants were not available because of the uncertainly in the crystal structures of the Bi1-xSbx system, we held = 1 for simplicity. In addition, each model curve has a background, assuming and do not depend on the composition as a first trial, i.e., 0.55 ps-1 for the Sb-Sb mode, 0.3 ps-1 for the Bi-Bi mode, and 0.4 ps-1 for the Bi-Sb mode. The scattering rate thus obtained based on equation (9), as a function of the Sb concentration and the frequency of each optical phonon mode, is plotted in figure 3. As shown in figure 3, the theoretical scattering rate based on equation (9) reproduces the experimental data well, excluding the Sb-Sb vibrational mode around .
We now discuss why the relaxation rate of the Sb-Sb vibrational mode around is smaller than the corresponding theoretical value. One plausible explanation is that the anharmonic phonon-phonon scattering rate is accentuated by mass disorder when the phonon frequency decreases, as seen in Si1-xGex alloy systems [56]. In the present study, around where the mass disorder is at a maximum, anharmonic phonon-phonon scattering is accentuated for the lower frequency phonons, specifically the Bi-Bi and Bi-Sb vibrations. In this case, the relaxation rate due to the term should exist for the two modes (Bi-Bi and Bi-Sb vibrations) around , while the term for the Sb-Sb vibrational mode should decrease.
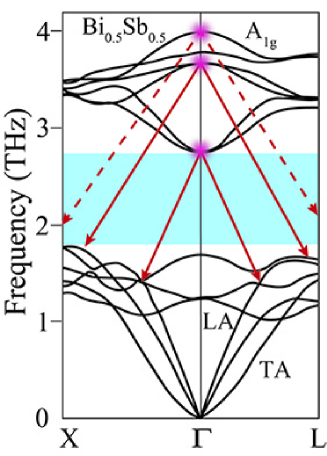
To test for the above possible scenario based on anharmonic phonon-phonon decay channels in Bi1-xSbx around , we extracted the phonon dispersion from the literature as schematically shown in figure 5 (Ref. [17]). Although there are some discrepancies between the frequencies of the optical phonon modes at the point in figure 5 and our observations [figure 2(b)], due to different lattice temperature and a possible mismatch in the lattice structure, there is a large energy gap between the acoustic and optical phonon branches for 1.8 2.8 THz. Therefore, the decay channel of the Sb-Sb A1g mode (4.0 THz) is forbidden (red dashed arrows) while the other two optical phonon modes of the Bi-Bi and Bi-Sb A1g modes can decay into the two underlying acoustic phonons under the condition that both the phonon energy and the momentum are conserved (red solid arrows). Thus, phonon dispersion considerations can support the idea that the term significantly decreases for the A1g modes of Sb-Sb around .
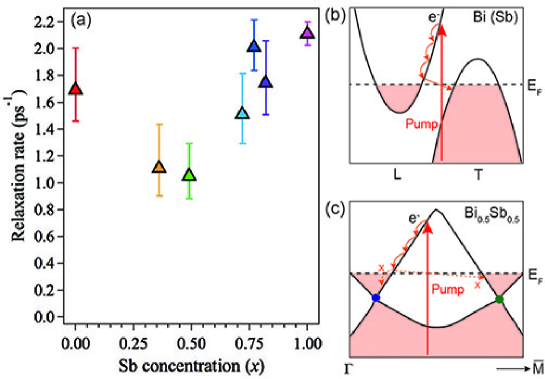
Another possible explanation is scattering by a quasiparticle coupled to the Sb-Sb bond, which could lead to unique scattering dynamics in the Weyl semimetal phase, such as a decrease in the electron-phonon scattering rate. Figure 6 presents the relaxation rate () of the carrier dynamics extracted by the fit in figure 2 as a function of the Sb content . The carrier relaxation rate decreases for , indicating that electron-phonon scattering becomes weak near = 0.5. This result suggests a close relationship between the Weyl semimetal phase ( = 0.5) and the fact that electron-phonon scattering near Weyl points, which are close to the point, can become weak [50, 57] [see also figure 6(b) and (c)]. On the other hand, the contribution from electron-phonon scattering to the phonon dephasing rate is expected to be smaller than that from anharmonic phonon scattering, as discussed in figure 4, and therefore, the phonon relaxation dynamics are not simply governed by alloy scattering, but are significantly modified by anharmonic phonon-phonon scattering with implied minor contributions from electron-phonon scattering in a Weyl-semimetal phase. Although exploring such new quasiparticle scattering dynamics will require more experimental and theoretical study, the fact that a reduction in the scattering rate was observed near the Weyl semimetal phase ( = 0.5) suggests a possible contribution from the quasiparticle scattering process described above.
4 CONCLUSIONS
In conclusion, we have investigated the dynamics of coherent optical phonons in Bi1-xSbx for various Sb compositions by using a femtosecond pump-probe technique. The coherent optical phonons corresponding to the A1g modes of Bi-Bi, Bi-Sb, and Sb-Sb local vibrations were generated and observed in the time domain. The frequencies of the coherent optical phonons were found to change with the Sb composition , and more importantly, the relaxation times of these phonons were strongly attenuated for values in the range 0.5–0.8. We argue that the phonon relaxation dynamics are not simply governed by alloy scattering, e.g., scattering due to mass differences, but are significantly modified by alloy-induced anharmonic phonon-phonon decay channels with minor contributions from electron-phonon scattering in the Weyl semimetal phase, which is expected to appear at = 0.5.
References
References
- [1] Fu L and and Kane CL 2007 B 76 045302
- [2] Hsieh D 2009 323 919
- [3] Nishide A, Taskin A A, Takeichi Y, Okuda T, Kakizaki A, Hirahara T, Nakatsuji K, Komori F, Ando Y and Matsuda I 2010 B 81 041309
- [4] Benia H M, Straßer C, Kern K and Ast C R 2015 B 91 161406
- [5] Zhang H-J, Liu C-X, Qi X-L, Deng X-Y, Dai X, Zhang S-C and Fang Z 2009 B 80 085307
- [6] Hsieh D, Qian D, Wray L, Xia Y, Hor Y S, Cava R J and Hasan M Z 2008 452 970
- [7] Roushan P, Seo J, Parker C V, Hor Y S, Hsieh D, Qian D, Richardella A, Hasan M Z, Cava R J and Yazdani A 2009 460, 1106
- [8] Taskin A A and Ando Y 2009 B 80 085303
- [9] Teo J C Y, Fu L and Kane CL 2008 B 78 045426
- [10] Zhu X-G and Hofmann P 2014 B 89 125402
- [11] Katayama I, Kawakami H, Hagiwara T, Arashida Y, Minami Y, Nien L-W, Handegard OS, Nagao T, Kitajima M and Takeda J 2018 B 98 214302
- [12] Li X 2019 B 100 115145
- [13] Samanta M, Pal K, Waghmare U V and Biswas K 2020 132 4852
- [14] Ghaemi P, Mong R S K and Moore J E 2010 105 166603
- [15] Su Y-H, Shi W, Felser C and Sun Y 2018 B 97 155431
- [16] Singh S, Valencia-Jaime I, Pavlic O and Romero A H 2018 B 97 054108
- [17] Singh S, Ibarra-Hernández W, Valencia-Jaime I, Avendaño-Franco G and Romero A H 2016 18 29771
- [18] Wang Y, Guo L, Xu X, Pierce J and Venkatasubramanian R 2013 B 88 064307
- [19] Reimann J, Güdde J, Kuroda K, Chulkov E V and Höfer U 2014 B 90 081106
- [20] Misochko O V, Flock J and Dekorsy T 2015 B 91 174303
- [21] Glinka Y D, Babakiray S, Johnson T A, Bristow A D, Holcomb M B and Lederman D 2013 103 151903
- [22] Sobota J A, Yang S-L, Leuenberger D, Kemper A F, Analytis J G, Fisher I R, Kirchmann P S, Devereaux T P and Shen Z-X 2014 113 157401
- [23] Mondal R, Arai A, Saito Y, Fons P, Kolobov A V, Tominaga J and Hase M 2018 B 97 144306
- [24] Guo H 2011 B 83 201104(R)
- [25] Nakamura F 2011 B 84 235308
- [26] Kim H-J, Kim K-S, Wang J-F, Sasaki M, Satoh N, Ohnishi A, Kitaura M, Yang M and Li L 2013 111 246603
- [27] Singh S, Garcia-Castro A, Valencia-Jaime I, Muñoz F and Romero A H 2016 B 94 161116
- [28] Hase M, Itano T, Mizoguchi K and Nakashima S-i 1998 37 L281
- [29] Wu T, Zhou C, Jiang L, Zhai F, Jia W and Fan Z 2010 283 4383
- [30] Zitter R and Watson P 1974 B 10 607
- [31] Lannin J S 1979 B 19 2390
- [32] Lannin J S 1979 29 159
- [33] Saito Y, Fons P, Kolobov A V, Mitrofanov K V, Makino K, Tominaga J, Hatayama S, Sutou Y, Hase M and Robertson J 2020 53 284002
- [34] Golin S 1968 176 830
- [35] Scherrer P 1912 (Springer, Berlin Heidelberg)
- [36] Ohshima N 1996 79 8357
- [37] Zeiger H, Vidal J, Cheng T, Ippen E, Dresselhaus G and Dresselhaus M 1992 B 45 768
- [38] Fukuda T, Makino K, Saito Y, Fons P, Kolobov A V, Ueno K and Hase M 2020 116 093103
- [39] Hase M, Katsuragawa M, Constantinescu A M and Petek H 2013 15 055018
- [40] Minami Y, Yamaki H, Katayama I and Takeda J 2014 7 022402
- [41] Subkhangulov R R, Mikhaylovskiy R V, Zvezdin A K, Kruglyak V V, Rasing Th and Kimel A V 2016 10 111
- [42] Hagemann H-J, Gudat W and Kunz C 1975 65 742
- [43] Hase M, Katsuragawa M, Constantinescu A M and Petek H 2012 6 243
- [44] Hase M, Mizoguchi K, Harima H, Nakashima S-i and Sakai K 1998 B 58 5448
- [45] Hase M, Ishioka K, Demsar J, Ushida K and Kitajima M 2005 B 71 184301
- [46] Klemens P G 1966 148 845
- [47] Kaganov M I, Lifshitz I M, Tanatarov L V 1957 4 173
- [48] Allen P B 1987 59 1460
- [49] Rogacheva E I, Doroshenko A N, Nashchekina O N and Dresselhaus M S 2016 109 131906
- [50] Parameswaran S A, Grover T, Abanin D A, Pesin D A and Vishwanath A 2014 X 4 031035
- [51] Cerdeira F, Fjeldly T A and Cardona M 1973 B 8 4734
- [52] Lee S, Esfarjani K, Mendoza J, Dresselhaus M S and Chen G 2014 B 89 085206
- [53] Tamura S-i 1983 B 27 858
- [54] Aksamija Z and Knezevic I 2013 B 88 155318
- [55] Kittel C 2004 (Wiley, New York)
- [56] Garg J, Bonini N, Kozinsky B and Marzari N 2011 106 045901
- [57] Garcia C A C, Coulter J and Narang P 2020 2 013073