Dust Traps and the Formation of Cavities in Transition Discs: A millimetre to sub-millimetre comparison survey
Abstract
The origin of the inner dust cavities observed in transition discs remains unknown. The segregation of dust and size of the cavity is expected to vary depending on which clearing mechanism dominates grain evolution. We present the results from the Discs Down Under program, an 8.8 mm continuum Australia Telescope Compact Array (ATCA) survey targeting 15 transition discs with large ( 20 au) cavities, and compare the resulting dust emission to Atacama Large millimetre/sub-millimetre Array (ALMA) observations. Our ATCA observations resolve the inner cavity for 8 of the 14 detected discs. We fit the visibilities and reconstruct 1D radial brightness models for 10 sources with a S/N > . We find that, for sources with a resolved cavity in both wavebands, the 8.8 mm and sub-mm brightness distributions peak at the same radius from the star. We suggest that a similar cavity size for 8.8 mm and sub-mm dust grains is due to a dust trap induced by the presence of a companion.
keywords:
planet-disc interactions – stars: pre-main sequence – techniques: interferometric1 Introduction
Protoplanetary discs around young stars are the birth places of planets. Of particular interest are the so-called transition discs, which exhibit inner cavities in their dust distribution. They were historically believed to be the phase of transition between gaseous protoplanetary discs and debris discs, but their exact place in the evolutionary timeline (if any) still remains unknown (Espaillat et al., 2014). They were originally identified via a dip in the mid-infrared region of their spectral energy distributions (Strom et al., 1989; Wolk & Walter, 1996), suggesting a deficit of micron-sized grains in the inner disc. Sub-millimetre interferometry has confirmed this deficit and resolved the inner cavity in the dust of numerous transition discs for the largest (20 au) cavities (e.g. Brown et al., 2009; Andrews et al., 2011; Francis & van der Marel, 2020).
The deficit of central emission may result from grain growth due to the vertical settling, radial drift, and coagulation of grains, resulting in a radial and vertical size sorting, and grain growth to sizes outside current observation capabilities (Tanaka et al., 2005). Another possible explanation is a dust trap; the trapping of dust at local maxima in the gas density (Whipple, 1972; Pinilla et al., 2012) that can overcome the radial drift barrier (Weidenschilling, 1977). Dust grains interior to this region accrete onto the host star, depleting the inner disc and forming a cavity. A number of physical mechanisms can produce dust traps in transition discs, including photoevaporation, dynamical clearing from a companion, and dead-zones (Williams & Cieza, 2011; Pinilla et al., 2016).
As the accretion rate decreases, high-energy photons can impinge the accretion flow and photoevaporate the disc progressively further away. This limits the resupply of inner disc material and increases the local gas pressure at the photoevaporation front, trapping dust at the inner edge of the disc (Hollenbach et al., 1994; Clarke et al., 2001; Alexander et al., 2006). Numerous photoevaporation models (Owen & Clarke, 2012; Gorti et al., 2015; Owen et al., 2017; Ercolano & Pascucci, 2017; Ercolano et al., 2018) suggest that discs with an inner deficit of emission due to photoevaporative winds will have low accretion rates () and exhibit cavities with small radii (, see Figure 5 in Owen & Clarke (2012), or , see Figure 6 in Ercolano & Pascucci (2017)). This is inconsistent with (sub)millimetre observations of transition discs, exhibiting cavities of tens of au in size and high accretion rates (Manara et al., 2014).
Dust traps can also result from the dynamical clearing of a companion. The formation of a planetary mass companion will locally deplete gas and/or dust in the disc and produce a pressure bump at the cavity edge (e.g. Paardekooper & Mellema, 2004; Rice et al., 2006; Fouchet et al., 2007, 2010; Pinilla et al., 2012), while the tidal truncation of the disc by a binary companion (e.g. Lin & Papaloizou, 1979) results in a gas pressure bump at the leading edge of the truncation, consequentially trapping dust and forming a cavity as the inner disc accretes onto the host-star at viscous timescales ( years) (Brauer et al., 2007). Dust traps formed by the presence of a companion are expected to result in a grain size distribution that mirrors the profile of the gas pressure at the maxima with larger grains strongly concentrating at the peak of the pressure profile, and smaller grain exhibiting a more extended radial structure. This is due to the relationship between the grains Stokes number and its size, as larger grains with are significantly influenced by the pressure of the gas whereas smaller grains with a are more coupled to the gas. Disc cavities have been attributed to the presence of a companion in a number of previous studies (van der Marel et al., 2016a; van der Plas et al., 2017b; van der Marel et al., 2018; Pinilla et al., 2018; Ginski et al., 2018; Price et al., 2018; Toci et al., 2020).
In regions of low ionization where the magneto-rotational instability is inhibited, there is an increase of accretion stress and subsequent local maxima in the gas pressure that can trap dust (Flock et al., 2015; Ruge et al., 2016). Models based on dust trapping at dead zone edges (Pinilla et al., 2016; Ueda et al., 2019) are highly dependent on the level of turbulence throughout the disc, and predict a similar peak in the radial distribution of sub-mm to mm dust species and strong gas depletion in the outer disc.
More than one of these physical mechanisms may occur simultaneously in transition discs. However, the dominant physical mechanism that produces a gas pressure maxima (dust trap) will result in distinct cavity sizes, accretion rates, and/or grain size distributions. As different wavebands trace dust grains of order the same size as the wavelength, multi-wavelength observations of transition discs can reveal differences in the grain size distribution and further differentiate between the mechanisms behind dust trap and cavity formation.
Previous multi-wavelength observations of transition discs that probe both sub-millimetre and millimetre sized grains (Wright et al., 2015; Casassus et al., 2015; Macías et al., 2018) show that each population is trapped at a similar radial position from the host star (van der Marel et al., 2015b). However, the number of sources with multi-wavelength data still remains small. In this paper we present new millimetre observations for 15 transition discs combined with archival ALMA millimetre observations, which is the largest multi-wavelength survey of transition discs to date.
2 Observations and Data Reduction
2.1 Sample Selection
Recent high-resolution () observations of transition discs with ALMA have provided a growing catalogue of discs observed at sub-mm wavelengths which show resolved dust cavities. Our Discs Down Under survey was designed to specifically complement this catalogue at 8.8 mm for southern hemisphere sources that are observable by the ATCA.
Our sample (see Table 1) includes four Herbig Ae stars (HD34282, HD100453, HD135344B, HD169142), and eleven T Tauri stars (SZ Cha, CS Cha, HP Cha, HD143006, RY Lup, J1604, J160830.7, Sz111, SR24S, SR21, DoAr44). Three of these are located in Lupus (RY Lup, J16083070, & Sz111), three in Chamaeleon (SZ Cha, CS Cha, & HP Cha) and three in Ophiuchus (SR 24S, SR 21 and DoAr44). One target (J1604) is a member of the Upper Scorpius Association. Three of the targets have previously been observed with ATCA in the 7 mm band at low resolution and were unresolved (Sz111 and RY Lup, Lommen et al. 2010; CS Cha, Lommen et al. 2009), and one with the VLA at 7 mm (HD169142, Dent et al., 2006).
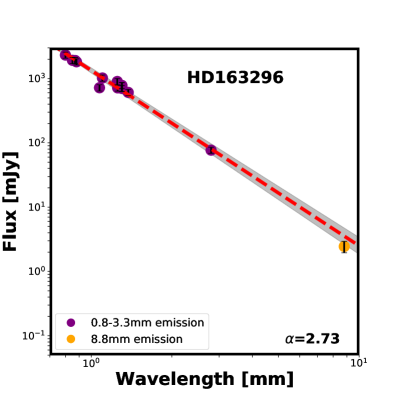
This survey also targeted the protoplanetary disc HD163296, which is not a transition disc and hence is excluded from the analysis. Observational results for this source are presented in Appendix A.
Target RA (ICRS) Dec. (ICRS) Distance (pc) ATCA Observing Date ALMA ID () HD 34282 05 16 00.48 -09 48 35.4 325 10/06/2018 2015.1.00192.S, 2017.1.01578.S SZ Cha 10 58 16.75 -77 17 17.2 189 03/05/2016 2013.1.00437.S CS Cha 11 02 24.89 -77 33 35.7 176 29/04/2016 2017.1.00969.S HP Cha 11 08 15.09 -77 33 53.2 160 22/05/2017 2017.1.01460.S HD 100453 11 33 05.58 -54 19 28.5 104 04/05/2016 2015.1.00192.S, 2017.1.01424.S HD 135344B 15 15 48.45 -37 09 16.0 135 13/05/2016 2017.1.00884.S HD 143006 15 58 36.91 -22 57 15.2 166 04/05/2017 2016.1.00484.L RY Lup 15 59 28.39 -40 21 51.3 159 06/05/2016 & 06/05/2017 2017.1.00449.S J1604 16 04 21.66 -21 30 28.4 145 23/04/2016 & 12/05/2017 2015.1.00888.S J1608 16 08 30.69 -38 28 26.9 156 22/04/2016 & 13/05/2017 2012.1.00761.S Sz111 16 08 54.68 -39 37 43.2 158 07/05/2016 & 06/05/2017 2012.1.00761.S SR24S 16 26 58.50 -24 45 36.7 114 17/05/2016 2017.1.00884.S SR21 16 27 10.28 -24 19 12.6 138 25/04/2016 2017.1.00884.S DoAr44 16 31 33.46 -24 27 37.2 120 24/04/2016 2012.1.00158.S HD 169142 18 24 29.78 -29 46 49.3 117 15/05/2016 2016.1.00344.S
2.2 ATCA
We used the ATCA radio telescope at 34 GHz (8.8 mm) to conduct our survey from 2016 to 2018 (project code C3119). The Compact Array Broadband Backend (CABB) (Wilson et al., 2011) provides observations with two bands that contain MHz channels, which we centred at 33 GHz and 35 GHz. Observations were conducted in the 6A array configuration which has baseline lengths ranging from 337 m to 5939 m and a theoretical resolution of . The synthesised beam for each observation is detailed in Table 3. The astrometric accuracy of ATCA observations is primarily determined by the atmospheric conditions and the properties of the phase calibrators. The weather during the observations varied for each science target, and the seeing monitor RMS path length noise for each observation is summarised in Table 2.
The science targets were observed with a sequence of 10 min on-source integration and 2 min integration of the gain/phase calibrator. The bandpass and flux calibrators were observed for 15 min and pointing checks were made on the phase calibrator every 60-90 min. All observational and calibration details are summarised in Table 2.
Date Obs. Time (min) Calibrators Ave. seeing rms () Band-pass Flux Gain/ Phase 22/04/16 225 1253-055 1934-638 1606-39 380 23/04/16 225 1253-055 1934-638 1622-253 388 24/04/16 430 1253-055 1934-638 1622-253 248 25/04/16 450 1253-055 1934-638 1622-253 152 29/04/16 430 0537-441 1934-638 1057-797 202 03/05/16 340 0537-441 1934-638 1057-797 308 04/05/16 450 0537-441 1934-638 1129-58 95 06/05/16 450 0537-441 1934-638 1606-39 155 07/05/16 450 1253-055 1934-638 1606-39 170 13/05/16 450 1253-055 1934-638 1451-400 99 15/05/16 450 1253-055 1934-638 1804-251 235 17/05/16 340 1253-055 1934-638 1622-310 300 04/05/17 430 1253-055 1934-638 1622-253 185 05/05/17 450 1253-055 1934-638 1606-39 114 06/05/17 430 1253-055 1934-638 1606-39 139 12/05/17 340 1253-055 1934-638 1622-253 236 13/05/17 430 1253-055 1934-638 1606-39 196 22/05/17 320 0537-441 1934-638 1057-797 313 10/06/18 450 1921-293 1934-638 0514-161 184 12/06/18 430 1253-055 1934-638 1817-254 218
The data was processed using the Miriad package (Sault et al., 1995) and followed the standard procedure outlined in Section 22 of the ATCA User Guide111https://www.atnf.csiro.au/computing/software/miriad/userguide/userhtml.html. Briefly, this involved: correcting for the frequency-dependent gain using the miriad task mfcal; then using the flux density of the ATCA primary flux calibrator, 1937-638, to re-scale the visibilities measured by the correlator using the miriad task mfcal with the option nopassol set; and correcting for the gain of the system’s time variable properties due to changing conditions using the miriad task gpcal. To reduce the noise in our data while maintaining as complete an observational track as possible, we flagged all data with a seeing monitor RMS path length noise above 400 m using uvflag, and calibrator amplitude readings that deviated more than 10% from the mean flux using blflag. Any unusual spikes seen in the channel vs. amplitude or the channel vs. phase plots were also flagged using uvflag.
We extracted the ATCA fluxes by first concatenating the 33 GHz and 35 GHz observations using the uvcat miriad task, subsequently producing observations centred at 34 GHz. We then used the fits miriad task to output the resulting uv data-set as a UVFITS file and binned the visibilities using python. The total integrated fluxes were taken at zero spacing (Table 3).
After calibrating the data, images at 34 GHz were produced using robust weighting of 0.5 for uniform weighting or a sup value of 0 for natural weighting with the invert task. The sup parameter refers to the area around the source (in arcseconds) where invert will attempt to suppress side-lobes. The dirty images were cleaned to (5 times the RMS noise level) using the clean task and the beam was restored using the restor task. The resulting images for 13 of the 14 detected sources are presented in Figure 2. The relatively poor seeing during the 3 May 2016 synthesis track of SZ Cha, coupled with the phase decorrelations in the visibilities, required data flagged that resulted in an unresolved image. We therefore exclude the image of SZ Cha and only present the flux determined during the period of best seeing in Table 3. Additionally, the 10 June 2018 synthesis track resulted in a non-detection of HD34282, likely a product of the low peak brightness due to its distance. As a result we only present the 3 upper limit in Table 3.
Target ATCA 34 GHz flux (mJy) ATCA rms (mJy) ATCA () ALMA freq. (GHz) ALMA flux (mJy) ALMA rms (mJy) ALMA () Spec. Slope () HD34282 <0.290a 0.125 3.0 x 0.38 255 99 0.10 0.06 x 0.05 2.74 SZ Cha 0.227 0.036 0.58 x 0.32 336 294 1.65 0.21 x 0.12 3.64 CS Cha 0.483 0.062 0.43 x 0.39 341 165 0.10 0.07 x 0.04 2.29 HP Cha 0.245 0.038 0.52 x 0.34 224 59.8 0.06 0.06 x 0.04 3.08 HD 100453 0.915 0.103 0.37 x 0.27 281 209 0.36 0.06 x 0.05 2.65 HD 135344B 0.324 0.044 1.2 x 0.31 336 574 0.16 0.09 x 0.08 3.06 HD 143006 0.143 0.028 0.87 x 0.25 238 54.6 0.02 0.07 x 0.06 2.78 RY Lup 0.348 0.042 0.46 x 0.27 350 280 0.14 0.08 x 0.06 3.59 J1604 0.146 0.028 1.8 x 0.32 227 81.3 0.11 0.07 x 0.06 3.04 J1608 0.198 0.029 0.85 x 0.34 335 119 0.42 0.1 x 0.09 2.79 Sz111 0.224 0.031 0.72 x 0.36 335 160 0.41 0.1 x 0.08 2.52 SR24S 0.811 0.102 0.533 x 0.154 108 30.8 0.06 0.07 x 0.04 2.60 SR21 0.123 0.105 1.2 x 0.35 336 332 0.08 0.09 x 0.07 3.42 DoAr44 0.333 0.047 1.2 x 0.35 336 172 0.08 0.09 x 0.08 2.10 HD 169142 0.905 0.103 0.66 x 0.25 225 173 0.05 0.07 x 0.04 2.86
Notes: aUpper limits are 3.
2.3 ALMA
The ALMA data for each source was selected from archival observations to both resolve the inner cavity of each transition disc and recover the largest spatial scales in the outer disc. The final calibrated visibilities for HD143006 were sourced from the DSHARP survey (Andrews et al., 2018). For all other discs, the highest resolution data was in ALMA bands 6 and 7 (1.3 and 0.88 mm, respectively), except for SR 24S, which has higher resolution observations in band 3 (3 mm). All ALMA data were reduced using the CASA pipeline for the appropriate ALMA cycle. Spectral lines in the ALMA data were flagged before extracting the continuum, which was time averaged to 30.5 s and a single channel per spectral window. ALMA visibilities were extracted using the exportuvfits in CASA and subsequently dealt with in python, with the total integrated fluxes taken at zero spacing listed in Table 3.
3 Modelling
We quantify the relative position of the emission in the ATCA and ALMA observations using the code Frankenstein (Jennings et al., 2020) to reconstruct the 1D radial brightness profiles of the disc at each wavelength. Frankenstein is an open source code that uses a Gaussian process to reconstruct the 1D radial brightness profile of a disc non-parametrically and can in principle measure radial features smaller than the clean beam size. We use an azimuthally symmetric brightness profile model despite known asymmetries in our sample as we are solely interested in obtaining the typical cavity radius for this exercise. This is especially true for ATCA observations with elongated beams, where the poor uv-coverage effectively results in different sensitivity and bias at baselines and a 1D fit of the north-south/east-west elongation. While we would ideally prefer to construct 2D models, such modelling is not feasible due to the low resolution of our ATCA observations.
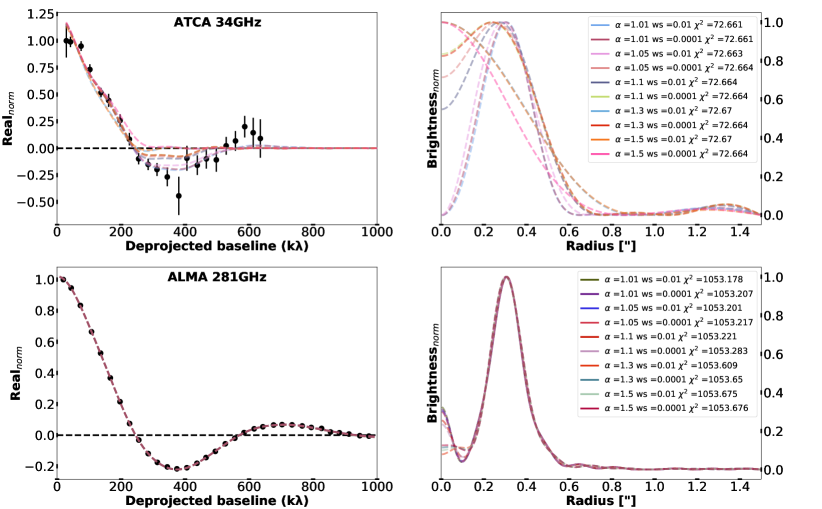
Frankenstein infers the brightness at a set of N radial points given a disc outer radius () and assuming azimuthal symmetry. It then fits the profile to observed visibilities by using the discrete Hankel transform (Baddour & Chouinard, 2015) to relate the observed visibilities to the radial brightness profile, applying a non-parametric Gaussian Process (GP) prior. The GP prior is learned from the data given two hyperparameters, and , and acts to dampen power in the reconstructed brightness profile on scales where the signal-to-noise in the visibilities is low. The most pertinent parameter is , which controls the signal-to-noise threshold below which Frankenstein does not attempt to fit the data. introduces a coupling between adjacent points and prevents regions of artificially low power arising from narrow gaps in the visibilities. For more details see Jennings et al. (2020). The brightness reconstruction is not overly sensitive to variations in . For our sample we set , , to either 0.01 or 0.0001, and vary between 1.01 and 1.5 and then select the model with the lowest value. However, if the data was sufficiently noisy at long baselines and the model was over-fitting, was increased until oscillations in the fit at long baselines disappeared. We constrained our fits to be non-negative. We include Figure 8 as an example of the fitting methodology using a variety of hyperparamaters with the resulting values. Discs are deprojected using the inclination and position angle from high-resolution observations (see Table 4). We restrict our modelling to sources with , limiting the number of sources in our sample that we model to CS Cha, HPCha, HD100453, HD135344B, RY Lup, J1608, Sz111, SR24S, DoAr44, and HD169142.
4 Results
4.1 ATCA Continuum Emission
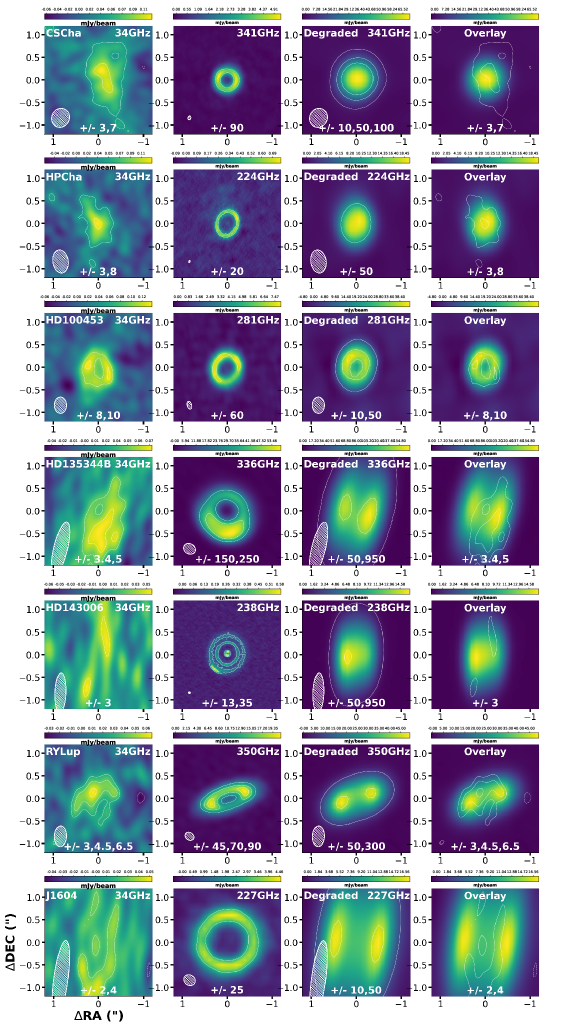
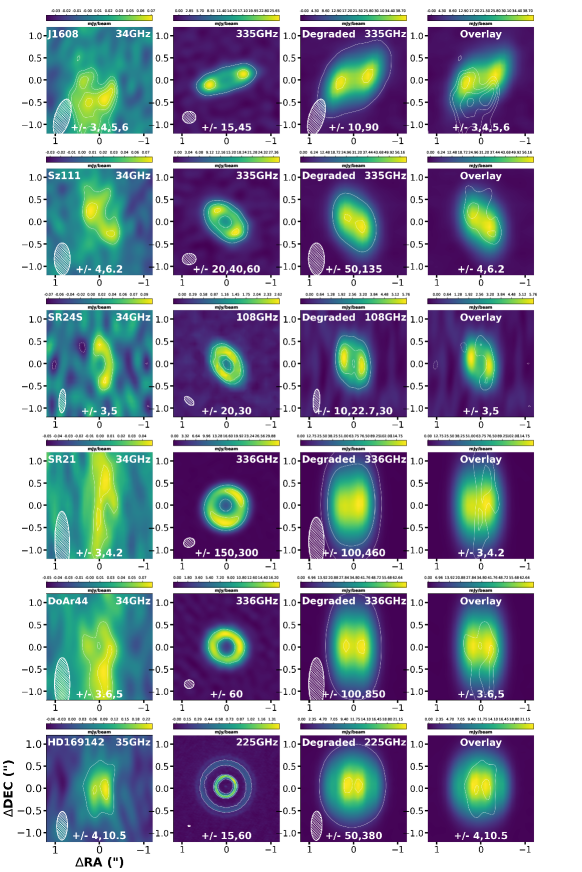
We detected 14 out of the 15 discs from the survey with ATCA. HD34282 was the only non-detection and we present the flux upper limit in Table 3. We spatially resolved the continuum emission of disc-like structures for 13 sources and show the CLEANed maps in Figure 2. A deficit of emission is visible in the inner regions of HD100453, HD135344B, RY Lup, J1608, Sz111, SR24S, DoAr44, and HD169142. This can be representative of a ring-like structure in the 8.8 mm grains of these discs assuming the bulk of the emission is from thermal dust. J1604 and SR21 also appear to exhibit a deficit of central emission, but due to the low SNR for both observations this is uncertain. The structure seen in the emission of HD135344B, RY Lup, J1604, J1608, and SR24S hints at asymmetrical dust structure which is expected to become more pronounced at longer wavelengths (Birnstiel et al., 2013; van der Marel et al., 2020). However for RY Lup this morphology is due to the disc being approximately edge-on (Ansdell et al., 2016; Langlois et al., 2018). The possible asymmetries in HD135344B and J1604 can not be confirmed due to the significant beam elongation, but it seems likely for HD135344B given the dust asymmetry in ALMA (van der Marel et al., 2016b). The observations of HP Cha, HD135344B, HD143006, J1604, and SR21 all suffered from a variety of poor weather conditions that required significant data flagging, resulting in sparse uv-coverage and low SNR. This makes it difficult to directly compare disc structures in the ATCA and ALMA continuum maps for these sources.
4.2 ALMA Degraded Continuum Emission
In extended configurations of the 12-m array, ALMA has a resolutions range from at 230 GHz to at 110 GHz. To facilitate comparison between the ATCA and ALMA observations, we degrade the resolution of the ALMA observations to match that of the corresponding ATCA map using the restoringbeam option in the tclean task in CASA (c.f. column 4 of Table 3 and column 3 of Figure 2).
The degraded ALMA continuum maps generally present morphology similar to the ATCA continuum maps. Two symmetric intensity peaks can be seen in the degraded ALMA images that align, within reasonable radial positional accuracy, for HD100453, RY Lup, J1608, Sz111, SR21, DoAr44, and HD169142. The degraded ALMA maps for HD143006 and J1604 show morphology indicative of an inner cavity and ring-like structure. However, this is not reflected in the corresponding ATCA observations due to either the poor observing conditions or the lack of this structure in the 8.8 mm emission. For CS Cha and HP Cha, the degraded continuum maps exhibit elliptical structures similar to the corresponding ATCA observations. This suggests that any structure at 8.8 mm is not resolved by the clean reconstructed images. HD135344B exhibits two asymmetric intensity peaks indicative of its true asymmetric structure.
4.3 Visibilities and Brightness Profiles
4.3.1 ATCA Phase Centering
We estimate the phase centre of the ATCA observations where possible by centering the image to the apparent centre in the ring, which is taken as the central deficit of emission, for about half of the sample (HD100453, HD135344B, RY Lup, J1608, Sz111, SR24S, DoAr44, and HD169142). For CS Cha, the phase centre is taken as the stellar position correct by Gaia proper motions. HD135344B is known to be asymmetric (van der Marel et al., 2016b), the position of central emission deficit closely corresponds to the orbital radius of the vortex derived by Cazzoletti et al. (2018) (81 au). For HP Cha this comparison could not be made as it was too faint for Gaia to measure its proper motion. These phase centres are consistent () with the proper motion corrected Gaia positions and the accuracy is likely a function of the beam size, which can be worse in the north-south/east-west direction for sources with extended beams (e.g. the poor north-south accuracy for DoAr44). Offsets are similar to the astrometric accuracy seen in previous ATCA observations (Wright et al., 2015).
The typical offsets of the phase centre () are comparable to the cavity size of our transition discs. This directly impacts the Frankenstein 1D radial brightness models, in particular for sources where the 8.8 mm continuum map does not resolve an inner cavity with a ring of emission but exhibits asymmetrical structure. This means that the sources that appear centrally peaked rather than ring-like (CS Cha and HP Cha) might be asymmetric as well at 8.8 mm. Figure 9 highlights the effects on the 1D brightness models of RY Lup when moving the phase centre, and cautions the interpretation of these models for sources that are possibly asymmetric (HP Cha, HD135344B, RY Lup, J1608, SR24S, and DoAr44) with relatively large beam sizes ().
4.3.2 Multi-Wavelength Comparison
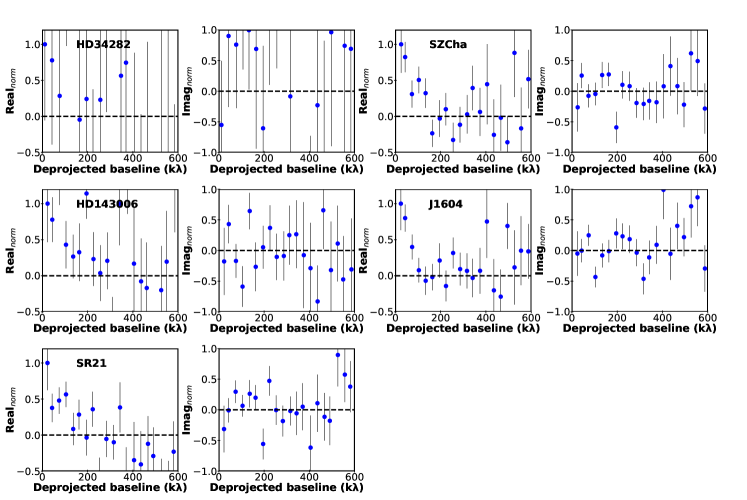
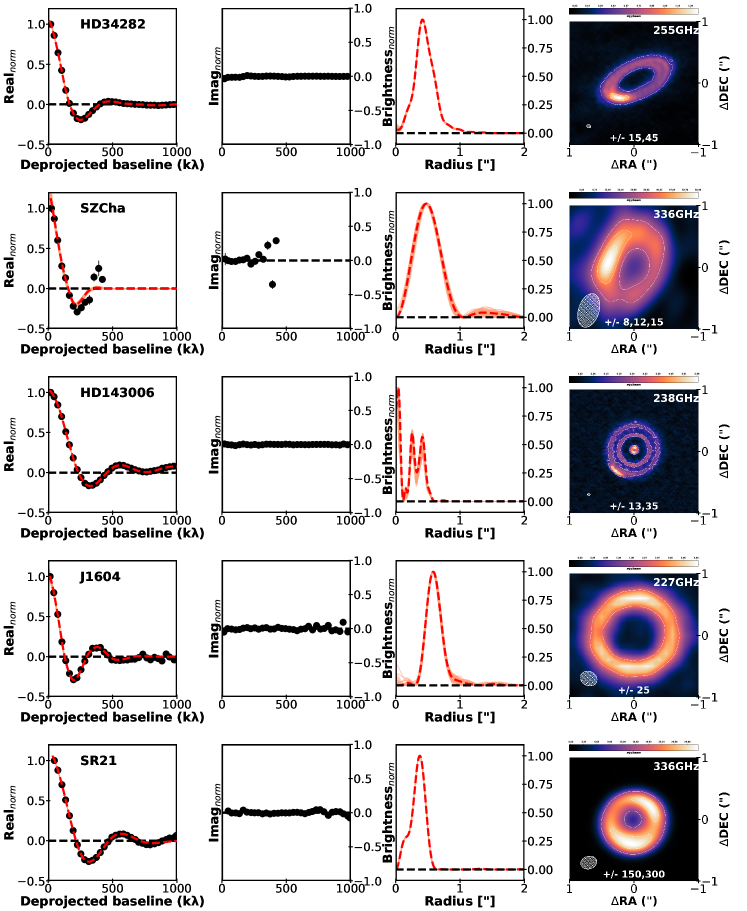
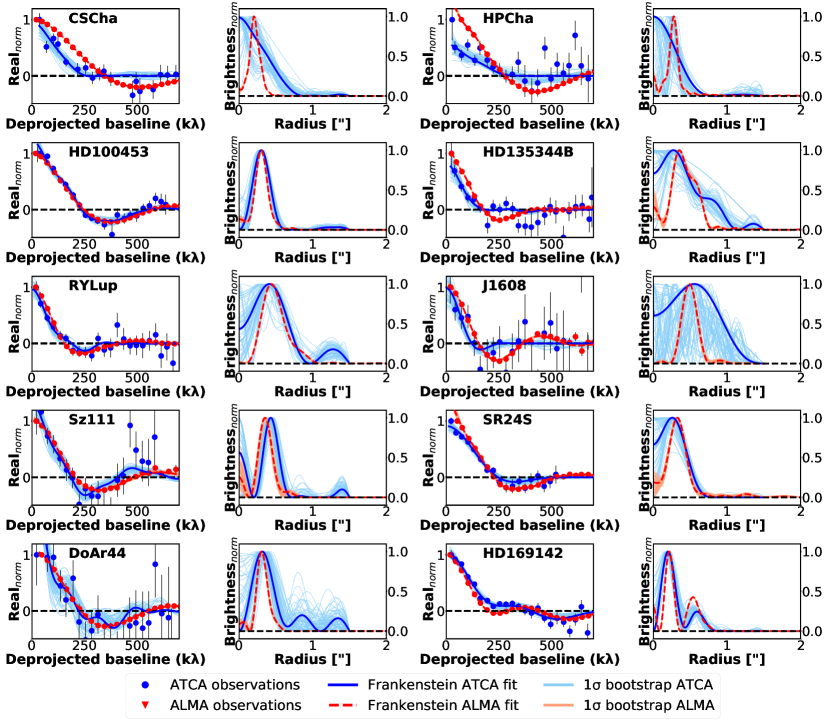
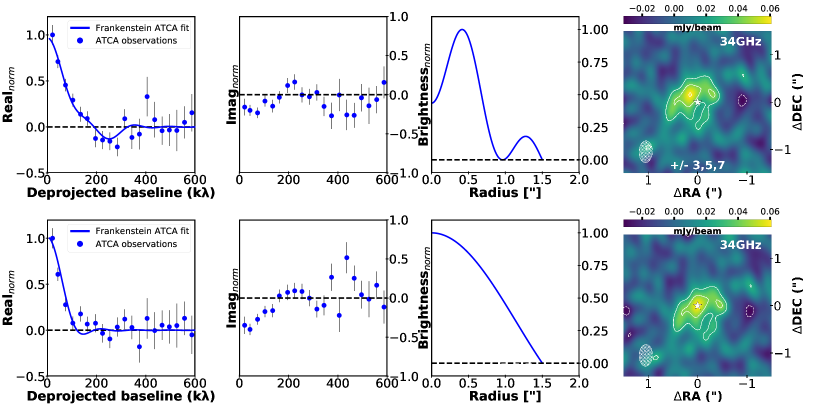
We present the real component of the deprojected ATCA and ALMA visibilities in Figure 3, adopting the inclination and position angle for each source from high-resolution observations (see Table 4). The imaginary components of the visibilities are presented in Figure 10. We also present in Figure 3 the Frankenstein reconstructed brightness profiles for the majority (10/15) of our sample and Table 4 includes the radial offsets for the peak (col.2 and 3), of the Frankenstein fits. Errors in the Frankenstein fit for sources with resolved features (e.g. a Gaussian peak) are calculated via the bootstrap method. This involves fitting the disc geometry as defined by the inclination and position angle, and calculating the model numerous times using different sub-samples of the data. The bootstrap method effectively tests the ’goodness’ of a fits chosen geometry and hyperparameters. As a result, if the data has a relatively high SNR and the choice of hyper-parameters is correct, sub-samples of the data will always reproduce approximately the same fit. This is apparent in our ALMA visibility fits where the error is of the values. For further details on the bootstrap method in Frankenstein see Jennings et al. (2020). We take the uncertainty in the values as the combination of the standard deviation of our bootstrap models and the full width half maximum of the observational beam size. For sources with unresolved features, calculating and the fwhm is not possible, and the results for these sources are omitted from Table 4. We include radial offsets from previous visibility fits in the literature and note that our values are comparable (see Table 4, col.4). The visibilities for ATCA observations that were not modelled with Frankenstein (HD34282, SZ Cha, HD143006, J1604, and SR21) and the corresponding ALMA visibilities with Frankenstein fits are included in Appendix E.
Our multi-wavelength visibility comparison shown in Figure 3 suggests that the 8.8 mm and sub-mm disc structures share a similar cavity size for HD100453, HD135344B, RY Lup, J1608, Sz111, SR24S, DoAr44, HD169142. This is indicated by the similar location of the null seen in the visibility data and similar radial positions of the Gaussian ring peak seen in the Frankenstein reconstructed 1D brightness profiles. For CS Cha and HP Cha the 1D radial brightness profiles suggest that the 8.8 mm and sub-mm do not share a similar cavity size. For these sources, it is clear that the noise is larger than the correlated flux of the negative part in the ALMA data. It is unlikely that the Frankenstein fit for low SNR at long baselines could resolve a cavity if one is indeed present. The ATCA 1D radial brightness profiles of HD100453, HD135344B, RY Lup, J1608, Sz111, SR24S, and DoAr44 show an inner deficit of emission consistent with Figure 2. For the ATCA data of HD169142 the Frankenstein fit is able to reproduce the two rings seen in the ALMA image that is not resolved in the ATCA image in Figure 2, this is attributed to Frankenstein’s ability to resolve angular scales smaller than the uniform-weighted clean beam for sources with relatively low SNR at long baselines. All of the ALMA radial brightness profiles indicate a ring-like structure, as also shown in Figure 2.
.
Source ATCA obs (") ALMA obs (") (") (") (") () () Ref. (a,b,c,d) CS Cha <0.390u - 0.102 - 8 161 -, 8, -, 5 HP Cha <0.340u - - - 37 164 -, -, -, 6 HD100453 0.184 - 29.5 151 3, 9, -, 3 HD135344B 0.363 0.292 17.7 62 1, 10, 16, 6 RY Lup - 0.286 68 109 1, -, 14, 7 J1608 0.288 0.300 -74 107 1, 11, 14, 8 Sz111 - 0.225 -53 40 1, -, 14, 7 SR24S - - 46 25 4, -, -, 1 DoAr44 0.123 0.146 20 30 1, 12, 16, 1 HD169142 , , , 0.118 0.121 13 5 2, 13, 15, 2 * * * - -
Notes: u Upper limits are taken as the maximum cavity size (if a cavity exists) from the error for each source in Figure 5.
*Second peak.
References (1) Pinilla
et al. (2018), (2) Fedele
et al. (2017), (3) van der Plas
et al. (2019), (4) Pinilla
et al. (2017), (5) Francis &
van der Marel (2020) (6) Cazzoletti
et al. (2018), (7) Ansdell
et al. (2018), (8) Ginski
et al. (2018), (9) Benisty
et al. (2017), (10) Stolker
et al. (2017), (11) Villenave
et al. (2019), (12) Casassus
et al. (2018), (13) Birchall
et al. (2019), (14) van der Marel
et al. (2018), (15) Carney
et al. (2018), (16) van der
Marel et al. (2016a).
4.4 The Spectral Slope
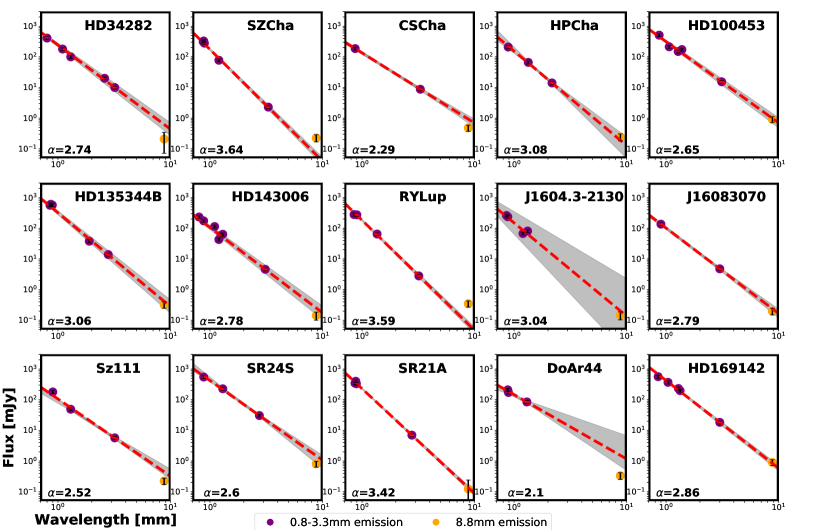
In our multi-wavelength comparison we have assumed that the 8.8 mm emission is primarily from thermal dust, which should be tested. Figure 4 shows the spectral slope between 0.8 mm and 1 cm for sources with sufficient flux measurements between 0.8–3.3 mm for a linear least-squares fit (in log-log space). We include a calibration uncertainty of 10% for ALMA data and 20% for ATCA data. Figure 4 shows that for the majority of our sources the 8.8 mm emission falls within the fitted error, indicating that the emission is likely due to thermal dust emission from large grains. For SZ Cha and RY Lup, we see excess emission above that of thermal dust, which is likely due to free-free emission. The lack of publicly available ALMA Band 3 data for J1604 and DoAr44 result in large error bands in the spectral slope. In Table 3 we include the spectral slope () calculated from our linear least-squares fit. The spectral indices for our sample range from . This is consistent with a distribution of large grains (Natta & Testi, 2004; Draine, 2006).
5 Discussion
5.1 Other Sources of Emission
Continuum emission at millimetre wavelengths from discs around young stars often show excess emission above that expected from a simple extrapolation of thermal dust emission observed at shorter mm wavelengths (Rodmann et al., 2006; Lommen et al., 2009; Ubach et al., 2012, 2017). This excess has been attributed to thermal free-free emission from an ionised wind, non-thermal processes such as chromospheric emission from the young stellar object, or a combination of both (Dullemond et al., 2007; Millan-Gabet et al., 2007). For thermal free-free emission, the total integrated flux can vary by a factor of % over a long period, while for non-thermal emission the total integrated flux can vary by up to a factor on very shorter times scales (minutes to hours) (Ubach et al., 2012). In our sample, only SZ Cha and RY Lup show an excess in emission above that expected from thermal dust. This excess is less than 40% of the total integrated flux and is likely due to free-free emission. However, further observations at mm-wavelengths over a range of candences are required to confirm this. Previous temporal flux monitoring by Ubach et al. (2012) also found that RY Lup exhibits excess emission. Free-free emission has been observed in a number of other transition discs not in our sample, including HD97048 (van der Plas et al., 2017a), HD142527 (Casassus et al., 2015), and HD100546 (Wright et al., 2015). We expect the emission from the bulk of our sample to indeed be due to thermal dust, and hence the emission comparison with ALMA emission is likely a dust-to-dust comparison.
5.2 Dust Traps and Cavity Formation
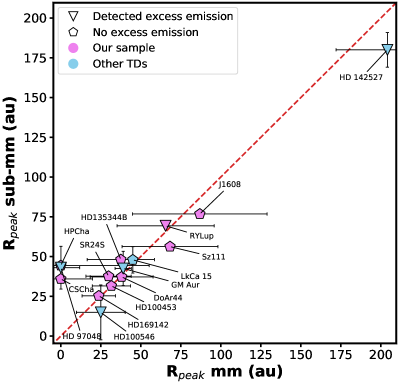
The 1D radial brightness profile models derived by Frankenstein highlight that the majority of our sample (HD100453, HD135344B, RY Lup, J1608, Sz111, SR24S, DoAr44, and HD169142) share a similar in both the ATCA and ALMA data. The models exhibit a Gaussian ring fit indicative of a resolved inner cavity in Fourier space that is likely due to the concentration of grains in dust traps and hence, we take as representative cavity size. Neither CS Cha or HP Cha share similar values between the ATCA and ALMA data. For these sources, the ATCA 1D radial brightness profiles suggest a disc without an inner deficit of emission, and the ALMA fits suggest a ring-like morphology. As a result, if we plot (ALMA) versus (ATCA) (see Figure 5), our sample of transition discs can be classified into two groups: sources with similar values and those which only show a cavity in the ALMA data. Sources in the first group from our sample include HD100453, HD135344B, RY Lup, J1608, Sz111, SR24S, DoAr44, and HD169142. Other transitions discs in the literature which exhibit an approximately one-to-one correlation between the 8.8 mm and sub-mm values include HD100546 (Wright et al., 2015; Pinilla et al., 2018), GM Aur (Macías et al., 2018), LkCa15 (Isella et al., 2014; Pinilla et al., 2018), and HD142527 (Casassus et al., 2015). The second group includes CS Cha and HP Cha from our sample, and HD97048 from van der Plas et al. (2017a). For the purposes of this paper, group 1 sources will be labelled resolved cavity transition discs (RC-TDs) and group 2 sources will be labelled non-detected cavity transition discs (NC-TDs).
The non-detection of cavities at 8.8 mm for the NC-TDs can reflect the lack of a cavity in the large grain population, but could also be due to large asymmetric structure resulting in either a poor model fit or inaccurate phase centering, unresolved features due to spatial resolution limitations, or the presence of other sources of emission obscuring disc features as suggested by van der Plas et al. (2017a) for HD97048. The emission for CS Cha and HP Cha appears to be dominated by thermal dust (see Figure 4). Due to the lack of proper motions and the astrometric uncertainty of ATCA, it is possible that the emission of HP Cha is asymmetric and the chosen phase centre is incorrect (e.g. see Figure 9), as asymmetries are expected to become more pronounced or even only revealed at longer wavelengths (Birnstiel et al., 2013; van der Marel et al., 2020). However, it is equally likely, given the low spatial resolution of the ATCA observations, that a cavity exists for CS Cha and HP Cha but remains unresolved. Using Frankenstein to fit low SNR visibilities will result in poor fits not representative of the true disc features. As a result, the presence of a cavity at 8.8 mm cannot be confirmed for CS Cha and HP Cha, and more observations are required.
The exact mechanism driving large cavity formation in transition discs remains unknown (Williams & Cieza, 2011). However historically the observed deficit of inner disc emission has been attributed to either grain growth, photoevaporation, or the trapping of dust due to either dead zones or the dynamical interaction with a companion. Grain growth models (Laibe et al., 2008; Birnstiel et al., 2012b; Gonzalez et al., 2015) predict, due to the settling, growth, and inward drift of grains, that the disc will contain a size-sorted radial distribution of dust, with larger grains preferentially concentrated towards the mid-plane and host star. Previous reviews of photoevaporative models (Ercolano & Pascucci, 2017) conclude that the deficit of inner emission seen in transition discs with large cavities () and mass accretion rates cannot be attributed entirely to photoevaporation. Therefore, we suggest that neither grain growth nor photoevaporation are likely to be dominating the grain evolution in our RC-TD sources. Our sample does not show evidence of radial size sorting (Figure 2), exhibit large cavities (Figure 5), and the majority have modest levels of accretion (Table 1).
Magnetohydrodynamical (MHD) models of transition discs from Pinilla et al. (2016) predict a factor of 2 difference in the radial peak positions for sub-mm to mm grains at dust traps located at the edge of dead zones (see Figure 4 at 1Myr in Pinilla et al., 2016) which is excluded by our one-to-one correlation seen in Figure 5. Additionally, MHD models require a high turbulence viscosity coefficient () in active regions of the disc (Pinilla et al., 2016; Ueda et al., 2019), which is inconsistent with observations of classical protoplanetary discs (e.g. from Pinte et al., 2016; Flaherty et al., 2020) and previous studies of transition discs that model how inner companions influence cavity formation (Dong et al., 2017; Toci et al., 2020). Dong et al. (2017) showed with hydrodynamical simulations and radiative transfer models that the turbulence viscosity coefficient for HD169142 had to be lower than for a single planet to form two distinct ring that agreed with the observations. However Toci et al. (2020), using a similar procedure but with two planets, were able to reproduce the two observed rings with . Turbulence in the active regions of transition discs may not be well enough constrained to reach a firm conclusion regarding its role in cavity formation.
The dynamical interaction with a companion is proposed to be the driving force behind most features seen in transition discs including the formations of dust traps. For our RC-TDs, van der Marel et al. (2015a); van der Marel et al. (2016a); van der Marel et al. (2018) showed gas cavities inside dust cavities for SR21, HD135344B, DoAr44, J1604, Sz111, J16083070. van der Plas et al. (2019) utilised SPH and radiative transfer codes to show some disc features seen in HD100453 can be attributed to an undetected, low mass close companion within the disc’s cavity. The study of HD100453 is further refined by Gonzalez et al. (2020) and Nealon et al. (2020), who show that while the outer disc morphology can be caused by a companion star on an inclined orbit exterior to the disc, the inner cavity can be explained by a MJ planet, less massive than previously suggested (van der Plas et al., 2019), at 15-20 au. Using similar 1D radial brightness profiles for the majority of our sources (HD135344B, RY Lup, J1608, Sz111, SR24S, and DoAr44), Pinilla et al. (2017) and Pinilla et al. (2018) suggest that the clearing of the inner cavity could be attributed to the dynamical interaction with an embedded planet. For HD169142, Fedele et al. (2017) uses a thermo-chemical code to model the gas and dust distribution. Their results suggest that dynamical interaction between the disc and two giant embedded planets results in the depletion of the inner disc, and creates two pressure bumps that aid in the trapping of dust at each observable ring position. It still remains unclear for the majority of transition discs if a companion is indeed responsible for the formation of the cavity, whether this companion is an embedded planet or a binary star. What is notable about our sample is that for the RC-TDs the 8.8 mm and sub-mm grains share a similar cavity size ( value). This is also seen in SR24S and HD142527 (included in Figure 5). Pinilla et al. (2019) presents a planet-disc model for SR24S that predicts both mm and sub-mm grains will share a similar radial peak in the dust density. Price et al. (2018) extensively modelled HD142527 with 3D hydrodynamical simulations considering several possible orbits for the M-dwarf binary companion presented in Lacour et al. (2016). They conclude that all the observable disc features can be attributed to the tidal truncation of the disc from the binary companion. Given that our RC-TDs and HD142527 follow the one-to-one correlation shown in Figure 5, we suggest similar physical mechanisms affecting the grain evolution for these discs may have occurred.
We include in Table 4 the IR and values where possible for our sample. The IR and values are consistently smaller than the corresponding ATCA/ALMA values, and for sources with both IR and observations, the respective values are similar. The discrepancy between the ATCA and ALMA versus IR and values was originally classified as the "missing cavities" problem by Dong et al. (2012). With ATCA and ALMA observations tracing large dust grains (sub-mm to mm sizes) and IR observations tracing small dust grains ( sizes) our comparison is in agreement with dust evolution models which show large dust grains accumulate at pressure maxima (dust traps), while smaller dust grains are coupled to the gas and follow the accretion flow into the inner disc (Birnstiel et al., 2012a; Pinilla et al., 2012; Zhu et al., 2012).
6 Conclusions
In this work we present the largest 8.8 mm continuum survey to date of transition discs with large cavities, and compare the resulting dust emission to ALMA observations.
-
1.
For the 15 discs observed with ATCA, 14 were detected, 13 were spatially resolved, and 8 exhibited morphology indicative of ring-like structure.
-
2.
The spectral slopes indicate that the emission is dominated by thermal dust for most sources, suggesting the ATCA emission is tracing the large grain population. Only SZ Cha and RY Lup showed excess emission above that from thermal dust emission.
-
3.
We use the Frankenstein code to model 1D radial brightness profiles, which reveal that both the 8.8 mm ATCA and sub-mm ALMA emission in most of the discs share a similar radial position of the peak brightness, , suggesting a similar cavity size.
-
4.
The values for the millimetre and sub-mm data is consistently larger than the corresponding IR and values. This is in agreement with models indicating large grains preferentially concentrating at maxima in the gas pressure, whilst small -sized grains are coupled to the gas.
-
5.
We suggest that the large cavities in these transition discs result from a dust trap, likely induced by a companion.
Acknowledgements
The authors thank the referee for their constructive comments and suggestions. We thank Mathew Agnew and Elodie Thilliez for useful discussions with our ATCA observing proposal. B.J.N is supported by an Australian Government Research Training Program (RTP) Scholarship. CP acknowledges funding from the Australian Research Council via grants FT170100040 and DP180104235. N.M. acknowledges support from the Banting Postdoctoral Fellowships program, administered by the Government of Canada. RAB acknowledges support from the STFC consolidated grant ST/S000623/1. This work has also been supported by the European Union’s Horizon 2020 research and innovation programme under the Marie Sklodowska-Curie grant agreement No 823823 (DUSTBUSTERS). J.-F.G. acknowledges funding from ANR (Agence Nationale de la Recherche) of France under contract number ANR-16-CE31-0013 (Planet-Forming-) and thank the LABEX Lyon Institute of Origins (ANR-10-LABX-0066) of the Université de Lyon for its financial support within the programme ‘Investissements d’Avenir’ (ANR-11-IDEX-0007) of the French government operated by the ANR. C. M. Wright acknowledges financial support from the Australian Research Council via Future Fellowship FT100100495. The Australia Telescope Compact Array is part of the Australia Telescope which is funded by the Commonwealth of Australia for operation as a National Facility managed by CSIRO. This research has made use of NASA’s Astrophysics Data System. The National Radio Astronomy Observatory is a facility of the National Science Foundation operated under agreement by the Associated Universities, Inc. ALMA is a partnership of ESO (representing its member states), NSF (USA) and NINS (Japan), together with NRC (Canada) and NSC and ASIAA (Taiwan) and KASI (Republic of Korea), in cooperation with the Republic of Chile. The Joint ALMA Observatory is operated by ESO, AUI/ NRAO and NAOJ. This paper makes use of the following ALMA data: ADS/JAO.ALMA#2012.1.00158.S, ADS/JAO.ALMA#2012.1.00761.S, ADS/JAO.ALMA#2013.1.00437.S, ADS/JAO.ALMA#2015.1.00192.S, ADS/JAO.ALMA#2015.1.00888.S, ADS/JAO.ALMA#2015.1.01353.S, ADS/JAO.ALMA#2016.1.00344.S, ADS/JAO.ALMA#2016.1.00484.L, ADS/JAO.ALMA#2017.1.00449.S, ADS/JAO.ALMA#2017.1.00884.S, ADS/JAO.ALMA#2017.1.00969.S, ADS/JAO.ALMA#2017.1.01424.S, ADS/JAO.ALMA#2017.1.01460.S
This work makes use of the following software: The Miriad package (Sault et al., 1995), the Common Astronomy Software Applications (CASA) package (McMullin et al., 2007), Python version 3.7, astropy (Astropy Collaboration et al., 2013), matplotlib (Hunter, 2007), and Frankenstein (Jennings et al., 2020).
Data Availability
The ATCA observational data used in this paper is available from the Australian National Telescope Facility Archive at https://atoa.atnf.csiro.au/ under project code C3119. The ALMA observational data is available from the ALMA science archive at https://almascience.nrao.edu/aq/ under the project IDs listed in Table 1. 1D radial brightness models used the Frankenstein code which is available from https://github.com/discsim/frank. Reduced observation data and models will be shared on reasonable request to the corresponding author.
References
- Alcalá et al. (2017) Alcalá J. M., et al., 2017, A&A, 600, A20
- Alexander et al. (2006) Alexander R. D., Clarke C. J., Pringle J. E., 2006, MNRAS, 369, 229
- Andrews et al. (2011) Andrews S. M., Wilner D. J., Espaillat C., Hughes A. M., Dullemond C. P., McClure M. K., Qi C., Brown J. M., 2011, ApJ, 732, 42
- Andrews et al. (2018) Andrews S. M., et al., 2018, ApJ, 869, L41
- Ansdell et al. (2016) Ansdell M., et al., 2016, ApJ, 828, 46
- Ansdell et al. (2018) Ansdell M., et al., 2018, ApJ, 859, 21
- Astropy Collaboration et al. (2013) Astropy Collaboration et al., 2013, A&A, 558, A33
- Baddour & Chouinard (2015) Baddour N., Chouinard U., 2015, Journal of the Optical Society of America A, 32, 611
- Benisty et al. (2017) Benisty M., et al., 2017, A&A, 597, A42
- Birchall et al. (2019) Birchall E. K., et al., 2019, MNRAS, 486, 3721
- Birnstiel et al. (2012a) Birnstiel T., Klahr H., Ercolano B., 2012a, A&A, 539, A148
- Birnstiel et al. (2012b) Birnstiel T., Andrews S. M., Ercolano B., 2012b, A&A, 544, A79
- Birnstiel et al. (2013) Birnstiel T., Dullemond C. P., Pinilla P., 2013, A&A, 550, L8
- Brauer et al. (2007) Brauer F., Dullemond C. P., Johansen A., Henning T., Klahr H., Natta A., 2007, A&A, 469, 1169
- Brown et al. (2009) Brown J. M., Blake G. A., Qi C., Dullemond C. P., Wilner D. J., Williams J. P., 2009, ApJ, 704, 496
- Carney et al. (2018) Carney M. T., et al., 2018, A&A, 614, A106
- Casassus et al. (2015) Casassus S., et al., 2015, ApJ, 812, 126
- Casassus et al. (2018) Casassus S., et al., 2018, MNRAS, 477, 5104
- Cazzoletti et al. (2018) Cazzoletti P., et al., 2018, A&A, 619, A161
- Clarke et al. (2001) Clarke C. J., Gendrin A., Sotomayor M., 2001, MNRAS, 328, 485
- Dent et al. (2006) Dent W. R. F., Torrelles J. M., Osorio M., Calvet N., Anglada G., 2006, Monthly Notices of the Royal Astronomical Society, 365, 1283
- Dong et al. (2012) Dong R., et al., 2012, ApJ, 750, 161
- Dong et al. (2017) Dong R., Li S., Chiang E., Li H., 2017, ApJ, 843, 127
- Draine (2006) Draine B. T., 2006, ApJ, 636, 1114
- Dullemond et al. (2007) Dullemond C. P., Hollenbach D., Kamp I., D’Alessio P., 2007, in Reipurth B., Jewitt D., Keil K., eds, Protostars and Planets V. p. 555 (arXiv:astro-ph/0602619)
- Ercolano & Pascucci (2017) Ercolano B., Pascucci I., 2017, Royal Society Open Science, 4, 170114
- Ercolano et al. (2018) Ercolano B., Weber M. L., Owen J. E., 2018, MNRAS, 473, L64
- Espaillat et al. (2014) Espaillat C., et al., 2014, in Beuther H., Klessen R. S., Dullemond C. P., Henning T., eds, Protostars and Planets VI. p. 497 (arXiv:1402.7103), doi:10.2458/azu_uapress_9780816531240-ch022
- Fedele et al. (2017) Fedele D., et al., 2017, A&A, 600, A72
- Flaherty et al. (2020) Flaherty K., et al., 2020, ApJ, 895, 109
- Flock et al. (2015) Flock M., Ruge J. P., Dzyurkevich N., Henning T., Klahr H., Wolf S., 2015, A&A, 574, A68
- Fouchet et al. (2007) Fouchet L., Maddison S. T., Gonzalez J. F., Murray J. R., 2007, A&A, 474, 1037
- Fouchet et al. (2010) Fouchet L., Gonzalez J. F., Maddison S. T., 2010, A&A, 518, A16
- Francis & van der Marel (2020) Francis L., van der Marel N., 2020, ApJ, 892, 111
- Gaia Collaboration (2018) Gaia Collaboration 2018, VizieR Online Data Catalog, p. I/345
- Garg et al. (2020) Garg H., et al., 2020, arXiv e-prints, p. arXiv:2010.15310
- Ginski et al. (2018) Ginski C., et al., 2018, A&A, 616, A79
- Gonzalez et al. (2015) Gonzalez J. F., Laibe G., Maddison S. T., Pinte C., Ménard F., 2015, Planet. Space Sci., 116, 48
- Gonzalez et al. (2020) Gonzalez J.-F., et al., 2020, MNRAS, submitted
- Gorti et al. (2015) Gorti U., Hollenbach D., Dullemond C. P., 2015, ApJ, 804, 29
- Hollenbach et al. (1994) Hollenbach D., Johnstone D., Lizano S., Shu F., 1994, ApJ, 428, 654
- Hunter (2007) Hunter J. D., 2007, Computing in Science & Engineering, 9, 90
- Isella et al. (2014) Isella A., Chandler C. J., Carpenter J. M., Pérez L. M., Ricci L., 2014, ApJ, 788, 129
- Isella et al. (2018) Isella A., et al., 2018, The Astrophysical Journal, 869, L49
- Jennings et al. (2020) Jennings J., Booth R. A., Tazzari M., Rosotti G. P., Clarke C. J., 2020, arXiv e-prints, p. arXiv:2005.07709
- Lacour et al. (2016) Lacour S., et al., 2016, A&A, 590, A90
- Laibe et al. (2008) Laibe G., Gonzalez J. F., Fouchet L., Maddison S. T., 2008, A&A, 487, 265
- Langlois et al. (2018) Langlois M., et al., 2018, A&A, 614, A88
- Lin & Papaloizou (1979) Lin D. N. C., Papaloizou J., 1979, MNRAS, 188, 191
- Lommen et al. (2009) Lommen D., Maddison S. T., Wright C. M., van Dishoeck E. F., Wilner D. J., Bourke T. L., 2009, Astronomy and Astrophysics, 495, 869
- Lommen et al. (2010) Lommen D. J. P., et al., 2010, Astronomy and Astrophysics, 515, A77
- Macías et al. (2018) Macías E., et al., 2018, ApJ, 865, 37
- Manara et al. (2014) Manara C. F., Testi L., Natta A., Rosotti G., Benisty M., Ercolano B., Ricci L., 2014, A&A, 568, A18
- Manara et al. (2019) Manara C. F., Mordasini C., Testi L., Williams J. P., Miotello A., Lodato G., Emsenhuber A., 2019, A&A, 631, L2
- Manara et al. (2020) Manara C. F., et al., 2020, A&A, 639, A58
- McMullin et al. (2007) McMullin J. P., Waters B., Schiebel D., Young W., Golap K., 2007, CASA Architecture and Applications. p. 127
- Millan-Gabet et al. (2007) Millan-Gabet R., Malbet F., Akeson R., Leinert C., Monnier J., Waters R., 2007, in Reipurth B., Jewitt D., Keil K., eds, Protostars and Planets V. p. 539 (arXiv:astro-ph/0603554)
- Natta & Testi (2004) Natta A., Testi L., 2004, in Johnstone D., Adams F. C., Lin D. N. C., Neufeeld D. A., Ostriker E. C., eds, Astronomical Society of the Pacific Conference Series Vol. 323, Star Formation in the Interstellar Medium: In Honor of David Hollenbach. p. 279
- Nealon et al. (2020) Nealon R., Cuello N., Gonzalez J.-F., van der Plas G., Pinte C., Alexander R., Ménard F., Price D. J., 2020, MNRAS, accepted
- Owen & Clarke (2012) Owen J. E., Clarke C. J., 2012, MNRAS, 426, L96
- Owen et al. (2017) Owen J. E., Ercolano B., Clarke C. J., 2017, MNRAS, 472, 2955
- Paardekooper & Mellema (2004) Paardekooper S. J., Mellema G., 2004, A&A, 425, L9
- Pinilla et al. (2012) Pinilla P., Benisty M., Birnstiel T., 2012, A&A, 545, A81
- Pinilla et al. (2016) Pinilla P., Flock M., Ovelar M. d. J., Birnstiel T., 2016, A&A, 596, A81
- Pinilla et al. (2017) Pinilla P., et al., 2017, ApJ, 839, 99
- Pinilla et al. (2018) Pinilla P., et al., 2018, ApJ, 859, 32
- Pinilla et al. (2019) Pinilla P., Benisty M., Cazzoletti P., Harsono D., Pérez L. M., Tazzari M., 2019, ApJ, 878, 16
- Pinte et al. (2016) Pinte C., Dent W. R. F., Ménard F., Hales A., Hill T., Cortes P., de Gregorio-Monsalvo I., 2016, ApJ, 816, 25
- Price et al. (2018) Price D. J., et al., 2018, MNRAS, 477, 1270
- Rice et al. (2006) Rice W. K. M., Armitage P. J., Wood K., Lodato G., 2006, MNRAS, 373, 1619
- Rodmann et al. (2006) Rodmann J., Henning T., Chandler C. J., Mundy L. G., Wilner D. J., 2006, A&A, 446, 211
- Ruge et al. (2016) Ruge J. P., Flock M., Wolf S., Dzyurkevich N., Fromang S., Henning T., Klahr H., Meheut H., 2016, A&A, 590, A17
- Sault et al. (1995) Sault R. J., Teuben P. J., Wright M. C. H., 1995, in Shaw R. A., Payne H. E., Hayes J. J. E., eds, Astronomical Society of the Pacific Conference Series Vol. 77, Astronomical Data Analysis Software and Systems IV. p. 433 (arXiv:astro-ph/0612759)
- Stolker et al. (2017) Stolker T., et al., 2017, ApJ, 849, 143
- Strom et al. (1989) Strom K. M., Strom S. E., Edwards S., Cabrit S., Skrutskie M. F., 1989, AJ, 97, 1451
- Tanaka et al. (2005) Tanaka H., Himeno Y., Ida S., 2005, ApJ, 625, 414
- Toci et al. (2020) Toci C., Lodato G., Fedele D., Testi L., Pinte C., 2020, ApJ, 888, L4
- Ubach et al. (2012) Ubach C., Maddison S. T., Wright C. M., Wilner D. J., Lommen D. J. P., Koribalski B., 2012, MNRAS, 425, 3137
- Ubach et al. (2017) Ubach C., Maddison S. T., Wright C. M., Wilner D. J., Lommen D. J. P., Koribalski B., 2017, MNRAS, 466, 4083
- Ueda et al. (2019) Ueda T., Flock M., Okuzumi S., 2019, ApJ, 871, 10
- Villenave et al. (2019) Villenave M., et al., 2019, A&A, 624, A7
- Weidenschilling (1977) Weidenschilling S. J., 1977, MNRAS, 180, 57
- Whipple (1972) Whipple F. L., 1972, in Elvius A., ed., From Plasma to Planet. p. 211
- Whittet et al. (1997) Whittet D. C. B., Prusti T., Franco G. A. P., Gerakines P. A., Kilkenny D., Larson K. A., Wesselius P. R., 1997, A&A, 327, 1194
- Williams & Cieza (2011) Williams J. P., Cieza L. A., 2011, ARA&A, 49, 67
- Wilson et al. (2011) Wilson W. E., et al., 2011, MNRAS, 416, 832
- Wolk & Walter (1996) Wolk S. J., Walter F. M., 1996, AJ, 111, 2066
- Wright et al. (2015) Wright C. M., et al., 2015, MNRAS, 453, 414
- Zhu et al. (2012) Zhu Z., Nelson R. P., Dong R., Espaillat C., Hartmann L., 2012, ApJ, 755, 6
- van der Marel et al. (2015a) van der Marel N., van Dishoeck E. F., Bruderer S., Pérez L., Isella A., 2015a, A&A, 579, A106
- van der Marel et al. (2015b) van der Marel N., Pinilla P., Tobin J., van Kempen T., Andrews S., Ricci L., Birnstiel T., 2015b, ApJ, 810, L7
- van der Marel et al. (2016a) van der Marel N., van Dishoeck E. F., Bruderer S., Andrews S. M., Pontoppidan K. M., Herczeg G. J., van Kempen T., Miotello A., 2016a, A&A, 585, A58
- van der Marel et al. (2016b) van der Marel N., Cazzoletti P., Pinilla P., Garufi A., 2016b, ApJ, 832, 178
- van der Marel et al. (2018) van der Marel N., et al., 2018, ApJ, 854, 177
- van der Marel et al. (2020) van der Marel N., et al., 2020, arXiv e-prints, p. arXiv:2010.10568
- van der Plas et al. (2017a) van der Plas G., et al., 2017a, A&A, 597, A32
- van der Plas et al. (2017b) van der Plas G., Ménard F., Canovas H., Avenhaus H., Casassus S., Pinte C., Caceres C., Cieza L., 2017b, A&A, 607, A55
- van der Plas et al. (2019) van der Plas G., et al., 2019, A&A, 624, A33
Appendix A HD163296
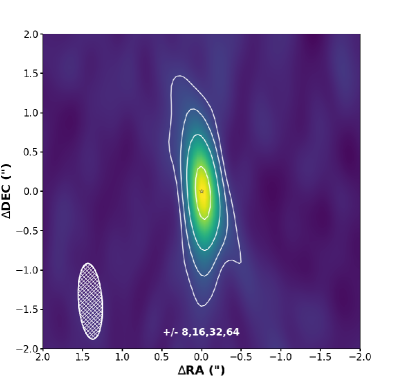
Here we present the 34 GHz observations of HD163296. This source was part of the Discs Down Under survey but is not classified as a transition disc. We include the continuum 34 GHz results in Table 5 and show the continuum map in Figure 6. The continuum map shows significant central emission likely from the combination of both the inner disc and ring structure seen in the recent DSHARP survey (Isella et al., 2018), our observations fail to resolve these features due to the lack of sufficiently long baselines and uv-coverage. No excess of emission is seen in Figure 7.
Target ATCA 34 GHz flux (mJy) ATCA 1 rms (mJy) ATCA (" x ") ATCA () HD 163296 2.45 0.0026 1.31 x 0.400 4.59
Appendix B Frankenstein hyper-parameter sweep
Here we include the Frankenstein hyper-parameter sweep for HD100453. Figure 8 highlights the Frankenstein’s fit dependence on the selection of and . The fit is not overly sensitive to which determines the length over which adjacent points are coupled. For our sample, is varied between 1.01 and 1.5, the choice of for each disc is determined by the characteristics of the visibility data. Values of close to 1.01 are typically chosen for noisy data sets as Frankenstein attempts to fit longer baseline visibilities with lower SNR. As expected, Figure 8 shows that low choices of result in lower values and values that vary minimally. However, if is sufficiently increased the data is fit poorly (as the SNR threshold is increased) and our Gaussian ring brightness profile model may become a Gaussian centred on . Given the relatively large values for these models, the difference in values between and is not a concern.
Appendix C Varying the Phase Centre
We present the visibility data and Frankenstein’s fit dependence on the phase centre. For face-on sources with an obvious deficit of central emission and a clear ring-like morphology, phase centring is simple. However, for low SNR inclined/edge-on sources finding the exact phase centre can be troublesome. Figure 9 clearly indicates how changing the phase centre can either produce a Gaussian-like or Gaussian ring-like 1D radial brightness profile. It’s inconsequential whether we to fit this non-parametrically with Frankenstein or with a parametric model, this is an intrinsic difficulty in fitting a radial profile to a non-axisymmetric disc with uncertain phase centre. Therefore, we suggest fitting these sources should be approached with caution.
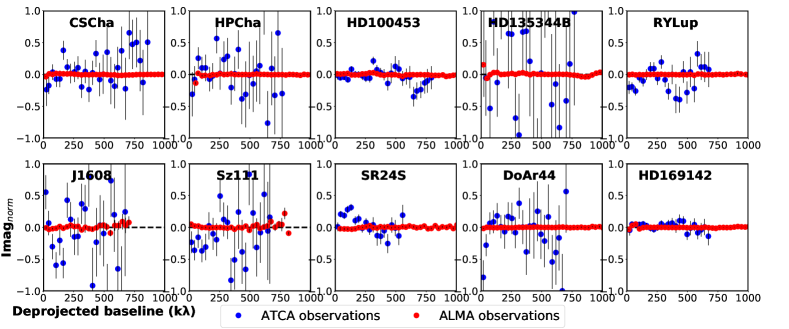
Appendix D Imaginary Component of the Visibilities
Here we include the normalised imaginary component of the visibilities as a function of the deprojected baseline for sources modelled with Frankenstein seen in Fig. 3. For sources with relatively high SNR in the ATCA data (HD100453, SR24S, and HD169142) the imaginary component similarly has a high SNR and a low phase instability. For the rest of our sample, the imaginary component of the ATCA indicates large phase instabilities.
Appendix E Sources without Frankenstein ATCA Fits
We include the normalised imaginary component of the visibilities as a function of the deprojected baseline for ATCA data not modelled with Frankenstein and the corresponding ALMA data with Frankenstein models. We chose not to model the ATCA data of these sources due to the low SNR () of the observations, this is obvious as shown by the large phase instability in Figure 11. In Figure 12 the Frankenstein fits exhibit some deviation in the reconstructed 1D radial brightness profiles. This is likely due to asymmetrical structure seen in each of the corresponding continuum maps. In our analysis we use the same ALMA observations as Pinilla et al. (2018) for SZ Cha (Band 7), J1604 (Band 6), and SR21 (Band 7). For HD34282 and HD143006, we make use of Band 6 data and Pinilla et al. (2018) analyses Band 7 data. For HD34282 our value is comparable to the radial location of the peak emission presented in Pinilla et al. (2018) (see Table 6). However our models for SZ Cha, HD143006, J1604, and SR21 deviate beyond the error. The final calibrated visibilities for HD143006 was sourced from the DSHARP survey (Andrews et al., 2018) and as a result, our analysis reveals more disc substructure in comparison to Pinilla et al. (2018). For SZ Cha, J1604, and SR21, our continuum maps show a peak emission at and 0.355 arcseconds respectively, which is in close agreement with our Frankenstein fit values. For SZ Cha, we use for our briggs weighting in CLEAN and shift our visibility data to the central deficit of emission by and . The discrepancy in the model peak brightness between this work and Pinilla et al. (2018) for these three sources is likely due to limitations introduced by adopting a singular functional form of the disc structure to fit the visibilities parametrically. These limitations are most evident in the choice of the parametric model profile which will typically poorly fit long baseline data (). The accuracy of the fit to long baseline data (on any scale) strongly influences the recovered profile’s features including the radial position of the peak brightness.