∎
22email: Benjamin.Williams@du.edu 33institutetext: Will Palmquist 44institutetext: Department of Business Information and Analytics, Daniels College of Business, University of Denver
44email: Will.Palmquist@du.edu 55institutetext: Ryan Elmore 66institutetext: Department of Business Information and Analytics, Daniels College of Business, University of Denver
66email: Ryan.Elmore@du.edu
Simulation-Based Decision Making in the NFL using NFLSimulatoR ††thanks: Correspondence should be addressed to Benjamin Williams.
Abstract
In this paper, we introduce an R software package for simulating plays
and drives using play-by-play data from the National Football League. The simulations are generated by sampling play-by-play data from previous football seasons. The sampling procedure adds statistical rigor to any decisions or inferences arising from examining the simulations. We highlight that the package is particularly useful as a data-driven tool for evaluating potential in-game strategies or rule changes within the league.
We demonstrate its utility by evaluating the oft-debated strategy of
“going for it” on fourth down and investigating whether or not teams should pass more than the current standard.
Keywords:
sports statistics analytics National Football League1 Introduction
Data-driven decision making is a ubiquitous strategy in today’s marketplace and is becoming increasingly common amongst professional sports organizations. From the Major League Baseball’s Moneyball movement (Lewis, 2003) to the Moreyball strategies employed by the National Basketball Association’s Houston Rockets (Walsh, 2019), analytics are no longer the sole purview of the academy as teams try to improve their performance by investigating the data. The general consensus, however, is that the National Football League (NFL) lags behind other professional sports leagues in their use of analytics (Clark, 2018). This does seem to be changing, as evidenced by a recent hiring trend of data analysts to NFL teams (Loque, 2019), as well as within the league office in New York.
In the NFL, perhaps the most widely debated research question regards the decision of going for it on fourth down. This has also been the subject of several academic articles (Romer, 2006; Yam and Lopez, 2019), the New York Times “4th down bot” (Burke and Quealy, 2013; Causey et al., 2015), and a new calculator from sports analyst Ben Baldwin (Baldwin, 2020a). The consensus among researchers and analysts is NFL coaches tend to be too conservative in their fourth-down calls, often preferring to kick the football (punt or field goal attempt) when the data suggests they should pass or run the ball.
While the decision to go for it on fourth down is much discussed, there are a plethora of other strategies a team may wish to investigate. Potential strategies for deeper investigation range from the frequency and type of plays run, the use of a team’s (limited) timeouts during a game, defensive alignment, and so on. The seemingly infinite possibilities for NFL strategy evaluation made us wonder how one could determine which strategies offer the best chance of winning. Some attempt has been done for strategies such as passing versus running the football. In the sole peer-reviewed article that we are aware of, Kovash and Levitt (2009) found NFL teams did not pass as much as they should. Hermsmeyer (2018) similarly noted, in an article for the data journalism website fivethirtyeight.com, that even though the NFL has transitioned to become a more passing heavy league, teams should still pass more. Apart from the passing versus rushing and fourth down decision making, there is a lack of research regarding NFL strategies in the literature.
In this paper we present an R software package, NFLSimulatoR, and an analytically rigorous method for analyzing NFL strategies. Our method consists of simulating strategies via the sampling of NFL play-by-play datasets realized in previous seasons. This simulation method is flexible and allows for the investigation of many possible strategies and offers a tool for informed decision making with respect to sport performance. We have embedded the simulation framework into an open source software package to share the method with the broader sports analytics community. The rest of the paper is outlined as follows. In the next section we present the R software package we wrote for simulating NFL strategies. Section 3 describes the use of the software package for the two strategies we have discussed thus far: fourth down decision making and passing versus rushing. Finally, we offer some concluding thoughts about using (and contributing to) the package moving forward and other discussions in the final section.
2 NFLSimulatoR
The ideas presented in this paper are, in part, inspired by a blog post by Mike Lopez, currently the Director of Data and Analytics for the NFL, in which he used a simulation-based approach to investigate a potential overtime rule change in the NFL (Lopez, 2019). In contrast to the one-off solution presented on his blog, we provide a robust software platform for assessing NFL strategies in the NFLSimulatoR R package. Our desire is for the wider analytics community to use this package, extend our work, and study other strategies in a analytically sound manner.
The ideas embedded in NFLSimulatoR are simple, yet extremely powerful. The key feature is that we rely on simulations of actual NFL play-by-play data to evaluate potential strategies. We define a strategy broadly as any set of principled decisions consistently made by an NFL team during a game. An example, albeit possibly extreme, is for a team to employ only passing plays rather than a mixture of passes and runs while on offense. This is a simple strategy, but one we can nonetheless examine using our package. To examine a particular strategy, we sample plays satisfying the criteria of the strategy at hand. Going back to our simplistic example, we would sample only passing plays if we wanted to see what happened when a team only passes the football.
Sampling data to make estimates, inferences, or decisions about a larger population is at the core of statistics and lends important rigor to our method. In our package, we select probability samples according to a simple random sample with replacement from our population of interest (NFL play-by-play data) to produce unbiased and representative results. An excellent resource for more on statistical sampling can be found in Lohr (2010).
The package relies on NFL play-by-play data available via the NFL’s Application Programming Interface. These datasets are accessible within R using either the nflscrapR or the nflfastR R packages (Horowitz et al., 2020; Carl et al., 2020) (or by downloading it directly from the nflscrapR-data or nflfastR-data websites (Yurko, 2020; Baldwin, 2020b). The NFLSimulatoR package includes two functions, download_nflscrapr_data() and download_nflfastr_data(), for directly downloading regular-, pre-, or post-season NFL play-by-play data from either source for several years, currently from 2009 - 2019. Each year contains approximately 48,000 plays of data. In addition, we include a function called prep_pbp_data() to eliminate extraneous information and prepare the NFL data for use in NFLSimulatoR functions.
Our package is built primarily on the function sample_play(). This function samples from NFL data according to a given strategy for a particular down and distance. The strategy is passed to the function via the strategy parameter. Down and distance information refer to what down it is (1 - 4), how many yards are required for a first down, and the yardline at which the play occurs (1 - 99). The down is passed to the function via the what_down parameter, the distance to go is passed via the yards_to_go parameter, and the yardline is passed via the yards_from_own_goal parameter. Our sampling is done randomly and so we are confident in the outcomes from the simulations. However, some combinations of sampling parameters (strategy, down, distance, yardline) rarely occur in an NFL game. For example, it may be there are few or no plays where a team had the ball on 3rd down, on the 47th yardline, with 15 yards to go for a first down, and chose to run the ball. In such cases we widen our sampling range to include plays from yardlines close the to the yardline of interest or with one less yard to go for a first down (the user can also choose a window to expand the yardline selection via the window_yards_from_own_goal parameter). We have built flexibility into the sample_play() function so the user can seamlessly implement it in their unique settings.
The other main function of interest in the package is called sample_drives(). This allows the user to simulate a series of plays by one team (a drive) following some specific strategy versus another team employing a “normal” strategy. By “normal” we mean the plays of the opposing team are simply sampled at random from all plays without a specific strategy in mind. The sample_drives() function shows how a specific strategy is expected to perform if implemented during an NFL game when the opposing team is employing the status quo. The function can either sample drives until one team scores, or it can sample a single drive and return the outcome of the drive (i.e., touchdown, field goal, punt, or turnover). By simulating many drives one can identify statistics such as expected points per drive and proportion of drives resulting in a score for a variety of strategies. The sample_drives() function takes parameters for the number of simulations to be run (n_sims), the starting yardline of the simulations (from_yard_line), the strategy (strategy), and if the simulation is of a single drive (single_drive). Within sample_drives(), the function down_distance_updater() updates the down, distance, and yards to go and then samples the next play from all plays satisfying the updated criteria.
To demonstrate the use of this software and to offer an idea of how to extend our work, we provide two strategies in the package. The first is a strategy related to fourth-down decision making and the second is associated with how often a team should pass (or run) the football. Within the fourth down strategy we include several sub-strategies to make a decision about going for it or not on fourth down. As mentioned above, the fourth down strategy has been studied in the academic domain, see e.g. Yam and Lopez (2019) and Romer (2006). We include it in this manuscript due to its popularity and to give our own perspective on this well-known problem. In the next section, we discuss these two strategies in more detail.
The NFLSimulatoR package is available on CRAN (Comprehensive R Archive Network) and the latest developmental version is available on github. Adding this package to CRAN was an important step to make sure our package passed rigorous software checks and to make installation simpler. Additional package details related to issues, recent changes, etc. can be found at the NFLSimulatoR website. The package can be installed within R using either option given below.
## From CRAN
install.packages("NFLSimulatoR")
## From Github
install.packages("remotes")
remotes::install_github("rtelmore/NFLSimulatoR")
3 Applications
3.1 Fourth Down Strategy
The first strategy we examine concerns fourth down decision making. This is one of the most well-known and discussed NFL strategies. On a fourth down the offensive team has two options: go for it or kick. If they kick, they can either punt the ball and allow the other team to take offensive position or kick a field goal. The other option a team has on fourth down is to attempt to run or pass the ball and gain enough yards for a first down. Historically, NFL coaches tend to not go for it on fourth down unless time is running out and/or the only possible way to win the game involves increasing the risk of a turnover for the potential benefit of a first down. However, thanks to the analytics movement, teams are beginning to challenge the status quo.
In 2006, Romer began the discussion about optimal decision making on fourth down by estimating the expected point value of kicking versus going for it on fourth down. This was done by estimating the value of a team having the ball at each yardline on the field. These values were estimated from NFL play-by-play data from 1998, 1999, and 2000 (Romer, 2006). This work was updated in 2013 via the New York Times’ Fourth Down Bot (Burke and Quealy, 2013). Burke and Quealy use a similar calculation of the value of being at each yardline and then estimate the probability of gaining enough yards for a first down. The expected points for some fourth down can be calculated as the product of the probability of securing a first down and the point value of a first down at the specific yardline added to the product of the probability of not securing a fourth down and the point value of the other team taking possession at the given yardline.
The estimated value of being at a given yardline takes into account field goals and the expectation can be either positive or negative. If it is positive, the Fourth Down Bot recommends going for it on fourth down. Yam and Lopez (2019) used data from the New York Times’ Fourth Down Bot in a causal analysis and determined, on average, if teams employed the (more agressive) strategy of the Fourth Down Bot they would enjoy approximately 0.4 more wins per year. In the NFL where there are only 16 games in a season, 0.4 is a substantial increase in wins. For further examination into the history of fourth down decision making see Yam and Lopez (2019).
Because this strategy is of such interest we include it in our package. We offer five sub-strategies regarding decision making on fourth downs to compare various methods. The first is called the empirical sub-strategy. Here, our functions simply select the fourth down play at random from among all similar plays (i.e., similar with respect to down, distance and yardline). The majority of the time this will be a punt or field goal attempt, but there are occasions where a team may try for a fourth down (perhaps if there is very little yardage needed for a first down and the yardline is close to the opposing endzone). The second sub-strategy is always go for it and samples non-kicking plays from the given down and distance. In this sub-strategy we do not require the sampling to be exclusively from fourth down plays. In fact, we expand the pool of potential plays to sample from on each of downs two through four. That is, we sample from downs and on down , for . We assume the impact of, and mental anxiety among, players due to it being fourth down is negligible because the defensive team would have similar anxieties, the players are professional and should be more immune to such inhibitions, and because previous literature followed this procedure (e.g., Romer (2006) used third downs instead of fourth downs) . The third sub-strategy is never go for it and in it the team always punts or kicks a field goal. This offers us a conservative strategy to study, and we simply sample kicks (and their outcome) from the given location.
The fourth sub-strategy is go for it if yardage is smaller than Y. Here we let the user set the parameter to be the value of the yards required for a first down. If the distance for a first down is less than or equal to the strategy says to go for it, and to kick if the distance is greater than or equal to . This allows the examination of a stricter sub-strategy but one offering a trade-off between always go for it and never go for it. This sub-strategy is likely more palatable for NFL teams since having a rule to go for it on fourth if there is always less than, say, 1 yard to go for a first down might be more acceptable than always going for it. The final sub-strategy is expected points. Here we use the expected points estimated from the nflscrapR R package to find the expected points at each yardline on the field. We further empirically estimate the probability of gaining a first down and making a field goal. Then we solve for the expected value of going for it, punting it, and kicking a field goal. The decision is made by selecting the choice which maximizes this expected points value. This last sub-strategy is the most analytically reliant, and best mirrors current literature. Because we offer these sub-strategies within a free software package they can be re-run each season as more data becomes available allowing analysts to make recommendations which include the most recent NFL data.
We compare these sub-strategies by plotting the percent of drives resulting in no score, a field goal, or a touchdown for the five sub-strategies. For the go for it if yardage is smaller than Y option we let Y=5. For this and subsequent fourth down analyses, we only keep plays occuring before the final 2 minutes of each half of the game and only plays where one team is within 28 points of the other. This allows us to remove any plays that result from extreme decision making because the outcome of the game is all but determined. We use play-by-play data from both 2018 and 2019.
For the simulations, we generate 10000 drives for each sub-strategy starting at the 25 yard line for all plays from these two regular seasons. This corresponds to the usual starting position to begin a half or after an opposing team scores (assuming the kickoff is a touchback). For each drive we use the sample_drives() function and set the single_drive argument equal to TRUE. Thus, we only care about simulating one drive and storing its outcome for each simulated drive. In other words, we start each drive with first down and ten yards to go from the 25 and sample plays accordingly. The summarized results are displayed Figure 1.
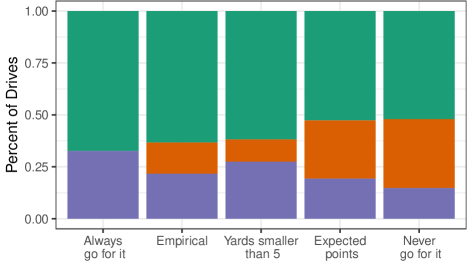
From this figure we see the never go for it strategy offers the largest probability for scoring on a single drive with the majority of the scores coming from field goals. The expected points strategy has the second largest percentage of simulated drives resulting in a score, followed by yardage smaller than 5 yards, and then the empirical sub-strategy. For further investigation, in Table 1 we examine the percent of drives resuling in a field goal (FG) or touchdown (TD), the average score per drive (assuming a touchdown always results in 7 points), and a 95% confidence interval for the average score, for the 5 sub-strategies.
| Sub-strategy | Field Goals | Touchdowns | Mean Score | CI |
| Always Go | 0% | 33% | 2.28 | (2.22, 2.35) |
| Empirical | 15% | 22% | 1.96 | (1.91, 2.02) |
| Expected Points | 28% | 19% | 2.19 | (2.14, 2.25) |
| Never Go | 33% | 15% | 2.03 | (1.98, 2.08) |
| Go if Yards 5 | 11% | 27% | 2.24 | (2.18, 2.30) |
From Table 1, the fourth down sub-strategy with the largest average points per simulated drive is always go for it (average of 2.28 points) followed by yardage smaller than 5 yards (average of 2.24 points), and expected points (average of 2.19 points). We also see the always go for it sub-strategy is boom or bust resulting in only touchdowns or no scores. Interestingly the yardage smaller than 5 yards has an average score similar to always go for it, yet it does recommend field goals to be taken. The confidence interval for the yardage smaller than 5 yards mean score is also narrower than that for always go for it. Taking this into account along with the fact that the averages of these two sub-strategies are so close, a recommendation for a team nervous about always going for it on fourth down might be to always go for it if there are less than five yards to go for a first down, regardless of field position. Figure 1 shows this strategy will produce scoring drives more often and has nearly the highest average score per drive.
If a team wishes to pursue this sub-strategy (going for it on fourth if the yards to go is less than five yards) a logical next question is: what about other yards to go values? That is, what if the team went for it if the yards required for a first down are 4, or 6, or something else entirely? Figure 2.1 shows the percent of drives resulting in a score for a range of values. Figure 2.2 displays the average (and 95% confidence interval) score per drive for the various values, and Figure 2.3 gives the average (and 95% confidence interval) yardline at which the ball is turned over when the drive does not result in a score.
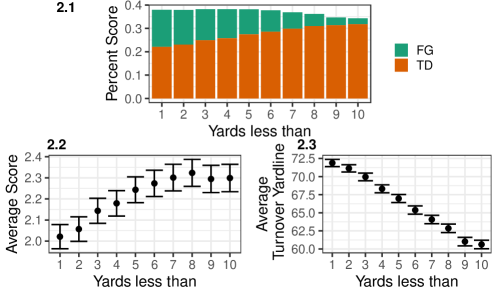
In Figure 2.1 the largest percent score value (of about 38%) is nearly exactly achieved by values of 3, 4, and 5. Figure 2.2 shows the values of 8 has the top average score per drive values, and this average decreases as decreases. Figure 2.3 shows the average turnover yardline gets further away from the offensive teams goal for larger values of . Taking all this together, a value of 5 yards may be the best option for the fourth down sub-strategy go for it if yardage less than because it has nearly the highest percent score value, a higher average score than all smaller values, a more advantageous average turnover yardline than all larger values, and (speculatively) may be more acceptable by NFL coaching staffs than a value of, say, .
Here, we caution the reader that this is by no means a causal investigation of fourth down strategies. Indeed, we could further analyze the data by evaluating the performance of a specific sub-strategy amongst better or worse teams, but do not do so as our primary purpose is to demonstrate the usefulness of the NFLSimulatoR package and its core functionality.
3.2 Run/Pass Percentage
Kovash and Levitt (2009) and Hermsmeyer (2018) argue NFL teams should pass more often. In this section we investigate this thesis using the simulation-based approach of NFLSimulatoR. Though perhaps simple on its surface, examining a strategy having to do with the proportion of plays that are a pass instead of a run proves interesting. Even if the NFL is not as analytically forward as other professional sports leagues, the league seems to be trending towards passing more. The NFLSimulatoR package includes a strategy allowing the user to study the effect of passing the ball more or less often.
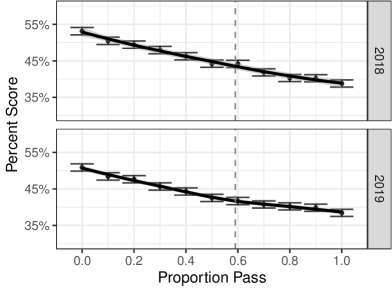
When employing this strategy in the sample_play() or sample_drives() functions, the argument p must be included as a parameter. p is the probability a given offensive play on first, second, or third down is a pass. To keep the strategy straightforward, we follow an empirical procedure when the play to be sampled is a fourth down. That is, when a fourth down situation arises in the sample, we assume the play is simply sampled from all fourth down plays at the given yardline (or within a neighborhood of the yardline) and distance to go until a first down. Fourth down plays sampled at their regular rates usually result in a punt or a field goal attempt. By varying p we can study how pass proportion affects statistics such as the expected points per drive, the proportion of drives resulting in a score, among a host of other metrics.
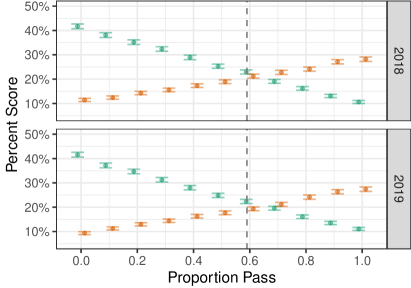
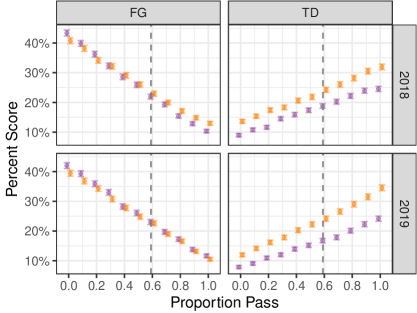
Figure 3 shows the proportion of simulated drives resulting in a score for the offensive team (field goal or touchdown) in 2018 and 2019. Note that we include a vertical dashed line showing the league-wide proportion of passing plays on first through third downs. This proportion of passing (running) plays on first through third downs was roughly 59% (41%) in both 2018 and 2019. At first inspection this figure suggests passing more often results in scoring less on average. Obviously this initial glance requires more scrutiny and indeed, subsetting by the type of score reveals additional insight. Specifically, Figure 4 shows the same data subsetted by the type of score: either a touchdown or field goal. There is a clear trend showing more touchdowns are scored as the proportion of plays that are passes increases.
Next, we look at the percentage of drives resulting in a score broken down by the quality of the team. In this case we subset by whether or not a team made the playoffs, and use playoff appearance as a proxy for quality. To do this we simulate one set of drives by sampling plays from teams that made the playoffs and another set of drives by sampling teams that did not. Figure 5 shows drives using plays from the better teams (i.e., playoff teams) tend to result in a score more often when employing a heavier passing-based strategy than the drives from non-playoff teams.
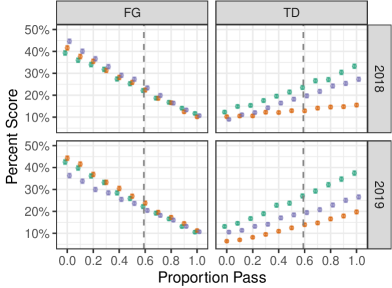
Again, we stress that our approach is not causal in any sense of the imagination. That is, we are not saying that passing more will necessarily lead to more scores, particularly if the team has a sub-standard quarterback. This result, of course, is likely confounded by playoff teams (traditionally) having better quarterbacks. Thus, we next subset the pool of plays by each team’s overall passer rating (RTG) and sample plays from three distinct pools: High, Medium, and Low passer rating teams. A team in the pool of High passer rating teams had an overall rating falling into the upper-most tercile of teams. The pools for Medium and Low are similarly defined. The results of the simulated drives using these groups are displayed in Figure 6. Here, we see the teams in the upper tercile of passing ratings score more touchdowns as the proportion of passing plays increases than teams in the other two groups. However, the percent field goals scored as a function of the proportion of passing plays is similar for all the three team groupings.
Our overall conclusion, based on these simulations, is that passing more should lead to a higher percentage of touchdowns scored. This conclusion is not uniformly true across all types of teams, however. That is, the better teams, or those teams with a higher-quality quarterback relative to the rest of the teams in the league, will benefit much more than the others.
Finally, we should mention that the time remaining in a game, as well as other variables, could confound these results as well. That is, teams that are winning in the fourth quarter might elect to rush more often in order to “shorten the game” and losing teams might pass more. Therefore, a future study might include a time-in-game parameter, , in order to sample from plays within a window around .
4 Conclusions and Discussion
Even though the NFL has existed since 1920, teams are still seeking inefficencies in the game to exploit. There always seems to be a brilliant new coach ready to introduce a new strategy to push teams to more success. The purpose of creating NFLSimulatoR is to give the wider community a tool to examine a multitude of NFL strategies. The package contains a set of robust and statistically sound tools to simulate plays and drives to examine NFL game plans. This package will also age well as it can be continually updated with data from the most recent NFL season. Another use for the package is to examine the ramifications of rule changes by the league. This would allow the league to take a data-driven approach to such changes. One example of a rule change that has been debated is eliminating the kickoff after a score.
In the package we include two strategies of interest, passing versus rushing the ball and going for it or not on fourth down. We have examined each strategy in this paper as examples of possibilities for the package. We imagine many extensions of our work, including strategies regarding whether to run or throw on first down, what play works best after a penalty or timeout, and what plays to run in the first or last few minutes of a game or quarter. Another obvious extension to this work is the implementation of more game- or team-specific scenarios. For example, we might study game-specific strategies by sampling from plays satisfying, or nearly satisfying, additional simulated in-game characteristics such as time-in-game, current score, weather, location, among a host of additional parameters. Taking this concept a step further, we could also assign higher sampling probabilities to plays most closely matching these given in-game characteristics.
In addition, we might study team-specific strategies if we assume some teams perform better at various aspects of the game than others. For example, a team could have an excellent run game but a poor pass game, or excel at throwing the ball fewer than 20 yards but struggle when the throw is over 20 yards. In such cases, we could only sample plays which match a given team’s profile to study the outcomes of strategies a specific team is more likely to employ. Our methodology is robust enough to include these subsetting parameters in any of the sampling functions given in NFLSimulatoR. Furthermore, the simulations can either be at the individual drive level (as we did) or by evaluating a strategy over the course of an entire game.
Another possible extension of our work is to choose strategies at random to implement. By randomly selecting and setting various parameters for a strategy (or combination of strategies) one can compare a bevy of strategies. As the adoption of NFLSimulatoR grows and accumulates more available strategies, randomly choosing and combining strategies and then testing them seems immensely useful. Harnessing computational power to examine a plethora of strategies (such as: always go for it on fourth down while also passing on 77% of first down plays) will only lead to further optimization of in-game decision making in the NFL.
We welcome collaboration from the sports analytics community and hope for contributions to our package, which are easy to make given its open-source nature. The fact that there are so many possible analysis options of game strategies makes us more excited about the existence of the NFLSimulatoR package because now the wider sports analytics community can take our initial work and extend it. As an example, recently a new model-based fourth down decision maker was introduced by Ben Baldwin, an author of the previously mentioned nflfastR package Baldwin (2020a). This is exactly the sort of contribution we hope will be added to the NFLSimulatoR package. Such a strategy could be integrated and tested within the simulation based framework we created and shared with the community at large. We look forward to what new strategies will be devised and tested and hope to see even more analytics used in the NFL and other sports leagues.
Finally, we stress that NFLSimulatoR is in its infancy with the current release being v0.3.1. As previously mentioned, we encourage interested parties to contribute to the package as this project evolves. Contributions could be in the form of new strategies, vignettes showing new and interesting analyses, or simply code enhancements. For reproducibility we have included code to generate the figures and table used in this paper as a github repository located at github.com/williamsbenjamin/nflsimulator_aoor.
References
- Baldwin (2020a) Baldwin, B. (2020a). NFL fourth-down decisions: The math behind the league’s new aggressiveness. https://theathletic.com/2144214/2020/10/28/nfl-fourth-down-decisions-the-math-behind-the-leagues-new-aggressiveness/.
- Baldwin (2020b) Baldwin, B. (2020b). nflfastR-data repository. https://github.com/guga31bb/nflfastR-data.
- Burke and Quealy (2013) Burke, B., Quealy, K. (2013). New York Times Forth Down Bot. https://www.nytimes.com/newsgraphics/2013/11/28/fourth-downs/post.html.
- Carl et al. (2020) Carl, S., Baldwin, B., Sharpe, L. (2020) nflfastR: Functions to Efficiently Access NFL Play by Play Data. https://github.com/mrcaseb/nflfastR, r package version 3.2.0.
- Causey et al. (2015) Causey, T., Katz, J., Quealy, K. (2015). A better 4th down bot: Giving analysis before the play. https://www.nytimes.com/2015/10/02/upshot/a-better-4th-down-bot-giving-analysis-before-the-play.html.
- Clark (2018) Clark, K. (2018). The nfl’s analytics revolution has arrived. https://www.theringer.com/nfl/2018/12/19/18148153/nfl-analytics-revolution.
- Hermsmeyer (2018) Hermsmeyer, J. (2018). For a passing league, the nfl still doesn’t pass enough. https://fivethirtyeight.com/features/for-a-passing-league-the-nfl-still-doesnt-pass-enough/.
- Horowitz et al. (2020) Horowitz, M., Yurko, R., Ventura, S. (2020) nflscrapR: Compiling the NFL Play-by-Play API for easy use in R. https://github.com/maksimhorowitz/nflscrapR, r package version 1.8.3.
- Kovash and Levitt (2009) Kovash, K., Levitt, S. D. (2009). Professionals do not play minimax: Evidence from Major League Baseball and the National Football League. NBER Working Papers 15347 .
- Lewis (2003) Lewis, M. (2003). Moneyball: The Art of Winning an Unfair Game. W. W. Norton and Company, New York City.
- Lohr (2010) Lohr, S. L. (2010). Sampling: Design and Analysis. Brooks/Cole.
- Lopez (2019) Lopez, M. (2019). Estimating nfl drive outcomes under rules that don’t exist. https://statsbylopez.netlify.app/post/resampling-nfl-drives/.
- Loque (2019) Loque, J. (2019). Ravens bolster their analytics department with new front office additions. https://www.baltimorebeatdown.com/2019/6/19/18684490/ravens-to-beef-up-analytics-department-with-new-front-office-additions-eric-decosta-john-harbaugh.
- Romer (2006) Romer, D. (2006). Do firms maximize? Evidence from professional football. Journal of Political Economy 114(2):340–365.
- Walsh (2019) Walsh, R. (2019). “Moreyball” and its effect on the art of basketball. https://digitalmarketing.temple.edu/rwalsh/2019/03/15/moreyball-and-its-effect-on-the-art-of-basketball/.
- Yam and Lopez (2019) Yam, D. R., Lopez, M. J. (2019). What was lost? A causal estimate of fourth down behavior in the National Football League. Journal of Sports Analytics 5(3):153–167.
- Yurko (2020) Yurko, R. (2020). nflscrapR-data repository. https://ryurko.github.io/nflscrapR-data/.