A circular polarisation survey for radio stars with the Australian SKA Pathfinder
Abstract
We present results from a circular polarisation survey for radio stars in the Rapid ASKAP Continuum Survey (RACS). RACS is a survey of the entire sky south of being conducted with the Australian Square Kilometre Array Pathfinder telescope (ASKAP) over a wide band centred on . The data we analyse includes Stokes I and V polarisation products to an RMS sensitivity of . We searched RACS for sources with fractional circular polarisation above 6 per cent, and after excluding imaging artefacts, polarisation leakage, and known pulsars we identified radio emission coincident with 33 known stars. These range from M-dwarfs through to magnetic, chemically peculiar A- and B-type stars. Some of these are well known radio stars such as YZ CMi and CU Vir, but 23 have no previous radio detections. We report the flux density and derived brightness temperature of these detections and discuss the nature of the radio emission. We also discuss the implications of our results for the population statistics of radio stars in the context of future ASKAP and Square Kilometre Array surveys.
keywords:
radio continuum: stars – stars: low mass – stars: chemically peculiar1 INTRODUCTION
While most stars generally have weak radio emission and are undetectable over Galactic distance scales, magnetically active stars are known to exhibit radio bursts with intensities orders of magnitude greater than those produced by the Sun. Radio bursts have been detected from a wide range of stellar types, including chromospherically active M-dwarfs, ultracool dwarfs, close and interacting binaries, and magnetic chemically peculiar (MCP) stars (see Güdel 2002 for a review). Stellar radio bursts are often highly circularly-polarised with brightness temperatures in excess of , requiring the operation of a non-thermal, coherent emission process. Coherent radio bursts are generally attributed to one of two processes: plasma emission which operates at the fundamental and second harmonic of the local plasma frequency , or electron cyclotron maser (ECM) emission at the local relativistic cyclotron frequency (see Dulk 1985 for a detailed review of these processes). Here , , and are the electron density, charge, and mass respectively, is the magnetic field strength, is the Lorentz factor, and is the speed of light.
If the emission mechanism can be determined, these processes are an excellent measure of either the electron density or magnetic field of the stellar magnetosphere, and provide a means to probe extreme events such as particle acceleration driven by magnetic reconnection (Crosley et al., 2016) and auroral current systems (Leto et al., 2017). Periodic auroral bursts are often highly beamed and modulated by stellar rotation, providing an independent constraint on the stellar rotation period (Zic et al., 2019). Constraints on the energetics and rates of stellar radio bursts also inform models of magnetospheric topology (André et al., 1991), cool star magnetic dynamos (Kao et al., 2016), the origin of strong magnetic fields in hot stars (Schneider et al., 2016), and the habitability of exoplanets (Crosley & Osten, 2018).
Despite the wide variety of stars demonstrating non-thermal radio bursts, studies have typically been limited to targeted observations of a small number of candidates, whose selection is motivated by activity indicators such as prior optical or X-ray flaring (White et al., 1989; Güdel, 1992), presence of chromospheric emission lines (Slee et al., 1987), or previously known radio activity (Villadsen & Hallinan, 2019). Surveys have also been conducted specifically targeting known classes of radio star such as RS Canum Venaticorum (RS CVn) and Algol binaries (Collier et al., 1982; Morris & Mutel, 1988; Umana et al., 1998), hot OB-type stars (Bieging et al., 1989), young stellar objects (YSOs) (André et al., 1987; Osten & Wolk, 2009), and ultracool dwarfs (Antonova et al., 2013). The selection biases inherent in these targeted searches impacts the inference of population statistics, and does not allow for the discovery of new classes of radio stars.
A few volume-limited surveys for radio stars have been conducted, though their success has been limited by the high surface density of background radio sources, resulting in a large number of false-positive matches. Helfand et al. (1999) searched of high Galactic latitude sky to a sensitivity of in the VLA Faint Images of the Radio Sky at Twenty-cm (FIRST; Becker et al., 1995) survey identifying 26 radio stars. Kimball et al. (2009) further explored FIRST in a comparison with the Sloan Digital Sky Survey (SDSS; Adelman-McCarthy et al., 2008) selecting 112 point radio sources coincident with spectrally confirmed SDSS stars, though a similar number of matches are estimated due to chance alignment with background galaxies. Umana et al. (2015) surveyed a field located within the Galactic plane to a sensitivity of in a search for stellar radio emission, and identified 10 hot stars producing thermal radio emission out of 614 detected sources. Vedantham et al. (2020) crossmatched radio sources in the LOFAR Two-Metre Sky Survey (LOTSS; Shimwell et al., 2017) with nearby stars in Gaia Data Release 2 (Andrae et al., 2018), discovering an M-dwarf producing coherent, circularly polarised auroral emission at metre wavelengths.
Circular polarisation surveys are a promising method for wide-field detection of stellar radio bursts, as the synchrotron emission from Active Galactic Nuclei (AGN) that accounts for the majority of unresolved radio sources is typically less than per cent circularly-polarised (Macquart, 2002), and thus the number of false-positive matches between stars and unrelated background AGN is significantly reduced. Lenc et al. (2018) performed an all-sky circular polarisation survey at with the Murchison Widefield Array (MWA; Bowman et al., 2013) detecting 33 previously known pulsars and two magnetically-active stars. There have been no other all-sky circular polarisation radio surveys, and none have been conducted at centimetre wavelengths where targeted campaigns of magnetically-active stars have previously been focused (e.g., Antonova et al., 2013; Villadsen & Hallinan, 2019).
The Australian Square Kilometre Array Pathfinder (ASKAP; Johnston et al., 2008, Hotan et al. in press) is a radio telescope array of 3612-metre antennas located in the Murchison Radio-astronomy Observatory in Western Australia. As part of the Rapid ASKAP Continuum Survey (RACS; McConnell et al., 2020) we have performed the first all-sky circular polarisation survey for radio stars at centimetre wavelengths. In § 2 we describe the RACS observations and data processing. In § 3 we describe our search procedure for stars with significant circular polarisation. We present the detected radio stars in § 4 and discuss the implications of our survey on stellar radio burst statistics and future ASKAP surveys in § 5.
2 OBSERVATIONS AND DATA REDUCTION
RACS is the first all-sky survey performed with the full 36 antenna ASKAP telescope, and covers the entire sky south of . Each antenna in the array is equipped with a Phased Array Feed (PAF; Hotan et al., 2014; McConnell et al., 2016) which allows 36 dual linear polarisation beams to be formed on the sky. All four cross-correlations were recorded, allowing full Stokes I, Q, U and V images to be reconstructed. The antenna roll-axis was adjusted throughout the observations to maintain orientation of the linear feeds with respect to the celestial coordinate frame, so the beam footprint remained fixed on the sky and no correction for parallactic angle was required. RACS observations used a 66-beam square footprint giving a field of view, and were acquired in 15 minute integrations at a central frequency of with 288 channels each wide. RACS observations were conducted from April through May 2019, with fields originally located near the Sun observed in August 2019.
2.1 Data Reduction
ASKAP data is calibrated and imaged with the ASKAPsoft package (Cornwell et al., 2011; Guzman et al., 2019) using the Galaxy computer cluster that is maintained at the Pawsey Supercomputing Centre. The specific methods used for RACS data reduction are described in detail by McConnell et al. (2020), but we summarise them here.
Data were prepared for imaging by flagging bad samples and applying a calibration derived from the calibration source PKS B1934638, which included factors for adjustment of interferometric phase and for setting the absolute flux density scale. Images were formed for each beam as the first two terms (0, 1) of a Taylor series in frequency using multi-frequency synthesis. ASKAPsoft applies weights to the visibility data using preconditioning (Rau, 2010); RACS data were weighted to achieve the equivalent of a Briggs (1995) ‘robust weight’ of , where takes values between and corresponding to uniform and natural weighting respectively. All beam images were deconvolved using the BasisfunctionMFS algorithm before being combined into a single image by linear mosaicing. Beam images were made with 6144 6144 pixels each of size , and the final mosaics have approximately111The mosaic boundary is determined by the values of primary beam weights and is slightly irregular. 11800 11800 pixels of the same size.
2.2 Data Quality
A complete description of the published RACS images and source catalogue, including final quality control metrics, are presented by McConnell et al. (2020) and Hale et al. (in prep.) respectively. We describe the main quality metrics relevant to an early processing of the data used in this paper.
The mosaic images have a point-spread-function (PSF) that varies over the field of view and between images due to the variation in sampling of the (,)-plane by individual beams. The central lobe of the PSF has a typical major axis full width half maximum (FWHM) of and minor axis FWHM of with variations of and respectively. We assessed the flux density uncertainty introduced by PSF variation by direct comparison to the RACS source catalogue presented in Hale et al. (in prep.). This catalogue was produced from images that are convolved to a common resolution of with a uniform PSF, and has a median flux density ratio of derived from comparison to the Sydney University Molonglo Sky Survey (SUMSS; Mauch et al., 2003). We selected a sample of bright, unresolved RACS catalogue sources which are isolated from neighbouring components by at least such that they are free from contamination due to close neighbours, and crossmatched this sample with their counterparts in our images. We find a median ratio between our fluxes and those from the RACS source catalogue of . The uncertainty in this ratio contains contributions from random errors attributable to signal to noise ratio (SNR) and position-dependent effects described by McConnell et al. (2020). We scaled our fluxes by this 3 per cent factor and incorporated the 9 per cent uncertainty in quadrature with the RACS catalogue flux scale uncertainty, arriving at a cumulative flux density uncertainty of .
Our positional accuracy was assessed by comparison to the second realisation of the International Celestial Reference Frame (ICRF2; Fey et al., 2015) catalogue. Although ICRF2 sources are sparsely distributed across the sky, 2059 are a good positional match to the bright, unresolved, and isolated sample described above. The distribution of positional offsets between RACS and ICRF2 for these sources has a systematic shift of in right ascension and in declination, and standard deviation of in both coordinates. This positional uncertainty is less than the pixel scale of .
The images that we analyse in this paper were made before the development of the on-axis polarisation leakage correction described by McConnell et al. (2020). We assessed the magnitude of leakage between Stokes I and V by assuming all field sources with peak total intensity flux density are unpolarised, such that any observed Stokes V flux is solely due to leakage. A small number of pulsars are brighter than this threshold and intrinsically polarised, though the source density of bright AGN is much greater allowing for a good estimate of the magnitude of leakage. Among 11974 field sources in negative Stokes V and 1217 in positive222Throughout this paper we adopt the IAU sign convention for which positive Stokes V corresponds to right handed circular polarisation and negative Stokes V to left handed, as seen from the perspective of the observer., we find a median polarisation leakage of and per cent respectively, with hot spots of up to per cent near the mosaic corners.333The asymmetry between the number of negative and positive components is due to a bias in the Stokes V leakage pattern, and is currently being investigated. The real, polarised sources detected in this paper are evenly distributed between positive and negative.
| Property | Value |
|---|---|
| Sky Coverage | |
| Central Frequency | |
| Bandwidth | |
| Integration Time | |
| Typical RMS Noise | |
| Cumulative Flux Density Accuracy | |
| Polarisation Leakage | (V negative) |
| (V positive) | |
| Astrometric Accuracy | |
| PSF Central Lobe (FWHM) | |
The properties of the early processing data analysed in this paper are summarised in Table 1. Further refinements have been applied to the published RACS images and source catalogue, and we refer the reader to McConnell et al. (2020) and Hale et al. (in prep.) for a complete description of the publicly available data.
3 CANDIDATE SEARCH
We used the selavy (Whiting & Humphreys, 2012) source finder package with default settings to extract source components from the Stokes V images, with source extraction run once to extract positive components and a second time on the inverted images to extract negative components. We crossmatched the combined polarised components against the extracted Stokes I components using a match radius. This match radius was chosen to avoid contamination from matches between sidelobes of bright Stokes I components and the leakage of the bright central component into Stokes V, though it is restrictive as positional offsets between Stokes I and V up to exist for genuine circularly polarised source components. We selected this restricted sample to investigate robust methods to reject imaging artefacts in future searches, and to reduce the search volume to a reasonable size.
selavy models source components with 2D Gaussians that have an SNR dependent positional error (Condon, 1997) of
| (1) |
where is the component major axis. We added this uncertainty in quadrature to the astrometric accuracy discussed in § 2.2 to determine the positional uncertainty of each radio source, where the positional uncertainty corresponding to a component with major axis equal to the typical PSF major axis of is approximately .
We selected 850 components with fractional polarisation greater than per cent for visual inspection. This corresponds to 10 times the median circular polarisation leakage, and three times the excess leakage of per cent near mosaic corners. The majority of selected components were either imaging artefacts caused by leakage of bright Stokes I sidelobes, spurious noise near the edge of the image where sensitivity decreases, or components with extended structure associated with radio galaxies, which we excluded by visual inspection of the Stokes V and total intensity images. To aid further classification of our sample, we inspected image cutouts for the SUMSS, second epoch Molonglo Galactic Plane Survey (MGPS-2; Murphy et al., 2007), NRAO VLA Sky Survey (NVSS; Condon et al., 1998), TIFR GMRT Sky Survey (TGSS; Intema et al., 2017), GaLactic and Extragalactic All-sky MWA (GLEAM; Wayth et al., 2015; Hurley-Walker et al., 2017), and VLA Sky Survey (VLASS; Lacy et al., 2020) radio surveys, and produced radio spectral energy distributions (SEDs) and light curves for each candidate using the corresponding radio source catalogues, or upper limits in the case of a non-detection.
To identify optical and infra-red counterparts to our candidates we generated image cutouts from the Widefield Infra-red Survey Explorer (WISE; Wright et al., 2010), 2-Micron All Sky Survey (2MASS; Skrutskie et al., 2006), Panoramic Survey Telescope and Rapid Response System 1 (Pan-STARRS1; Chambers et al., 2016), and Skymapper (Onken et al., 2019) surveys. As very few stars are persistent radio sources, detection in multiple other radio surveys is suggestive of emission from background AGN. We calculated the WISE infra-red colours (see fig. 12, Wright et al., 2010) to distinguish these cases, as infra-red sources associated with background galaxies are typically reddened compared to stars. We also looked for evidence of the persistent X-ray and ultraviolet emission associated with some active stars in the ROSAT All Sky Survey (RASS; Boller et al., 2016) and Galaxy Evolution Explorer (GALEX; Morrissey et al., 2007) surveys.
We excluded five components that were a positional match for previously known radio sources attributed to bright AGN, either due to the shape of the radio SED, the WISE colours, or explicit identification in the literature. We attribute the Stokes V flux density for these sources to polarisation leakage as they are located near the mosaic edge at where leakage increases, and AGN typically display fractional polarisation of at most 2 per cent (Macquart, 2002). We identified 37 components as known pulsars, and six significantly polarised sources without any multi-wavelength counterpart or catalogued identification, which will be the subject of separate publications.
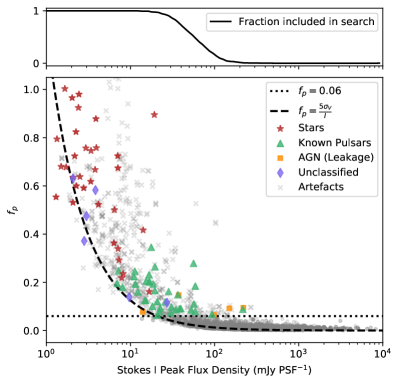
We queried the SIMBAD and NED databases for stars within a radius of candidate positions, which is sufficient to account for motion of the highest known proper motion stars over a 20 year period. We applied positional corrections to all query results with available proper motion parameters from Gaia Data Release 2, and identified 33 components that were a match with stars to within our positional uncertainty. Our classifications are summarised in Fig. 1 where we show the fractional polarisation of all extracted components as a function of . Below the minimum detectable fractional polarisation is determined by the detection limits in Stokes V rather than contamination from polarisation leakage or the filter we applied.
We quantified the false-positive rate for chance-alignment between our sources and unrelated stars by offsetting the positions of all Stokes V components, inclusive of artefacts, in random directions by and crossmatching the new positions against the SIMBAD database. This procedure produced no matches within , suggesting a false-positive rate of less than and an extremely low probability that any of our detections are due to chance alignment with background stars.
4 RESULTS
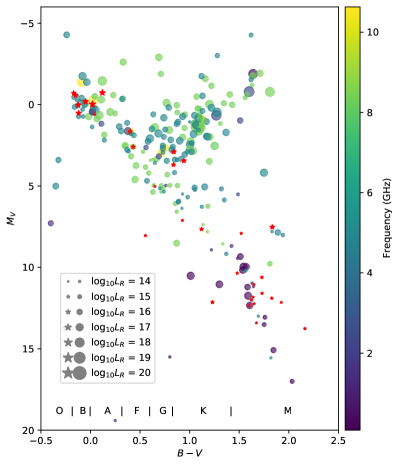
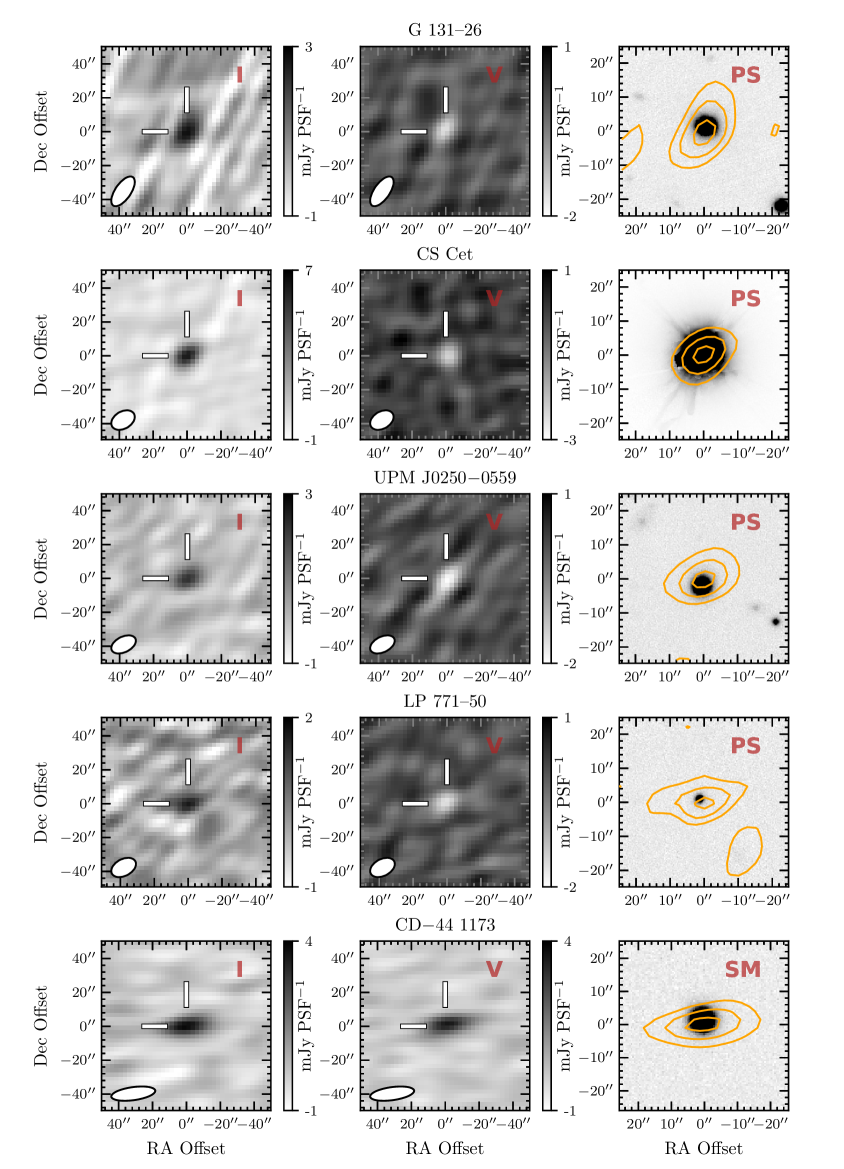
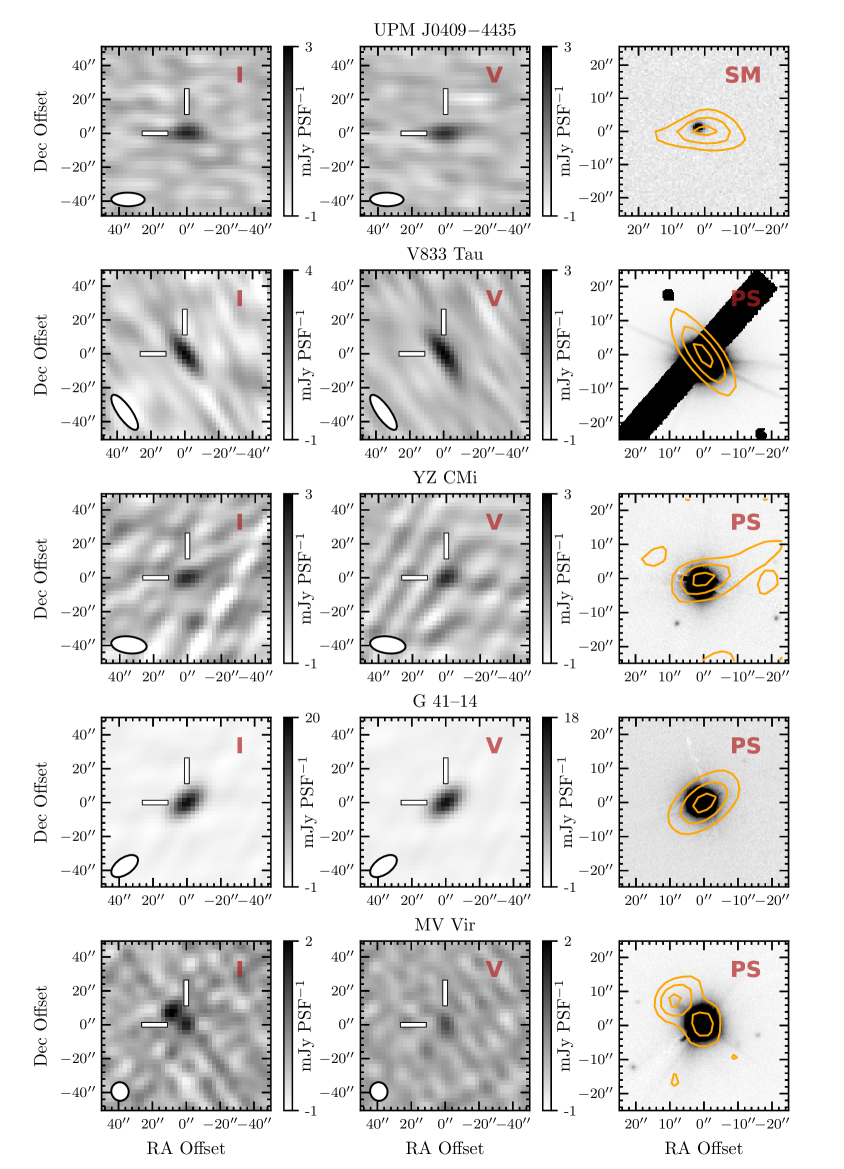
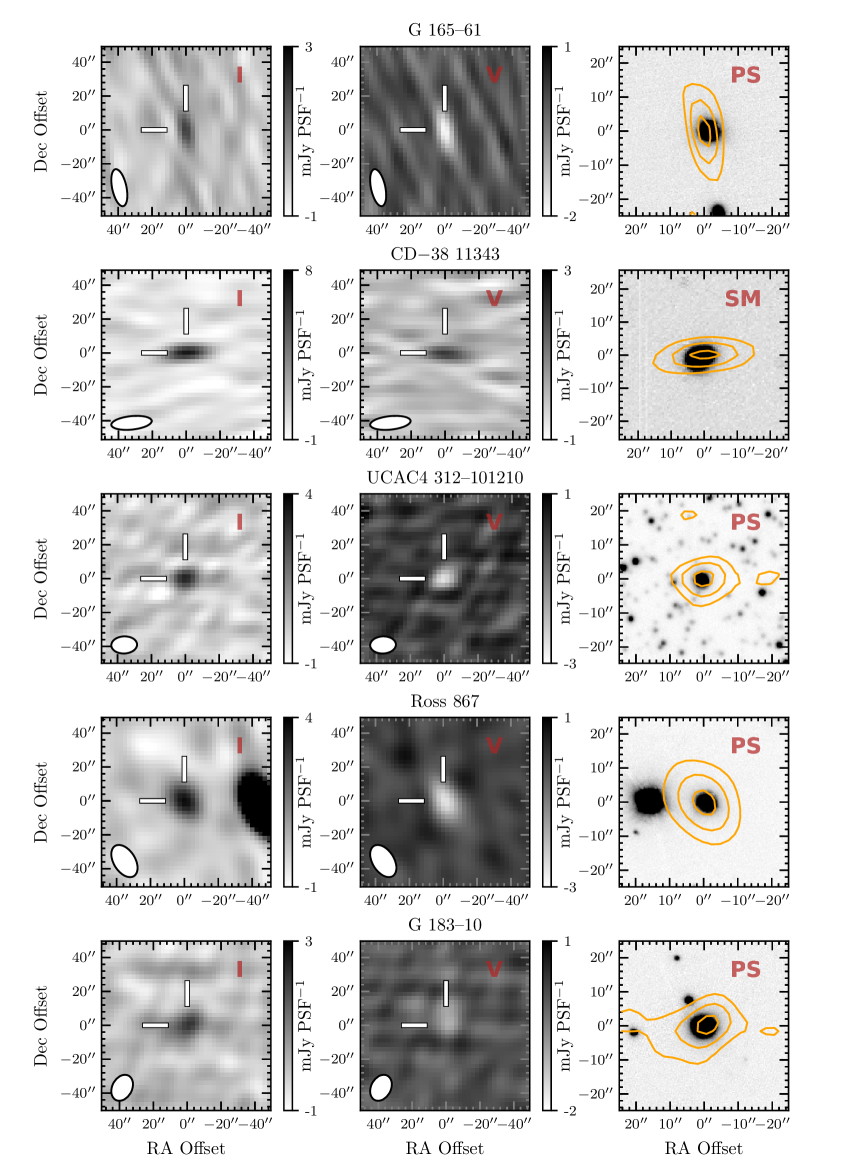
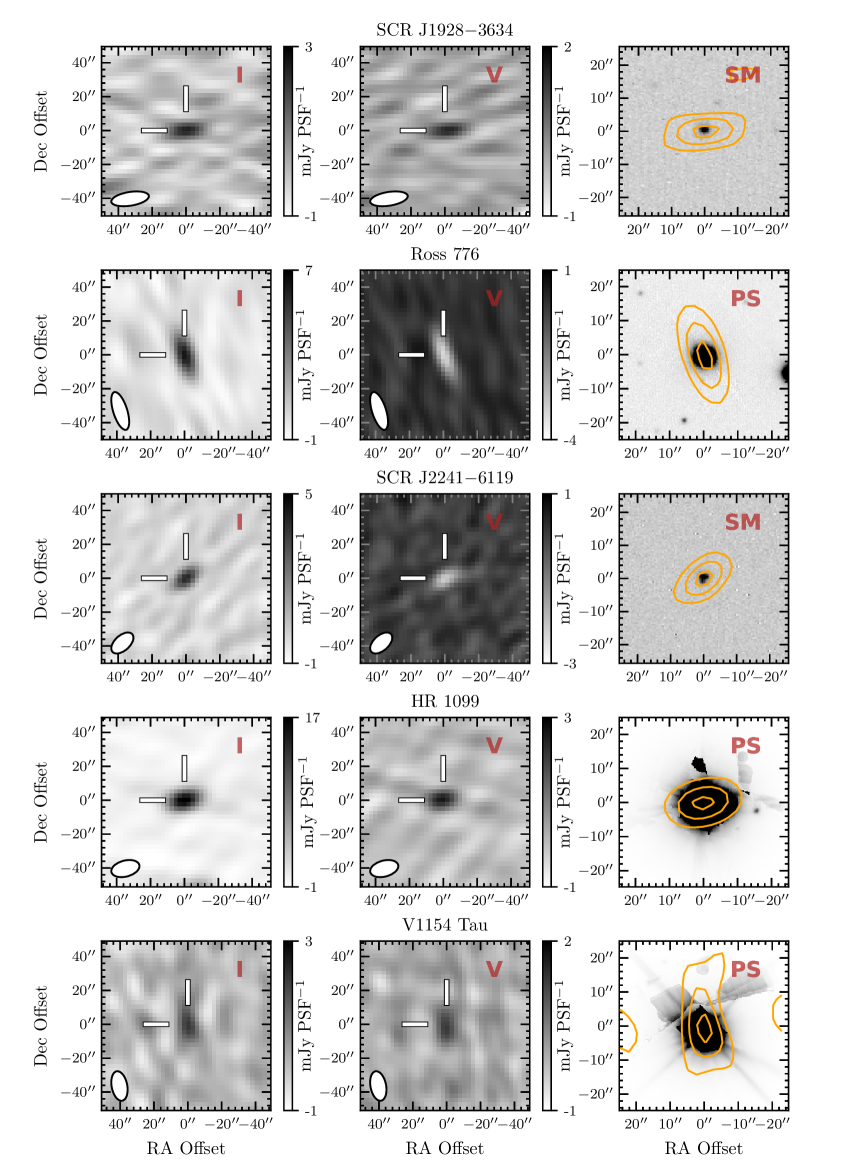
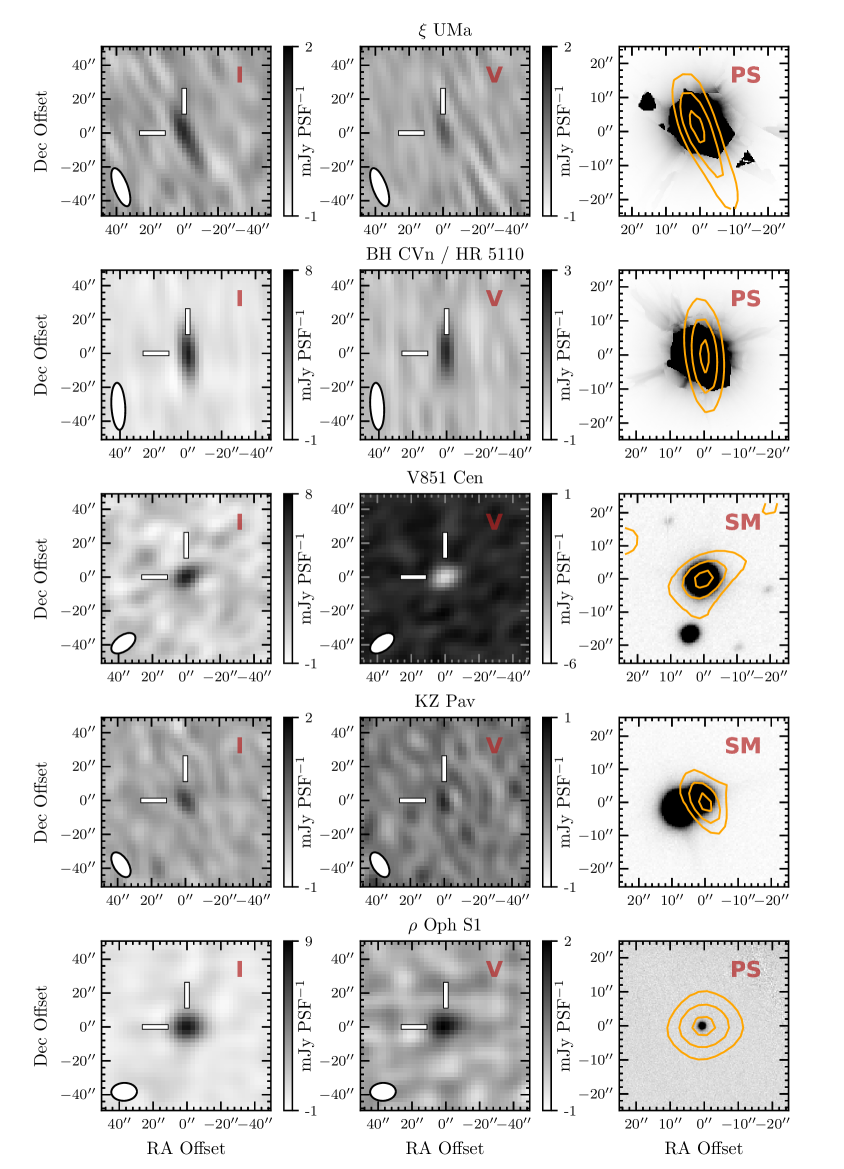
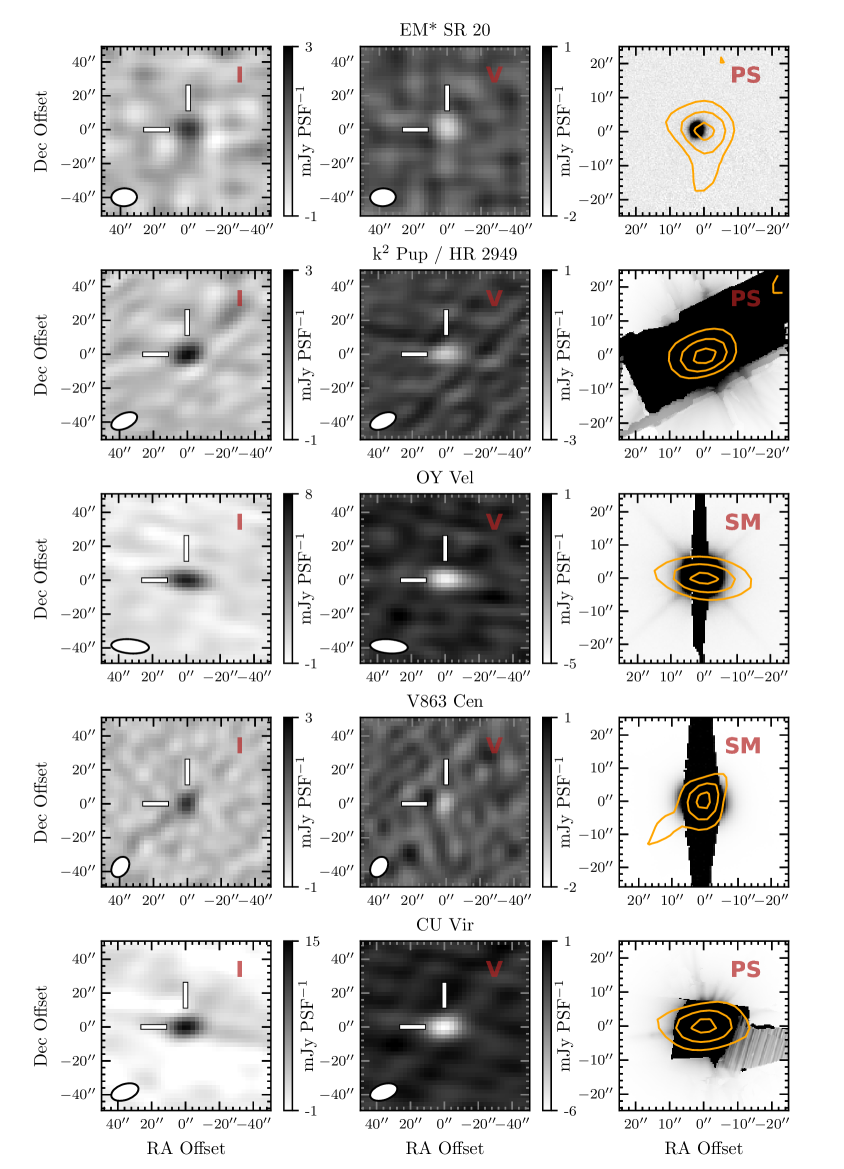
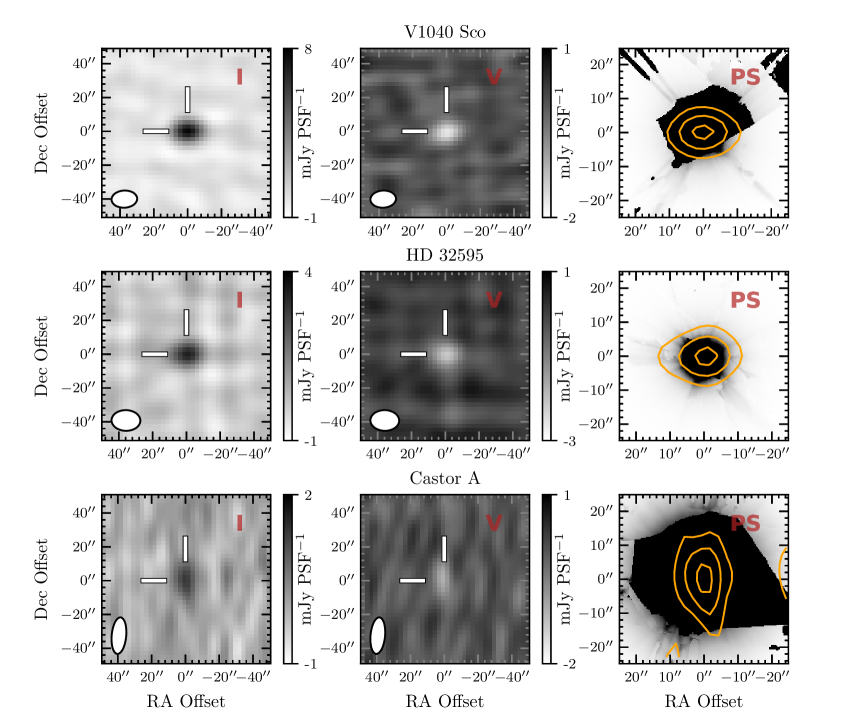
Table 2 lists the 33 radio stars detected within our sample, 23 of which have not previously been reported as radio-loud in the literature. Fig. 2 shows a radio-selected Hertzprung-Russell diagram with 231 stars from the Wendker catalogue (Wendker, 1995) colour-mapped by observing frequency. Our detections are overlaid as red stars and span the diagram, including magnetic chemically peculiar stars, young stellar objects, RS CVn and Algol binaries, and both chromospherically active and non-active K- and M-dwarfs. Fig. 3–9 show cutout images in Stokes I and Stokes V for each of the stars in our sample, and optical data from Pan-STARRS1 or Skymapper at declinations above and below respectively. We have applied astrometric corrections to the optical data to the RACS epoch to account for proper motion, and all images are centred on the radio position.
| Name | Spectral Class | RA (J2000) | Dec (J2000) | † | Ref. | (mas) | () | * | Radio Ref. | |
| Cool Dwarfs | ||||||||||
| G 131–26 | M5V | 00:08:53.89 | 20:50:19.39 | |||||||
| CS Cet | K0IV(e) | 01:06:48.93 | 22:51:23.20 | |||||||
| UPM J02500559 | 02:50:40.29 | 05:59:50.89 | ||||||||
| LP 771–50 | M5e | 02:56:27.19 | 16:27:38.53 | |||||||
| CD44 1173 | K6.5Ve | 03:31:55.74 | 43:59:14.92 | |||||||
| UPM J04094435 | 04:09:32.15 | 44:35:38.19 | ||||||||
| V833 Tau | K2.5Ve | 04:36:48.60 | 27:07:55.04 | Güd92 | ||||||
| YZ CMi | M4Ve | 07:44:39.67 | 03:33:01.79 | Dav78, Vil19 | ||||||
| G 41–14 | M3.5V | 08:58:56.75 | 08:28:19.76 | |||||||
| MV Vir | K5.5Vkee | 14:14:21.16 | 15:21:25.64 | |||||||
| G 165–61 | M4.5Ve | 14:17:02.04 | 31:42:44.26 | |||||||
| CD38 11343 | M3Ve+M4Ve | 16:56:48.49 | 39:05:38.96 | |||||||
| UCAC4 312–101210 | 17:02:07.98 | 27:40:28.67 | ||||||||
| Ross 867 | M4.5V | 17:19:52.68 | 26:30:09.94 | Jac87, Whi89, Qui20 | ||||||
| G 183–10 | M3.5Ve | 17:53:00.26 | 16:54:59.07 | |||||||
| SCR J19283634 | 19:28:33.74 | 36:34:39.21 | ||||||||
| Ross 776 | M3.3 | 21:16:06.14 | 29:51:52.37 | |||||||
| SCR J22416119 | 22:41:44.80 | 61:19:33.24 | ||||||||
| Interacting Binaries | ||||||||||
| HR 1099 | K2Vnk | 03:36:47.19 | 00:35:13.52 | Mut84 | Mut84, Whi95, Sle08, Rav10 | |||||
| V1154 Tau | B6III/IV | 05:05:37.70 | 23:03:41.56 | |||||||
| UMa | F8.5V | 11:18:10.18 | 31:31:31.12 | Gri98 | ||||||
| BH CVn / HR 5110 | A6m+KIV | 13:34:47.90 | 37:10:56.78 | Abb15 | Mut87, Whi95, Abb15 | |||||
| V851 Cen | K0III | 13:44:00.96 | 61:21:58.92 | Kar04 | ||||||
| KZ Pav | F6V | 20:58:39.76 | 70:25:20.58 | Sur10 | Sle87, Ste89 | |||||
| Young Stellar Objects | ||||||||||
| Oph S1 | B3 | 16:26:34.11 | 24:23:28.19 | And91 | Fal81, And88, And91 | |||||
| EM* SR 20 | G7 | 16:28:32.50 | 24:22:45.80 | |||||||
| Magnetic Chemically Peculiar Stars | ||||||||||
| Pup / HR 2949 | B3IV He-W | 07:38:49.74 | 26:48:12.84 | |||||||
| OY Vel | ApSi | 09:01:44.44 | 52:11:19.81 | |||||||
| V863 Cen | B6IIIe He-S | 12:08:05.06 | 50:39:40.79 | |||||||
| CU Vir | ApSi | 14:12:15.72 | 02:24:34.19 | Tri00, Let06, Rav10, Lo12 | ||||||
| V1040 Sco | B2Ve He-S | 15:53:55.82 | 23:58:41.33 | Let18 | Con98, Mur10, Let18 | |||||
| Hot Spectroscopic Binaries | ||||||||||
| HD 32595 | B8 | 05:04:49.06 | 13:18:32.86 | |||||||
| Castor A | A1V+dMe | 07:34:35.49 | 31:53:14.63 | Tor02 | Sch94, Hel99 | |||||
-
*
corresponds to right handed circular polarisation.
-
†
taken as: for single stars as calculated from Gaia DR2 photometry (Collaboration, 2018), the inter-binary region for interacting binaries, or otherwise from literature where indicated by a reference code.
-
•
Reference codes: Abb15 (Abbuhl et al., 2015), And88 (André et al., 1988), And91 (André et al., 1991), Con98 (Condon et al., 1998), Dav78 (Davis et al., 1978), Fal81 (Falgarone & Gilmore, 1981), Gru12 (Grunhut et al., 2012), Gri98 (Griffin, 1998), Güd92 (Güdel, 1992), Hel99 (Helfand et al., 1999), Jac87 (Jackson et al., 1987), Kar04 (Karataş et al., 2004), Let06 (Leto et al., 2006), Let18 (Leto et al., 2018), Lo12 (Lo et al., 2012), Mut84 (Mutel et al., 1984), Mut87 (Mutel et al., 1987), Mur10 (Murphy et al., 2010), Qui20 (Quiroga-Nuñez et al., 2020), Rav10 (Ravi et al., 2010), Sch94 (Schmitt et al., 1994), Sle87 (Slee et al., 1987), Sle08 (Slee et al., 2008), Ste89 (Stewart et al., 1989), Tor02 (Torres & Ribas, 2002), Tri00 (Trigilio et al., 2000), Sur10 (Sürgit et al., 2010), Vil19 (Villadsen & Hallinan, 2019), Whi89 (White et al., 1989), Whi95 (White & Franciosini, 1995)
4.1 Cool Dwarfs
We identify 18 K- and M-dwarf stars within our sample, 15 of which have no previously reported radio detection. Cool dwarfs typically produce non-thermal radio emission in magnetically confined coronae. Non-thermal, incoherent gyrosynchrotron emission dominates at C/X-band, and coherent emission processes at lower frequencies where gyrosynchrotron emission becomes optically-thick (Güdel, 2002). Our cool dwarf detections have fractional polarisation ranging from per cent. Notes on individual sources are presented below.
G 131–26 (see Fig. 3) is an M5V flare star demonstrating H (Hawley et al., 1996; Newton et al., 2017; Jeffers et al., 2018) and ultraviolet (Jones & West, 2016) activity, and is a strong variable X-ray source (Hambaryan et al., 1999).
CS Cet (see Fig. 3) is a spectroscopic binary with a K0IVe primary which has demonstrated BY Dra type photometric variability due to rotation of starspots (Watson et al., 2000). This system is a bright ultraviolet and X-ray source (Haakonsen & Rutledge, 2009; Beitia-Antero & de Castro, 2016) and is chromospherically active in Ca ii H and K and H lines (Isaacson & Fischer, 2010).
LP 771–50 (see Fig. 3) is an M5Ve-type high-proper-motion star demonstrating H line emission (Cruz & Reid, 2002).
CD44 1173 (see Fig. 3) is a young K6.5Ve star in the Tucana-Horologium moving group with rotationally modulated optical variability (Messina et al., 2010), and has previously exhibited ultraviolet flares (Loyd et al., 2018) and X-ray activity (Haakonsen & Rutledge, 2009).
V833 Tau (see Fig. 4) is an extremely active K2.5Ve BY Dra variable demonstrating both X-ray flares (Fuhrmeister & Schmitt, 2003) and photometric variability due to large starspot covering fractions (Oláh et al., 2001). Güdel (1992) reported a radio flux of at for this star which they attribute to gyrosynchrotron emission due to the observed brightness temperature. We detect 76 per cent left circularly-polarised emission with , which corresponds to a brightness temperature of and is consistent with optically-thin gyrosynchrotron emission.
YZ CMi (see Fig. 4) is an M4Ve eruptive variable known to produce bright optical flares (Kowalski et al., 2010), and is a well known radio flare star (Davis et al., 1978; Abada-Simon & Aubier, 1997). Highly circularly-polarised radio bursts have been detected from this star at centimetre wavelengths (Villadsen & Hallinan, 2019) attributed to ECM emission from within extreme coronal plasma cavities which is modulated by stellar rotation. We detect 98 per cent left circularly-polarised emission, which is consistent with the handedness observed by Villadsen & Hallinan (2019).
G 41–14 (see Fig. 4) is an M3.5V triple star system with recorded optical flares (Martínez et al., 2020) and H (Hawley et al., 1996; Newton et al., 2017; Jeffers et al., 2018) and ultraviolet (Miles & Shkolnik, 2017) activity, but no previously reported radio emission. The star was included in a radio interferometric search of nearby stars for planetary companions (Bower et al., 2009) but no detections are reported. A FIRST radio source is reported from the RACS position and attributed to an SDSS galaxy (Thyagarajan et al., 2011). Proper motion correction of G 41–14 to the FIRST epoch results in a separation from the FIRST position, indicating that the star may have been the origin of the radio emission. G 41–14 was detected in RASS (Fuhrmeister & Schmitt, 2003) and is flagged as displaying X-ray flares.
MV Vir / HD 124498 (see Fig. 4) is a binary system with a K5.5Vkee-type primary and an unclassified secondary. The system exhibits strong chromospheric Ca ii H and K line emission (Boro Saikia et al., 2018) and is a bright ultraviolet (Ansdell et al., 2014) and X-ray source (Haakonsen & Rutledge, 2009). We detect 68 per cent left circularly-polarised emission with positioned from HD 124498A and from HD 124489B. Both components are within our positional uncertainty, so we can not distinguish which component is the source of emission. A neighbouring, unpolarised radio source is also visible in total intensity, with the combined source components resembling the morphology of a double-lobed radio galaxy. The high fractional polarisation of our detection is most easily explained if originating from MV Vir, and as both stars are separated from the neighbouring source we believe it is an unrelated background object.
G 165–61 (see Fig. 5) is an M4.5V spectroscopic binary that demonstrates both H (Newton et al., 2017) and ultraviolet (Jones & West, 2016) activity. G 165–61 has a rotational period of 113.6 days (Newton et al., 2016), while M-dwarf radio bursts are typically associated with young, fast rotators (McLean et al., 2012), and only a small fraction of day period M-dwarfs demonstrate other indicators of magnetic activity (West et al., 2015; Mondrik et al., 2018).
CD38 11343 (see Fig. 5) is an M3Ve + M4Ve binary system of flare stars (Tamazian & Malkov, 2014). The A component has been associated with flaring X-ray emission (Fuhrmeister & Schmitt, 2003; Wright et al., 2011) and periodic optical variability due to rotation of starspots (Kiraga, 2012). The angular separation between the stars is of the order of our positional uncertainty at , so that it is not clear from which star the emission originates.
Ross 867 and Ross 868 (see Fig. 5) are a visual binary system of M4.5V and M3.5V flare stars with similar stellar properties. Both components have demonstrated optical flaring (Tamazian & Malkov, 2014) and photospheric variability (Kiraga, 2012), ultraviolet (Jones & West, 2016) and X-ray (Fuhrmeister & Schmitt, 2003) variability, and H activity (Hawley et al., 1996). Ross 867 is a well known radio-loud star (Jackson et al., 1987; White et al., 1989) and in particular has demonstrated radio bursts with moderate circular polarisation (Quiroga-Nuñez et al., 2020), while Ross 868 has never been detected at radio wavelengths. We detect 67 per cent right circularly-polarised emission with unambiguously associated with Ross 867, which is separated from Ross 868 by .
G 183–10 (see Fig. 5) is an M4V-type star with no significant ultraviolet (Ansdell et al., 2014) or H (Jeffers et al., 2018) activity, and no previously reported radio detection.
Ross 776 (see Fig. 6) is an M3.3V flare star (Tamazian & Malkov, 2014) showing both H (Hawley et al., 1996; West et al., 2015) and ultraviolet activity (Jones & West, 2016), and has previously demonstrated X-ray flaring (Fuhrmeister & Schmitt, 2003). This star is a young, rapid rotator, with a photometric rotation period (Newton et al., 2016).
UPM J02500559, UPM J04094435, UCAC4 312101210, SCR J19283634, and SCR J22416119 (see Fig. 3–6) are high proper motion stars without spectral classification, though photometric colour indices imply these are M-class stars (Lépine & Gaidos, 2011; Winters et al., 2011; Frith et al., 2013). SCR J22416119 has also been proposed as an M7 ultra-cool dwarf from analysis of Gaia colours (Reylé, 2018).
4.2 Interacting Binaries
We identify 6 interacting binary systems of RS CVn and Algol type, three of which have no previously reported radio detection. RS CVn and Algol binaries are known to possess strong magnetic fields generated by rapid, tidally-induced rotation periods. The radio emission associated with these stars is generally non-thermal with moderate circular polarisation, with both quiescent gyrosynchrotron emission (Jones et al., 1994; Abbuhl et al., 2015) and coherent radio bursts (van den Oord & de Bruyn, 1994; White & Franciosini, 1995; Slee et al., 2008) observed. Our detections in this category have a fractional polarisation between per cent. Notes on individual sources are presented below.
HR 1099 / V711 Tau (see Fig. 6) is a K2:Vnk/K4 RS CVn binary with extensive study at radio frequencies, and is known to exhibit both strong radio flaring and periods of quiescent emission. VLBI detections have been made during the quiescent period at (Mutel et al., 1984) with a source size comparable to the size of the binary system, and during a flare at (Ransom et al., 2002) revealing milliarcsecond structure. HR 1099 is also known to emit highly polarised, coherent radio bursts which are attributed to ECM driven auroral emission (Slee et al., 2008).
V1154 Tau (see Fig. 6) is a B6III/IV-type eclipsing Algol binary with no previously reported radio detections.
UMa (see Fig. 7) is an F8.5:V+G2V RS CVn binary system with multiple sub-components. The cooler secondary component demonstrates X-ray emission (Ball et al., 2005) attributed to activity induced by a orbit with one of its sub-components. This system has been frequently targeted by radio observations (Spangler et al., 1977; Morris & Mutel, 1988; Drake et al., 1989, 1992; Bastian et al., 2000) but no detections have previously been reported. The system includes a T8.5 brown dwarf in a wide orbit (Wright et al., 2013), though this companion is separated by from our radio detection and cannot explain the observed emission.
BH CVn / HR 5110 (see Fig. 7) is an F2IV/K2IV binary known to demonstrate large X-ray flares (Graffagnino et al., 1995), and is one of the most radio active RS CVn systems. VLBI observations at show radio emission originating from the K-type secondary (Abbuhl et al., 2015), which is typically unpolarised at and consistently right handed at higher frequencies (White & Franciosini, 1995). Non-eclipsing RS CVn systems such as this typically demonstrate a reversal in the polarisation sense between 1.4 to (Mutel et al., 1987), which is consistent with our left handed detection at . Our detection is 34 per cent circularly-polarised, slightly above the 20 per cent levels detected at higher frequencies (White & Franciosini, 1995).
V851 Cen (see Fig. 7) is a K0III RS CVn binary with chromospheric activity in both H and Ca ii H and K lines (Cincunegui et al., 2007), and has previously demonstrated X-ray variability (Kashyap & Drake, 1999; Haakonsen & Rutledge, 2009; Kiraga, 2012). The system has been targeted in two radio surveys due to the chromospheric activity (Collier et al., 1982; Slee et al., 1987) but was undetected in both.
KZ Pav (see Fig. 7) is a F6V/K4IV Algol binary of the EA2-type, and has previously demonstrated variable radio emission at with one detection in 12 epochs (Slee et al., 1987). The star has also been observed at with persistent detections over a 24 hour period (Budding et al., 2001). Both detections correspond to a brightness temperature of order assuming emission originates from the inter-binary region.
4.3 Young Stellar Objects
We identify two young stellar objects within our sample. Pre-main sequence stars are magnetically-active and known to produce both highly polarised coherent emission (Smith et al., 2003) and non-thermal gyrosynchrotron emission (André, 1996). Non-thermal emission is less commonly observed in classical T-Tauri (CTT) stars presumably due to absorption in the ionised circumstellar wind, though exceptions exist associated with extended magnetospheric structures such as the non-thermal radio knots in the jets of DG Tau (Ainsworth et al., 2014). Notes on individual sources are presented below.
Oph S1 (see Fig. 7) is a B3 T-Tauri star in the Rho Ophiuchi cloud complex with a kilogauss globally organised magnetic field, and is a persistent radio source with a faint wide halo and circularly-polarised core (Falgarone & Gilmore, 1981; André et al., 1988). VLBI observation of this star at has resolved the core as an region of optically-thin gyrosynchrotron emission with brightness temperature of order (André et al., 1991). We detect 23 per cent left circularly-polarised emission with , which is comparable to the and measurements by André et al. 1988.
EM* SR 20 (see Fig. 8) is a binary CTT system in the Rho Ophiuchi cloud complex, with the G7 primary embedded in a protostellar disk (McClure et al., 2008). This star has been targeted at millimetre wavelengths for cold dust continuum emission, but is undetected at a limit (Nürnberger et al., 1998).
4.4 Magnetic Chemically Peculiar Stars
Compared to later-type stars, magnetically driven, non-thermal emission is less common in hot stars, presumably due to the lack of an interior convective zone. The exception are the MCP stars, which have strong, globally organised magnetic fields, and have been observed to produce both gyrosynchrotron emission driven by equatorial current sheets (Linsky et al., 1992), and coherent auroral emission (Trigilio et al., 2011). We identify five MCP stars within our sample with polarisation fractions between per cent. Notes on individual sources are presented below.
k2 Pup / HR 2949 (see Fig. 8) is a helium-weak B3IV star with kilogauss surface magnetic fields and helium spectral line variability suggestive of chemically peculiar spots, in analogue to the cooler Bp/Ap stars (Shultz et al., 2015). There are no reported radio detections of this star.
OY Vel (see Fig. 8) is an ApSi magnetic chemically peculiar star and an CVn variable with no previously reported radio detections.
V863 Cen (see Fig. 8) is a chemically peculiar B6IIIe helium-strong star with kilogauss surface magnetic fields (Briquet et al., 2003; Kochukhov & Bagnulo, 2006) and no previously reported radio emission. Radio detections of Be stars are typically attributed to interactions between stellar wind outflows and a circumstellar disk resulting in free-free emission with low fractional polarisation, though a few notable variable detections are suggestive of a non-thermal mechanism (Dougherty et al., 1991; Skinner et al., 1993). Our detection is inconsistent with free-free emission, with 60 per cent left circularly-polarised emission that is likely driven by a non-thermal mechanism.
CU Vir (see Fig. 8) is an ApSi CVn variable, and a well known radio-loud magnetic chemically peculiar star. Quiescent gyrosynchrotron emission with rotationally modulated variability has been observed from CU Vir (Leto et al., 2006), as well as two 100 per cent right circularly-polarised pulses that consistently repeat each rotation period (Trigilio et al., 2000; Ravi et al., 2010; Lo et al., 2012) and are attributed to ECM emission.
V1040 Sco (see Fig. 9) is a helium-strong B2.5V star with a kilogauss global magnetic field, and is the most rapidly rotating magnetic B star known (Grunhut et al., 2012). This star has been detected at radio frequencies from 1.4 to (Condon et al., 1998; Murphy et al., 2010; Leto et al., 2018), with persistent emission attributed to gyrosynchrotron emission in the rigidly rotating magnetosphere. We measure a total intensity flux density of which is in agreement with that expected from extrapolation of the gyrosynchrotron spectrum to . Leto et al. (2018) measure circular polarisation of order 10 per cent at decreasing to order 5 per cent at , undergoing a sign reversal from left handed at high frequency to right handed below . This is also in agreement with our measurement of 22 per cent right handed circular polarisation.
4.5 Hot Spectroscopic Binaries
Two stars in our sample are hot, early-type stars that lack identified global magnetic fields or chemical peculiarities, and which have an unclassified spectroscopic binary companion. Chemically regular early-type stars are not expected to generate flares due to the lack of a conventional dynamo (Pedersen et al., 2016), and do not demonstrate other common features associated with non-thermal, polarised radio emission. Notes on individual sources are presented below.
HD 32595 (see Fig. 9) is a spectroscopic binary with a chemically regular B8 primary, and no previously reported radio detections.
Castor (see Fig. 9) is a triple binary system, where Castor A and B are both spectroscopic binaries consisting of A-type primaries and dMe secondaries, and Castor C is a binary dMe system. The Castor A system has been detected previously at , , and (Schmitt et al., 1994). Our detection is separated by from Castor A and from Castor B, so the emission is likely associated with one of the stars in Castor A.
5 DISCUSSION
5.1 Emission Mechanism
We calculated the Rayleigh-Jeans brightness temperature of our detections according to
| (2) |
where is the Boltzmann constant, is the observing frequency, is the length scale of an assumed emission region and is the stellar distance. We have assumed an upper limit to the emission region of for detections associated with single stars, and three times the binary separation distance for interacting binary systems, except where the emission region has been previously determined with VLBI. As the true emission region may be smaller than our assumed upper limit, the derived brightness temperature for each of our detections are lower limits, and range from .
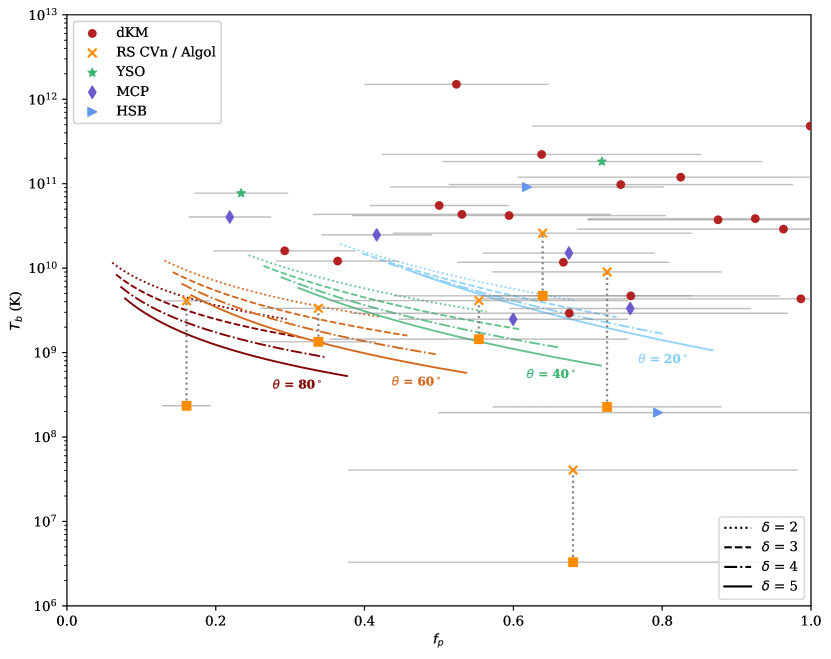
In Fig. 10 we show the position of our detections in a brightness temperature–fractional polarisation phase space. We show empirical models of the maximum brightness temperature of optically-thin, non-thermal gyrosynchrotron emission derived from Dulk (1985) at viewing angles of , and electron power-law energy index of . Each model is limited to the cyclotron harmonic number range , with harmonic number increasing monotonically along the curves from lower right to upper left.
The fractional polarisation of optically-thick gyrosynchrotron emission is typically less than 20 per cent (Dulk & Marsh, 1982) and insufficient to explain the majority of our detections. The RS CVn and Algol type binary detections are consistent with optically-thin, non-thermal gyrosynchrotron emission, while the majority of K- and M- dwarf, YSO, and MCP star detections occupy a region with too high to explain for the observed fractional polarisation, and are likely driven by a coherent emission process.
Our upper limit assumptions on the emission region require that the orientation of the magnetic field varies significantly in the source region, which in turn limits the fractional circular polarisation due to contributions from both left and right hand polarised emission. Our detections with high degrees of circular polarisation are therefore likely driven by sources in a much smaller region with a correspondingly higher brightness temperature, further suggesting a coherent emission process.
5.2 Detection Rates
We detected 33 radio stars within the covered RACS survey area of with detections evenly distributed on the sky, corresponding to a surface density of with errors given by 95 per cent Poisson confidence intervals. Our survey was limited to due to the lack of on-axis polarisation leakage calibration which has now been applied to available RACS data, and we further restricted our search to positional offsets between Stokes I and V of less than to reduce contamination from imaging artefacts. Our detection rate is therefore a lower limit to the surface density of radio stars at .
As all detected stars are located within a distance of , we assume they sample a Euclidean population of radio stars and follow a cumulative flux density distribution . The FIRST survey for radio stars (Helfand et al., 1999) detected 26 stars in a survey area of above a flux density of . Once scaled to the RACS sensitivity, this corresponds to a surface density of which is comparable to our result.
We extrapolate the number of radio stars detected in this survey to hypothetical future surveys with ASKAP. Scaling our results to a deep RMS survey of the entire sky south of implies a surface density of detectable radio stars of and total detections. A shallow but frequent survey covering to an RMS of should produce detections per epoch with a surface density of , and would probe the duty cycle and luminosity distribution of individual variable radio stars.
As the majority of our K- and M-type dwarf detections are inconsistent with incoherent gyrosynchrotron emission and are likely driven by coherent bursts, we also calculate the surface density of these detections alone for comparison to previous flare rate estimates in the literature. We detected 18 K- and M-type dwarfs, assuming the detection of Castor A can be attributed to the dMe companion, which results in a surface density of radio-loud cool dwarfs at of . In comparison, Villadsen & Hallinan (2019) report an M-dwarf transient density at of once scaled to the RACS sensitivity, which implies RACS should produce M-dwarf detections. This difference may reflect an increase in cool star radio activity at , or the selection of six highly active M-dwarfs in the Villadsen & Hallinan (2019) study which are not representative of radio flare rates in the larger population.
6 CONCLUSIONS
We have completed the first all-sky circular polarisation search for radio stars at centimetre wavelengths within the Rapid ASKAP Continuum Survey, identifying 10 known radio stars and a further 23 with no previous radio detection. Our sample includes late-type dwarfs, interacting and chromospherically active binaries, young stellar objects, and magnetic chemically peculiar stars, demonstrating the variety of magnetically-active stars detectable with this technique. Many of our detections are highly polarised with brightness temperatures that are inconsistent with an incoherent emission mechanism. These stars are attractive targets for followup observations to determine the emission mechanism and further constrain the magnetospheric properties of the emission environment.
This survey represents a sample of polarised radio stars without any other selection bias and implies a lower limit to the surface density of radio stars above at of . Application of on-axis polarisation calibration to publicly released ASKAP data will allow lower fractional polarisation and fainter emission to be detected, and extension of this search technique to future ASKAP surveys will produce a significantly larger sample and the potential for detections in multiple epochs. These observations will present an opportunity to determine improved population statistics for the stellar parameters associated with non-thermal radio emission, and to study burst rates and energetics for thousands of individual stars.
Acknowledgements
We thank the anonymous referee for feedback that strengthened this work. We also thank Phil Edwards and Alec Thomson for helpful comments and suggestions. TM acknowledges the support of the Australian Research Council through grant FT150100099. JP, AZ, and JKL are supported by Australian Government Research Training Program Scholarships. DLK was supported by NSF grant AST-1816492. The Australian Square Kilometre Array Pathfinder is part of the Australia Telescope National Facility which is managed by CSIRO. Operation of ASKAP is funded by the Australian Government with support from the National Collaborative Research Infrastructure Strategy. ASKAP uses the resources of the Pawsey Supercomputing Centre. Establishment of ASKAP, the Murchison Radio-astronomy Observatory and the Pawsey Supercomputing Centre are initiatives of the Australian Government, with support from the Government of Western Australia and the Science and Industry Endowment Fund. We acknowledge the Wajarri Yamatji as the traditional owners of the Murchison Radio-astronomy Observatory site. The International Centre for Radio Astronomy Research (ICRAR) is a Joint Venture of Curtin University and The University of Western Australia, funded by the Western Australian State government. Parts of this research were supported by the ARC Centre of Excellence for All Sky Astrophysics in 3 Dimensions (ASTRO 3D), through project number CE170100013. This research made use of the following python packages: Astropy (Astropy Collaboration et al., 2013, 2018), a community-developed core Python package for Astronomy, matplotlib (Hunter, 2007), a Python library for publication quality graphics, NumPy (Van Der Walt et al., 2011; Harris et al., 2020), and pandas (Wes McKinney, 2010; McKinney, 2011).
Data Availability
The data analysed in this paper are accessible through the CSIRO ASKAP Science Data Archive (CASDA; Chapman et al., 2017) under project code AS110. Note that the images used in this paper may have properties that differ slightly from the publicly released versions.
References
- Abada-Simon & Aubier (1997) Abada-Simon M., Aubier M., 1997, A&AS, 125, 511
- Abbuhl et al. (2015) Abbuhl E., Mutel R. L., Lynch C., Güdel M., 2015, ApJ, 811, 33
- Adelman-McCarthy et al. (2008) Adelman-McCarthy J. K., et al., 2008, ApJS, 175, 297
- Ainsworth et al. (2014) Ainsworth R. E., Scaife A. M. M., Ray T. P., Taylor A. M., Green D. A., Buckle J. V., 2014, ApJ, 792, L18
- Andrae et al. (2018) Andrae R., et al., 2018, A&A, 616, A8
- André (1996) André P., 1996, in Taylor A. R., Paredes J. M., eds, Astronomical Society of the Pacific Conference Series Vol. 93, Radio Emission from the Stars and the Sun. pp 273–284
- André et al. (1987) André P., Montmerle T., Feigelson E. D., 1987, AJ, 93, 1182
- André et al. (1988) André P., Montmerle T., Feigelson E. D., Stine P. C., Klein K.-L., 1988, ApJ, 335, 940
- André et al. (1991) André P., Phillips R. B., Lestrade J.-F., Klein K.-L., 1991, ApJ, 376, 630
- Ansdell et al. (2014) Ansdell M., et al., 2014, ApJ, 798, 41
- Antonova et al. (2013) Antonova A., Hallinan G., Doyle J. G., Yu S., Kuznetsov A., Metodieva Y., Golden A., Cruz K. L., 2013, A&A, 549, A131
- Astropy Collaboration et al. (2013) Astropy Collaboration et al., 2013, A&A, 558, A33
- Astropy Collaboration et al. (2018) Astropy Collaboration et al., 2018, AJ, 156, 123
- Ball et al. (2005) Ball B., Drake J. J., Lin L., Kashyap V., Laming J. M., Garcia-Alvarez D., 2005, ApJ, 634, 1336
- Bastian et al. (2000) Bastian T. S., Dulk G. A., Leblanc Y., 2000, ApJ, 545, 1058
- Becker et al. (1995) Becker R. H., White R. L., Helfand D. J., 1995, ApJ, 450, 559
- Beitia-Antero & de Castro (2016) Beitia-Antero L., de Castro A. I. G., 2016, A&A, 596, A49
- Bieging et al. (1989) Bieging J. H., Abbott D. C., Churchwell E. B., 1989, ApJ, 340, 518
- Boller et al. (2016) Boller T., Freyberg M. J., Trümper J., Haberl F., Voges W., Nandra K., 2016, A&A, 588, A103
- Boro Saikia et al. (2018) Boro Saikia S., et al., 2018, A&A, 616, A108
- Bower et al. (2009) Bower G. C., Bolatto A., Ford E. B., Kalas P., 2009, ApJ, 701, 1922
- Bowman et al. (2013) Bowman J. D., et al., 2013, PASA, 30, 31
- Briggs (1995) Briggs D. S., 1995, PhD thesis, New Mexico Institute of Mining and Technology, http://www.aoc.nrao.edu/dissertations/dbriggs/
- Briquet et al. (2003) Briquet M., Aerts C., Lüftinger T., Cat P. D., Piskunov N. E., Scuflaire R., 2003, A&A, 413, 273
- Budding et al. (2001) Budding E., Marsden S. C., Slee O. B., 2001, PASA, 18, 140
- Chambers et al. (2016) Chambers K. C., et al., 2016, arXiv e-prints, p. arXiv:1612.05560
- Chapman et al. (2017) Chapman J., Dempsey J., Miller D., Heywood I., Pritchard J., Sangster E., Whiting M., Dart M., 2017, ASPC, 512, 73
- Cincunegui et al. (2007) Cincunegui C., Díaz R. F., Mauas P. J. D., 2007, A&A, 469, 309
- Collaboration (2018) Collaboration G., 2018, VizieR Online Data Catalog, p. I/345
- Collier et al. (1982) Collier A. C., Haynes R. F., Slee O. B., Wright A. E., Hillier D. J., 1982, MNRAS, 200, 869
- Condon (1997) Condon J. J., 1997, PASP, 109, 166
- Condon et al. (1998) Condon J. J., Cotton W. D., Greisen E. W., Yin Q. F., Perley R. A., Taylor G. B., Broderick J. J., 1998, AJ, 115, 1693
- Cornwell et al. (2011) Cornwell T., Humphreys B., Lenc E., Voronkov M., Whiting M., 2011, Technical report, ATNF ASKAP memorandum 27: ASKAP Science Processing, https://www.atnf.csiro.au/projects/askap/ASKAP-SW-0020.pdf. CSIRO, https://www.atnf.csiro.au/projects/askap/ASKAP-SW-0020.pdf
- Crosley & Osten (2018) Crosley M. K., Osten R. A., 2018, ApJ, 862, 113
- Crosley et al. (2016) Crosley M. K., et al., 2016, ApJ, 830, 24
- Cruz & Reid (2002) Cruz K. L., Reid I. N., 2002, AJ, 123, 2828
- Davis et al. (1978) Davis R. J., Lovell B., Palmer H. P., Spencer R. E., 1978, Nature, 273, 644
- Dougherty et al. (1991) Dougherty S., Taylor A., Waters L., 1991, A&A, 248, 175
- Drake et al. (1989) Drake S. A., Simon T., Linsky J. L., 1989, ApJS, 71, 905
- Drake et al. (1992) Drake S. A., Simon T., Linsky J. L., 1992, ApJS, 82, 311
- Dulk (1985) Dulk G., 1985, ARA&A, 23, 169
- Dulk & Marsh (1982) Dulk G. A., Marsh K. A., 1982, ApJ, 259, 350
- Falgarone & Gilmore (1981) Falgarone E., Gilmore W., 1981, A&A, 95, 32
- Fey et al. (2015) Fey A., et al., 2015, AJ, 150, 58
- Frith et al. (2013) Frith J., et al., 2013, MNRAS, 435, 2161
- Fuhrmeister & Schmitt (2003) Fuhrmeister B., Schmitt J. H. M. M., 2003, A&A, 403, 247
- Graffagnino et al. (1995) Graffagnino V. G., Wonnacott D., Schaeidt S., 1995, MNRAS, 275, 129
- Griffin (1998) Griffin R., 1998, The Observatory, 118, 273
- Grunhut et al. (2012) Grunhut J. H., Wade G. A., Rivinius T., Marcolino W. L. F., and R. H. T., 2012, Proceedings of the International Astronomical Union, 6, 190
- Güdel (1992) Güdel M., 1992, A&A, 264, L31
- Güdel (2002) Güdel M., 2002, ARA&A, 40, 217
- Guzman et al. (2019) Guzman J., et al., 2019, ASKAPsoft: ASKAP science data processor software, astrophysics source code library, record ascl:1912.003
- Haakonsen & Rutledge (2009) Haakonsen C. B., Rutledge R. E., 2009, ApJS, 184, 138
- Hambaryan et al. (1999) Hambaryan V., Neuhäuser R., Stelzer B., 1999, A&A, 345, 121
- Harris et al. (2020) Harris C. R., et al., 2020, Nature, 585, 357
- Hawley et al. (1996) Hawley S. L., Gizis J. E., Reid I. N., 1996, AJ, 112, 2799
- Helfand et al. (1999) Helfand D. J., Schnee S., Becker R. H., White R. L., McMahon R. G., 1999, AJ, 117, 1568
- Hotan et al. (2014) Hotan A., et al., 2014, PASA, 31, E041
- Hunter (2007) Hunter J. D., 2007, Computing In Science & Engineering, 9, 90
- Hurley-Walker et al. (2017) Hurley-Walker N., et al., 2017, MNRAS, 464, 1146
- Intema et al. (2017) Intema H. T., Jagannathan P., Mooley K. P., Frail D. A., 2017, A&A, 598, A78
- Isaacson & Fischer (2010) Isaacson H., Fischer D., 2010, ApJ, 725, 875
- Jackson et al. (1987) Jackson P. D., Kundu M. R., White S. M., 1987, in , Cool Stars, Stellar Systems, and the Sun. Springer Berlin Heidelberg, pp 103–105, doi:10.1007/3-540-18653-0_116, https://doi.org/10.1007/3-540-18653-0-116
- Jeffers et al. (2018) Jeffers S. V., et al., 2018, A&A, 614, A76
- Johnston et al. (2008) Johnston S., et al., 2008, Experimental Astronomy, 22, 151
- Jones & West (2016) Jones D. O., West A. A., 2016, ApJ, 817, 1
- Jones et al. (1994) Jones K. L., Stewart R. T., Nelson G. J., Duncan A. R., 1994, MNRAS, 269, 1145
- Kao et al. (2016) Kao M. M., Hallinan G., Pineda J. S., Escala I., Burgasser A., Bourke S., Stevenson D., 2016, ApJ, 818, 24
- Karataş et al. (2004) Karataş Y., Bilir S., Eker Z., Demircan O., 2004, MNRAS, 349, 1069
- Kashyap & Drake (1999) Kashyap V., Drake J. J., 1999, ApJ, 524, 988
- Kimball et al. (2009) Kimball A. E., Knapp G. R., Ivezić E., West A. A., Bochanski J. J., Plotkin R. M., Gordon M. S., 2009, ApJ, 701, 535
- Kiraga (2012) Kiraga M., 2012, Acta Astron., 62, 67
- Kochukhov & Bagnulo (2006) Kochukhov O., Bagnulo S., 2006, A&A, 450, 763
- Kowalski et al. (2010) Kowalski A. F., Hawley S. L., Holtzman J. A., Wisniewski J. P., Hilton E. J., 2010, ApJ, 714, L98
- Lacy et al. (2020) Lacy M., et al., 2020, PASP, 132, 035001
- Lenc et al. (2018) Lenc E., Murphy T., Lynch C. R., Kaplan D. L., Zhang S. N., 2018, MNRAS, 478, 2835
- Lépine & Gaidos (2011) Lépine S., Gaidos E., 2011, AJ, 142, 138
- Leto et al. (2006) Leto P., Trigilio C., Buemi C. S., Umana G., Leone F., 2006, A&A, 458, 831
- Leto et al. (2017) Leto P., Trigilio C., Buemi C. S., Umana G., Ingallinera A., Cerrigone L., 2017, MNRAS, 469, 1949
- Leto et al. (2018) Leto P., et al., 2018, MNRAS, 476, 562
- Linsky et al. (1992) Linsky J. L., Drake S. A., Bastian T. S., 1992, ApJ, 393, 341
- Lo et al. (2012) Lo K. K., et al., 2012, MNRAS, 421, 3316
- Loyd et al. (2018) Loyd R. O. P., Shkolnik E. L., Schneider A. C., Barman T. S., Meadows V. S., Pagano I., Peacock S., 2018, ApJ, 867, 70
- Macquart (2002) Macquart J.-P., 2002, PASA, 19, 43
- Martínez et al. (2020) Martínez R. R., Lopez L. A., Shappee B. J., Schmidt S. J., Jayasinghe T., Kochanek C. S., Auchettl K., Holoien T. W.-S., 2020, ApJ, 892, 144
- Mauch et al. (2003) Mauch T., Murphy T., Buttery H. J., Curran J., Hunstead R. W., Piestrzynski B., Robertson J. G., Sadler E. M., 2003, MNRAS, 342, 1117
- McClure et al. (2008) McClure M. K., et al., 2008, ApJ, 683, L187
- McConnell et al. (2016) McConnell D., et al., 2016, PASA, 33, E042
- McConnell et al. (2020) McConnell D., et al., 2020, Publ. Astron. Soc. Australia, 37, e048
- McKinney (2011) McKinney W., 2011, Python for High Performance and Scientific Computing, 14
- McLean et al. (2012) McLean M., Berger E., Reiners A., 2012, ApJ, 746, 23
- Messina et al. (2010) Messina S., Desidera S., Turatto M., Lanzafame A. C., Guinan E. F., 2010, A&A, 520, A15
- Miles & Shkolnik (2017) Miles B. E., Shkolnik E. L., 2017, AJ, 154, 67
- Mondrik et al. (2018) Mondrik N., Newton E., Charbonneau D., Irwin J., 2018, ApJ, 870, 10
- Morris & Mutel (1988) Morris D. H., Mutel R. L., 1988, AJ, 95, 204
- Morrissey et al. (2007) Morrissey P., et al., 2007, ApJS, 173, 682
- Murphy et al. (2007) Murphy T., Mauch T., Green A., Hunstead R. W., Piestrzynska B., Kels A. P., Sztajer P., 2007, MNRAS, 382, 382
- Murphy et al. (2010) Murphy T., et al., 2010, MNRAS, 402, 2403
- Mutel et al. (1984) Mutel R. L., Doiron D. J., Phillips R. B., Lestrade J. F., 1984, ApJ, 278, 220
- Mutel et al. (1987) Mutel R. L., Morris D. H., Doiron D. J., Lestrade J. F., 1987, AJ, 93, 1220
- Newton et al. (2016) Newton E. R., Irwin J., Charbonneau D., Berta-Thompson Z. K., Dittmann J. A., West A. A., 2016, ApJ, 821, 93
- Newton et al. (2017) Newton E. R., Irwin J., Charbonneau D., Berlind P., Calkins M. L., Mink J., 2017, ApJ, 834, 85
- Nürnberger et al. (1998) Nürnberger D., Brandner W., Yorke H. W., Zinnecker H., 1998, A&A, 330, 549
- Oláh et al. (2001) Oláh K., Strassmeier K. G., Kövári Z., Guinan E. F., 2001, A&A, 372, 119
- Onken et al. (2019) Onken C. A., et al., 2019, PASA, 36, E033
- Osten & Wolk (2009) Osten R. A., Wolk S. J., 2009, ApJ, 691, 1128
- Pedersen et al. (2016) Pedersen M. G., Antoci V., Korhonen H., White T. R., Jessen-Hansen J., Lehtinen J., Nikbakhsh S., Viuho J., 2016, MNRAS, 466, 3060
- Quiroga-Nuñez et al. (2020) Quiroga-Nuñez L. H., Intema H. T., Callingham J. R., Villadsen J., van Langevelde H. J., Jagannathan P., Shimwell T. W., Boven E. P., 2020, A&A, 633, A130
- Ransom et al. (2002) Ransom R. R., Bartel N., Bietenholz M. F., Lebach D. E., Ratner M. I., Shapiro I. I., Lestrade J.-F., 2002, ApJ, 572, 487
- Rau (2010) Rau U., 2010, PhD thesis, New Mexico Institute of Mining and Technology, http://www.aoc.nrao.edu/~rurvashi/DataFiles/UrvashiRV_PhdThesis.pdf
- Ravi et al. (2010) Ravi V., et al., 2010, MNRAS, 408, 99
- Reylé (2018) Reylé C., 2018, A&A, 619, L8
- Schmitt et al. (1994) Schmitt J., Güdel M., Predehl P., 1994, A&A, 287, 843
- Schneider et al. (2016) Schneider F. R. N., Podsiadlowski P., Langer N., Castro N., Fossati L., 2016, MNRAS, 457, 2355
- Shimwell et al. (2017) Shimwell T., et al., 2017, A&A, 598, A104
- Shultz et al. (2015) Shultz M., Rivinius T., Folsom C. P., Wade G. A., Townsend R. H. D., Sikora J., Grunhut J., Stahl O., 2015, MNRAS, 449, 3945
- Skinner et al. (1993) Skinner S. L., Brown A., Stewart R. T., 1993, ApJS, 87, 217
- Skrutskie et al. (2006) Skrutskie M. F., et al., 2006, AJ, 131, 1163
- Slee et al. (1987) Slee O. B., Nelson G. J., Stewart R. T., Wright A. E., Innis J. L., Ryan S. G., Vaughan A. E., 1987, MNRAS, 229, 659
- Slee et al. (2008) Slee O. B., Wilson W., Ramsay G., 2008, PASA, 25, 94
- Smith et al. (2003) Smith K., Pestalozzi M., Güdel M., Conway J., Benz A. O., 2003, A&A, 406, 957
- Spangler et al. (1977) Spangler S. R., Owen F. N., Hulse R. A., 1977, AJ, 82, 989
- Stewart et al. (1989) Stewart R., Slee O., Budding E., Coates D., Thompson K., Bunton J., 1989, Space Sci. Rev., 50, 367
- Sürgit et al. (2010) Sürgit D., Erdem A., Budding E., 2010, MNRAS, 407, 497
- Tamazian & Malkov (2014) Tamazian V. S., Malkov O. Y., 2014, Acta Astron., 64, 359
- Thyagarajan et al. (2011) Thyagarajan N., Helfand D. J., White R. L., Becker R. H., 2011, ApJ, 742, 49
- Torres & Ribas (2002) Torres G., Ribas I., 2002, ApJ, 567, 1140
- Trigilio et al. (2000) Trigilio C., Leto P., Leone F., Umana G., Buemi C., 2000, A&A, 362, 281
- Trigilio et al. (2011) Trigilio C., Leto P., Umana G., Buemi C. S., Leone F., 2011, ApJ, 739, 1
- Umana et al. (1998) Umana G., Trigilio C., Catalano S., 1998, A&A, 329, 1010
- Umana et al. (2015) Umana G., et al., 2015, MNRAS, 454, 902
- Van Der Walt et al. (2011) Van Der Walt S., Colbert S. C., Varoquaux G., 2011, Computing in Science & Engineering, 13, 22
- Vedantham et al. (2020) Vedantham H., et al., 2020, Nature Astronomy, 4, 577
- Villadsen & Hallinan (2019) Villadsen J., Hallinan G., 2019, ApJ, 871, 214
- Watson et al. (2000) Watson L. C., Hearnshaw J. B., Pollard K. R., Kilmartin P. M., Gilmore A. C., 2000, MNRAS, 315, 69
- Wayth et al. (2015) Wayth R. B., et al., 2015, PASA, 32, E05
- Wendker (1995) Wendker H., 1995, A&AS, 109, 177
- Wes McKinney (2010) Wes McKinney 2010, in Stéfan van der Walt Jarrod Millman eds, Proceedings of the 9th Python in Science Conference. pp 56–61, doi:10.25080/Majora-92bf1922-00a, https://doi.org/10.25080/Majora-92bf1922-00a
- West et al. (2015) West A. A., Weisenburger K. L., Irwin J., Berta-Thompson Z. K., Charbonneau D., Dittmann J., Pineda J. S., 2015, ApJ, 812, 3
- White & Franciosini (1995) White S. M., Franciosini E., 1995, ApJ, 444, 342
- White et al. (1989) White S. M., Jackson P. D., Kundu M. R., 1989, ApJS, 71, 895
- Whiting & Humphreys (2012) Whiting M., Humphreys B., 2012, PASA, 29, 371
- Winters et al. (2011) Winters J. G., Henry T. J., Jao W.-C., Subasavage J. P., Finch C. T., Hambly N. C., 2011, AJ, 141, 21
- Wright et al. (2010) Wright E. L., et al., 2010, AJ, 140, 1868
- Wright et al. (2011) Wright N. J., Drake J. J., Mamajek E. E., Henry G. W., 2011, ApJ, 743, 48
- Wright et al. (2013) Wright E. L., et al., 2013, AJ, 145, 84
- Zic et al. (2019) Zic A., et al., 2019, MNRAS, 488, 559
- van den Oord & de Bruyn (1994) van den Oord G., de Bruyn A., 1994, A&A, 286, 181