Super-klust: Another Way of Piecewise Linear Classification
Abstract
With our previous study, the Super-k algorithm, we have introduced a novel way of piecewise-linear classification. While working on the Super-k algorithm, we have found that there is a similar, and simpler way to explain for obtaining a piecewise-linear classifier based on Voronoi tessellations. Replacing the multidimensional voxelization and expectation-maximization stages of the algorithm with a distance-based clustering algorithm, preferably k-means, works as well as the prior approach. Since we are replacing the voxelization with the clustering, we have found it meaningful to name the modified algorithm, with respect to Super-k, as Supervised k Clusters or in short Super-klust. Similar to the Super-k algorithm, the Super-klust algorithm covers data with a labeled Voronoi tessellation, and uses resulting tessellation for classification. According to the experimental results, the Super-klust algorithm has similar performance characteristics with the Super-k algorithm.
keywords:
Supervised Learning, Piecewise Linear Classification, Distance-Based Clustering, Voronoi Tessellations1 Introduction
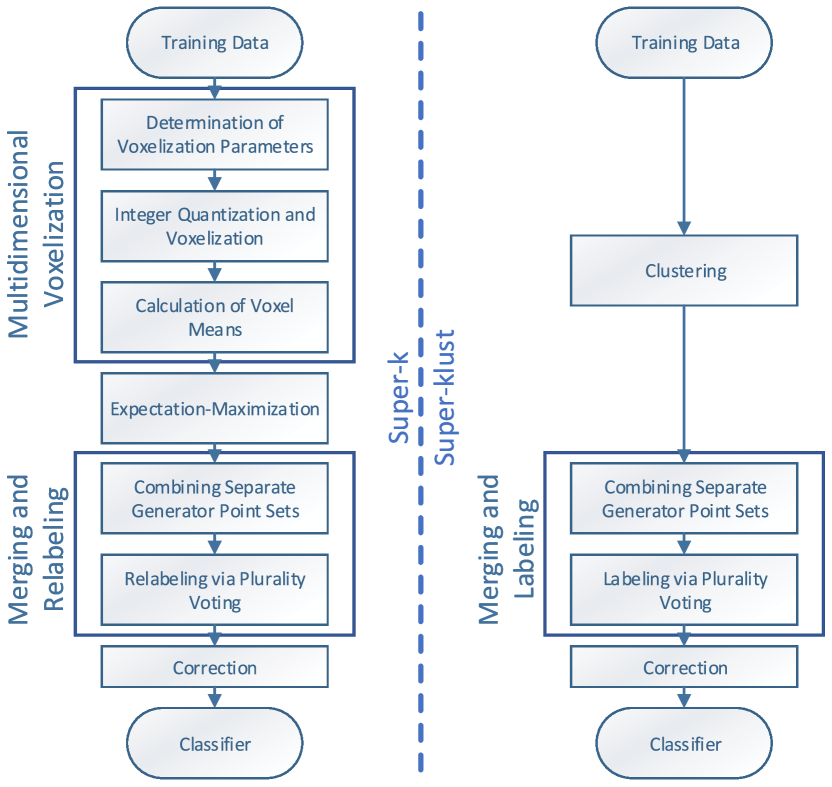
Piecewise-linear (PWL) classifiers gives us an alternate way of handling classification problems. With our previous study, the Super-k algorithm[1], we have introduced a novel approach to PWL classification problem. During further development efforts of Super-k we have found that, using a distance based clustering method, the preferred one is k-means[2], we can replace multidimensional voxelization and expectation-maximization (EM) stages without losing functionality of the algorithm. When Super-k analyzed with the perspective of clustering, the multidimensional voxelization works as initialization, and the EM works as clustering.
Using a well known clustering algorithm for the first stages of our novel PWL classifier increases clarity of the algorithm and takes the burden of managing a part of the complexity from our shoulders. With the introduction of distance based clustering into the algorithm, it is more meaningful to name algorithm with respect to clustering. So, we are introducing a modified version of the Super-k algorithm and naming it as Supervised k Clusters or in short Super-klust.
In this paper, we will explain the differences of the Super-klust algorithm and give experimental results similar, and comparable to the Super-k algorithm. In the following section (Section 2) the Super-klust algorithm is explained. In Section 3, graphical results on synthetic datasets are given, and the Super-klust algorithm is compared with Super-k, SVM-linear, SVM-RBF, SVM-polynomial, and KNN using the experimental results of the Super-k paper[1]. The results are also discussed. In Section 4, the paper is summed up and the final thoughts are given.
2 The Super-klust Algorithm
The Super-klust algorithm starts with clustering of separate classes of the data. The clustering algorithm of choice is k-means[2]. Although it is possible to use different values for different classes, in order to keep the implementation simple, is a shared parameter between clustering of different classes.
Clustering of different classes of the data into clusters creates separate Voronoi tessellations for every class. With the k-means algorithm, cluster means becomes the generator points that represent that class as a Voronoi tessellation. One advantage of the k-means algorithm, although it depends on the implementation, it gives us the ability to control the number of generator points finely via the parameter.
After obtaining the sets of generator points separately for the classes, the remaining part of the algorithm is same as the Super-k algorithm. The details can be found in our prior paper[1]. The process steps of the Super-k and Super-klust algorithms are shown in (Figure 1).
3 Experimental Results
The platform used for the experimental tests and comparisons is as follows: The CPU used for the experimentation is Intel(R) Core(TM) i7-7700 running at 3.60GHz frequency; the system has 32GB of DDR4 RAM running at 2133 MHz.
Unoptimized reference implementation of the Super-klust algorithm is written in Python[3] using NumPy[4] as the linear algebra library and Scikit-Learn[5] for the k-means clustering. For the generation of the figures, Matplotlib[6] is used. Scikit-Learn[5] is also used for both synthetic data generation and dataset retrieval. In addition, the SVM variants and KNN are used from the same library[5].
The reference implementation of the Super-klust algorithm and the source code to reproduce the results of this paper are shared[rahman_salim_zengin_ituamgsuper-klust_2021].
3.1 Tests with synthetic datasets
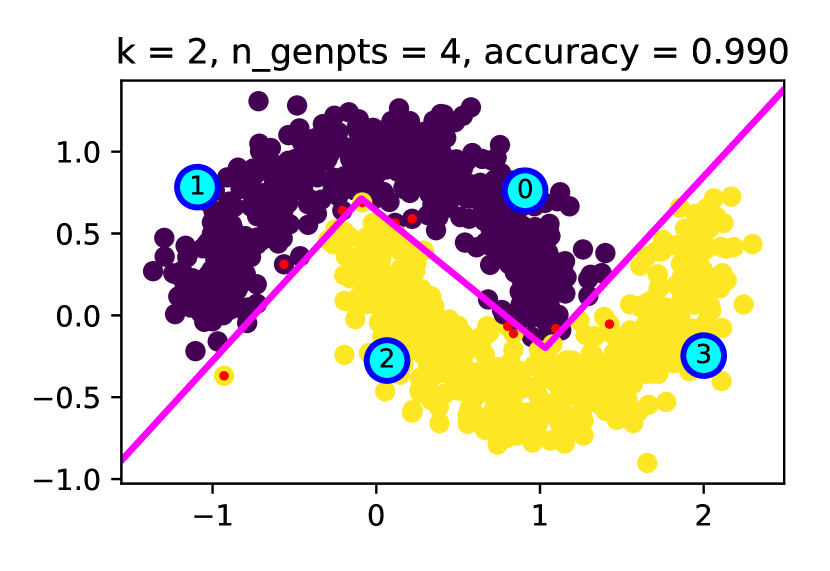
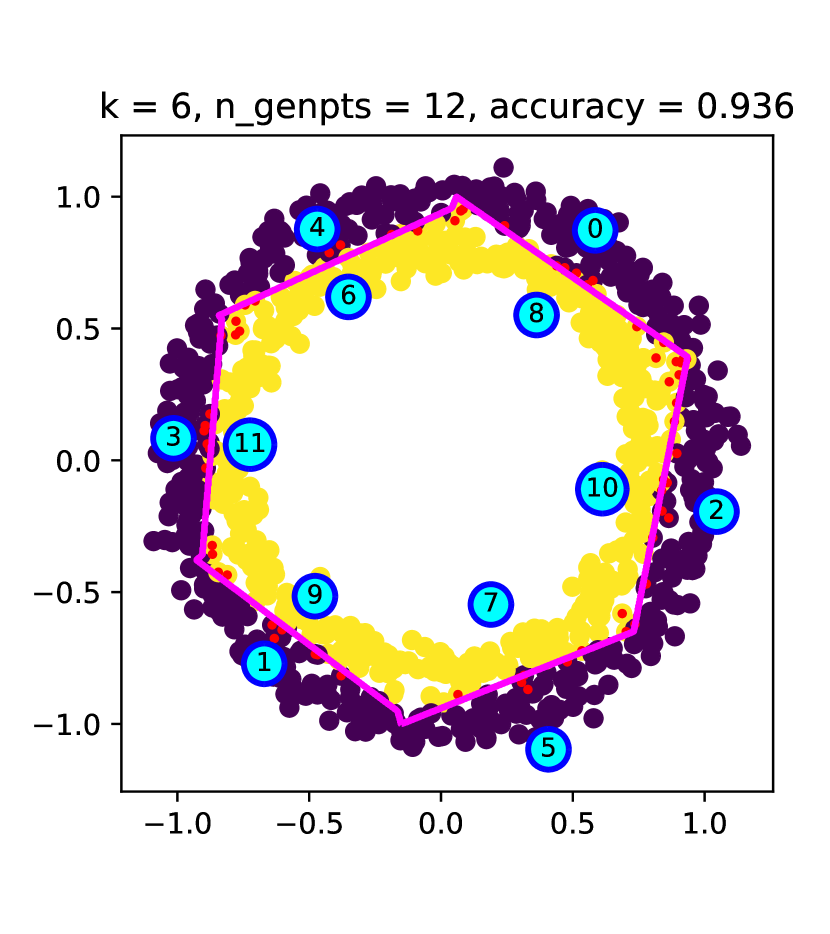
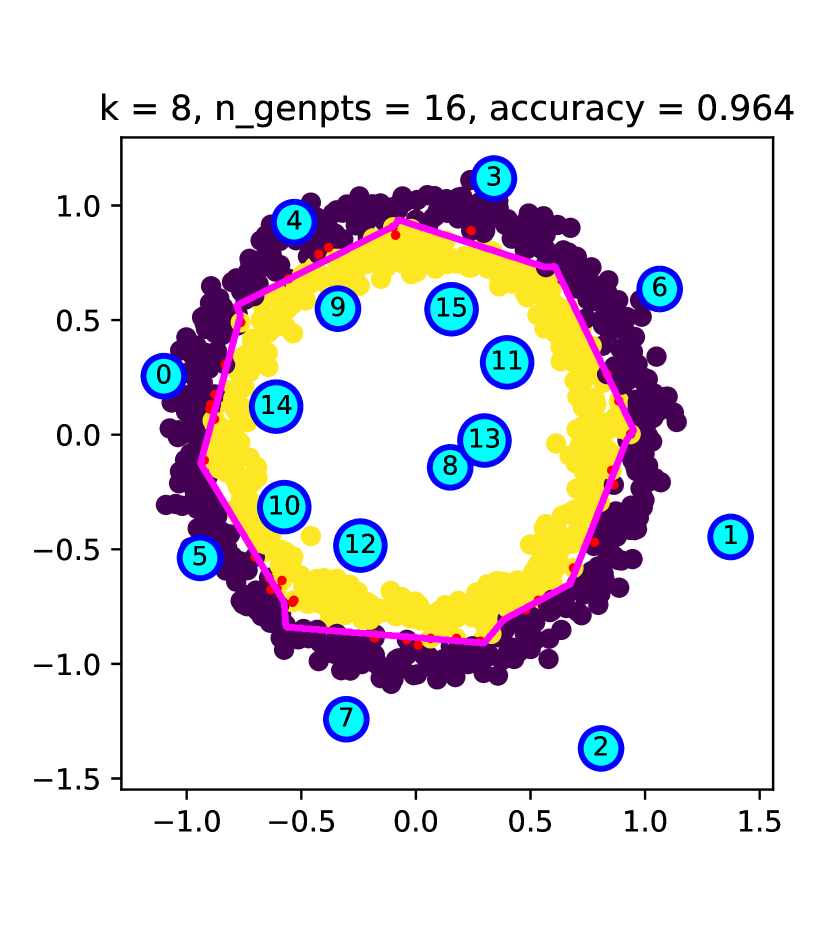
The tests on synthetic datasets are done to visualize the behavior of the Super-klust algorithm. The datasets are the same datasets, used in the Super-k paper. Due to the finer controllability of the parameter, simpler classifiers can be obtained via the Super-klust algorithm.
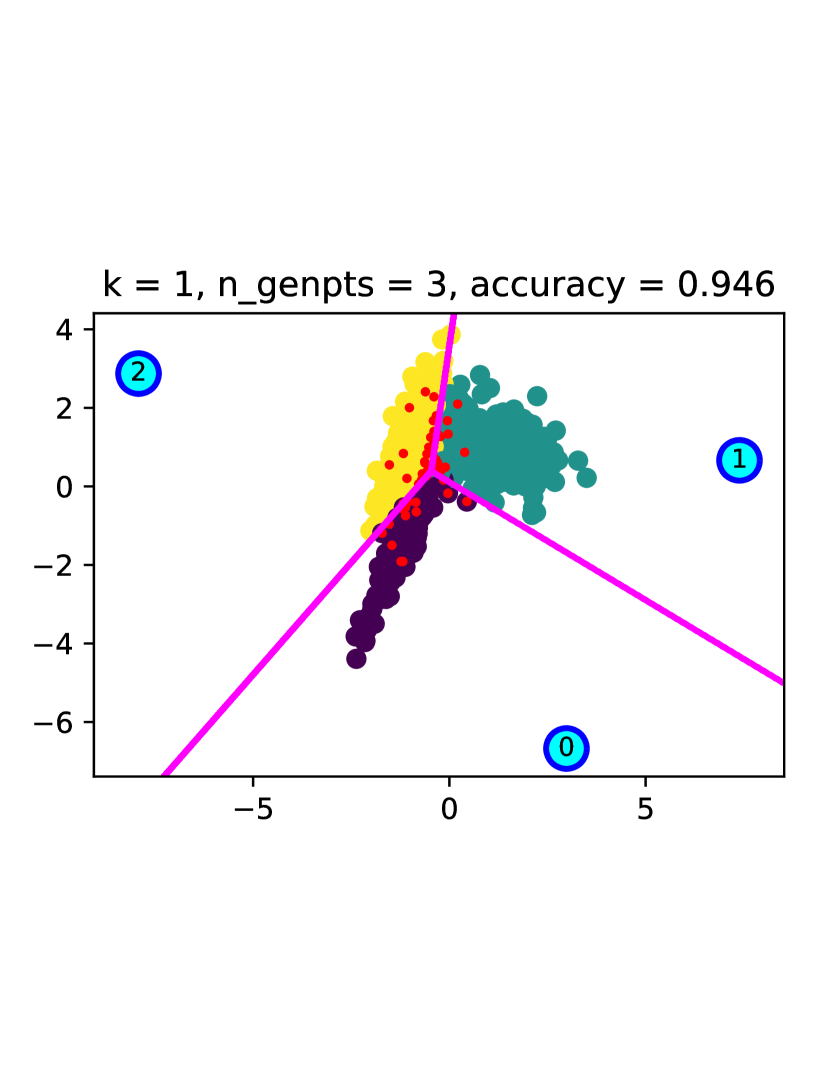
As it is showed in (Figure 2(a)), with , a minimalistic classifier can be obtained. And with the Super-klust algorithm, directly reflects the number of generator points per class. This can be clearly observed in the (Figure 2).
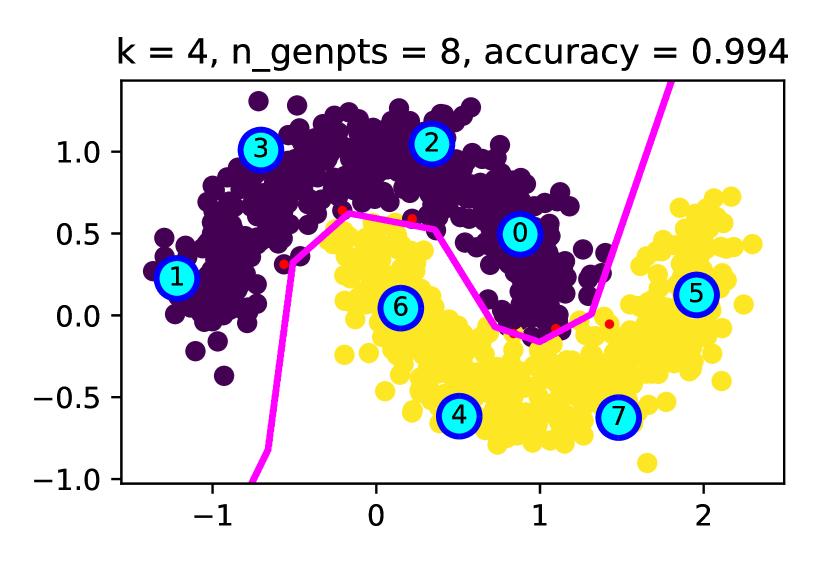
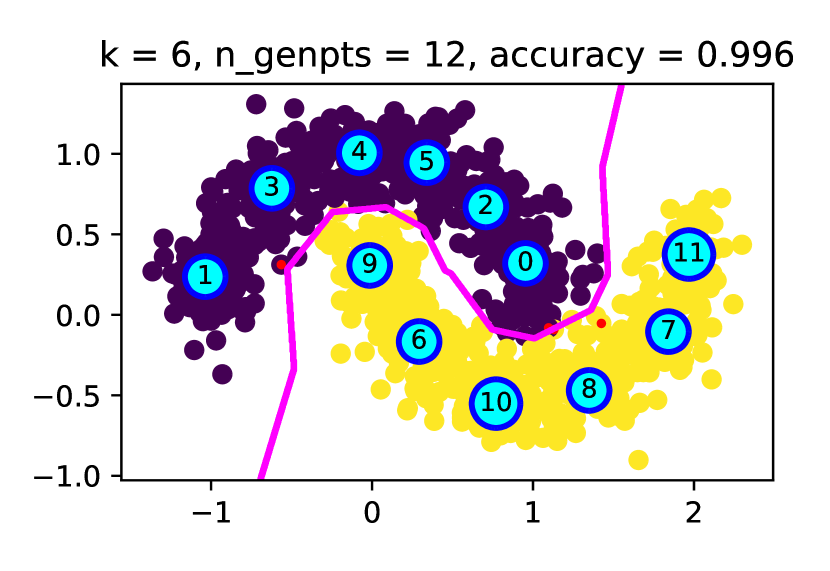
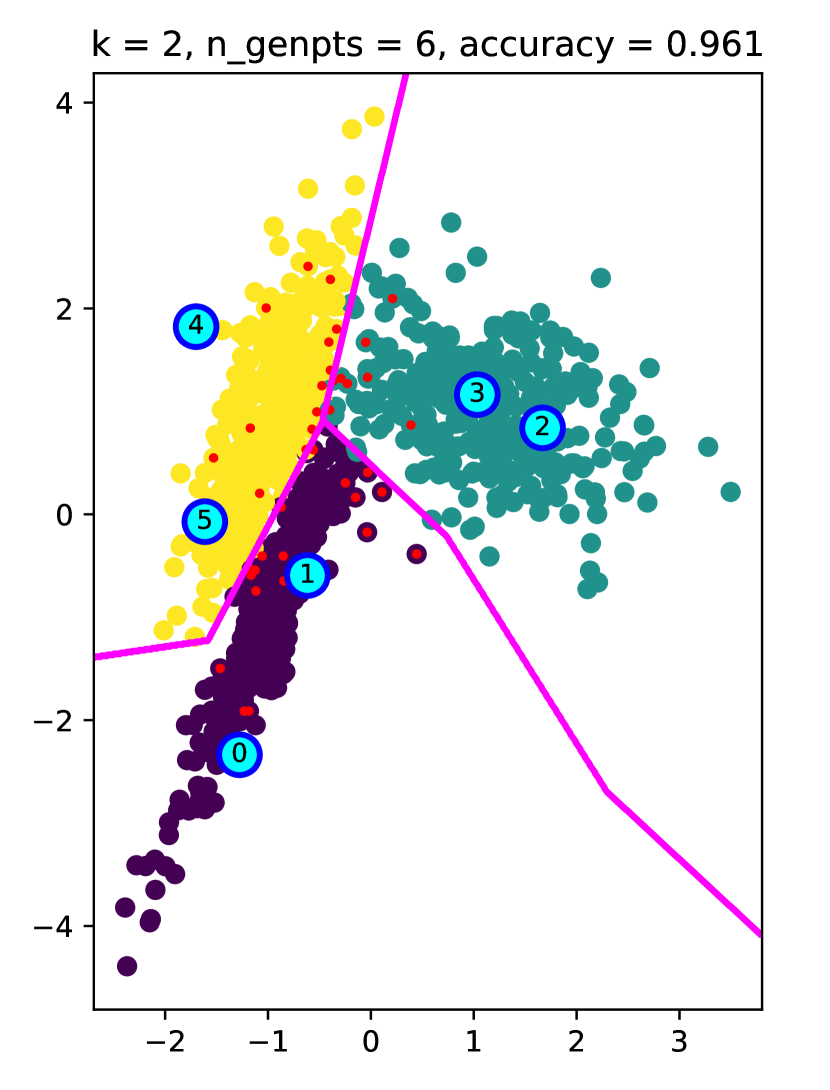
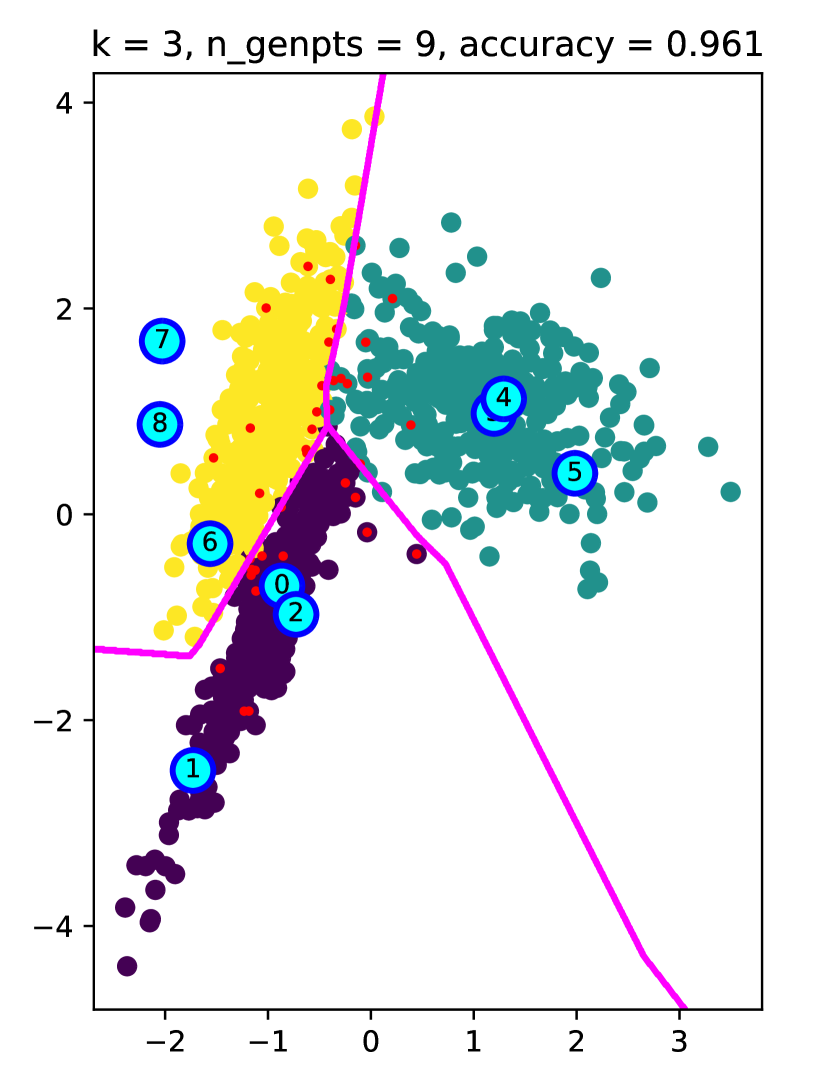
Due to the random initialization of the k-means algorithm, the generator points are occurring in random order. Although it is not so meaningful for the classification, the orientations of the classifiers in (Figure 3) looks random when they are compared to the figures of the Super-k paper. And the random orientations shows importance of the correction stage of the process.
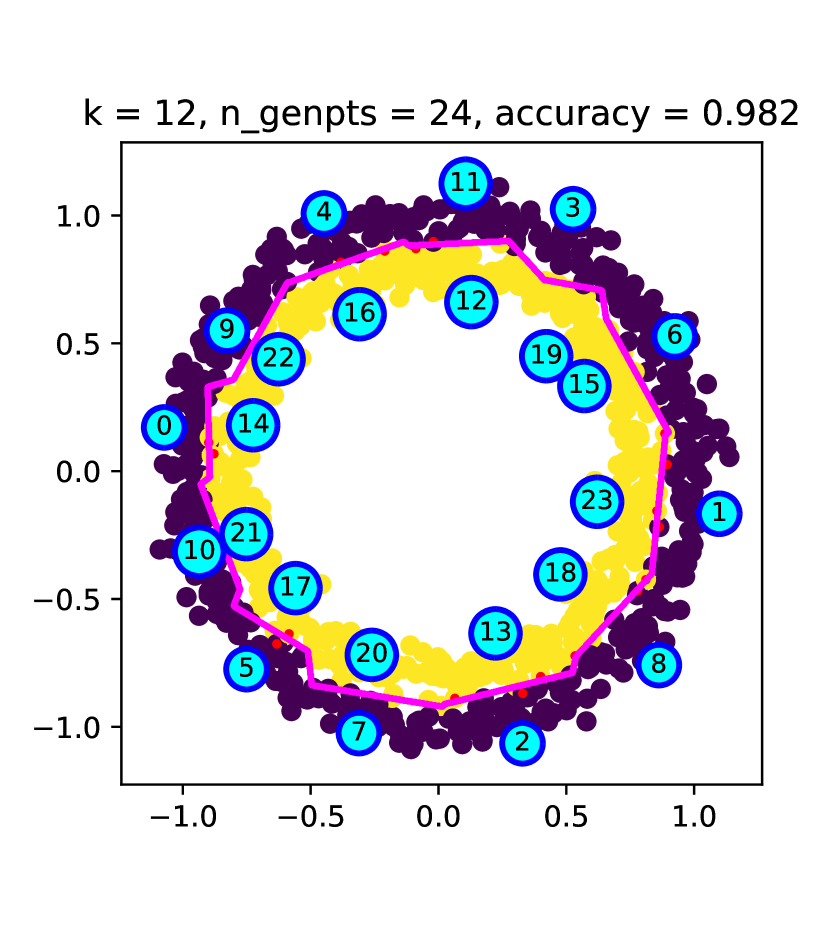
For the random gaussians dataset, increasing the k parameter does not have much effect after , as it can be seen in (Figure 4).
3.2 Tests with real world datasets
As it can be seen in the (Table 1(d)), the results of the Super-klust algorithm are similar to the results of the Super-k algorithm. The differences are highly dependent on the parameters which are controlling the algorithms. The Super-klust algorithm has comparable accuracy and training performance with the others and shares the high performance inference ability of the Super-k algorithm.
| Sample Size | Features | Train/Test Sizes | |
|---|---|---|---|
| optdigits | 5620 | 64 | 3823/1797 |
| USPS | 9298 | 256 | 7291/2007 |
| satimage | 6430 | 36 | 5144/1286 |
| letter | 20000 | 16 | 16000/4000 |
| isolet | 7797 | 617 | 6240/1557 |
| optdigits | USPS | satimage | letter | isolet | |
|---|---|---|---|---|---|
| Super-klust | 0.968 | 0.938 | 0.909 | 0.950 | 0.938 |
| Super-k | 0.967 | 0.941 | 0.916 | 0.931 | 0.945 |
| SVM Linear | 0.961 | 0.926 | 0.877 | 0.850 | 0.962 |
| SVM RBF | 0.976 | 0.949 | 0.903 | 0.927 | 0.960 |
| SVM Poly | 0.976 | 0.954 | 0.866 | 0.947 | 0.965 |
| KNN | 0.979 | 0.949 | 0.911 | 0.955 | 0.923 |
| optdigits | USPS | satimage | letter | isolet | |
|---|---|---|---|---|---|
| Super-klust | 172.5(7.0) | 1287.4(105.0) | 259.7(14.3) | 2734.1(272.7) | 833.0(147.9) |
| Super-k | 101.3(0.2) | 1922.8(855.4) | 177.5(2.3) | 1402.7(190.9) | 1633.9(289.4) |
| SVM Linear | 101.4(2.0) | 1440.7(78.9) | 393.3(51.2) | 3744.4(155.5) | 4917.7(172.6) |
| SVM RBF | 228.3(0.6) | 2718.6(147.9) | 378.0(20.0) | 3062.3(240.5) | 8636.5(171.2) |
| SVM Poly | 114.4(0.4) | 1901.9(139.9) | 423.9(20.9) | 2467.9(174.0) | 8203.0(833.6) |
| KNN | 13.9(0.1) | 147.5(6.5) | 18.1(0.0) | 59.2(3.5) | 291.8(14.9) |
| optdigits | USPS | satimage | letter | isolet | |
|---|---|---|---|---|---|
| Super-klust | 0.4(0.0) | 3.7(0.4) | 0.7(0.0) | 19.5(0.2) | 2.7(0.0) |
| Super-k | 0.4(0.0) | 3.2(0.0) | 0.5(0.0) | 6.8(0.5) | 2.0(0.1) |
| SVM Linear | 53.8(0.1) | 543.4(25.1) | 76.3(0.1) | 1143.3(30.5) | 3641.0(187.3) |
| SVM RBF | 160.6(0.6) | 1207.4(89.0) | 140.1(7.8) | 2424.3(325.6) | 5132.4(222.6) |
| SVM Poly | 74.1(0.1) | 823.7(33.1) | 106.7(5.5) | 961.9(41.9) | 4599.7(151.8) |
| KNN | 472.5(1.0) | 4996.3(173.8) | 155.0(8.9) | 573.6(29.4) | 10692.0(122.7) |
4 Conclusion
The new foundational PWL classification algorithm, Super-k, is simplified via introducing clustering as the method of obtaining separate Voronoi tessellations for every class of the data. As a result, Supervised k Clusters, or in short Super-klust becomes a new option as a PWL classifier for our current and future research.
The contributions of the proposed algorithm are as follows:
-
1.
A new and simpler PWL classification algorithm is introduced.
-
2.
The tremendous inference performance advantage of the Super-k algorithm is kept for the Super-klust algorithm.
According to the experimental results, the Super-klust algorithm has a tremendous inference performance advantage over other algorithms, similar to Super-k. The Super-klust algorithm shared all advantages and the opportunities of the Super-k algorithm, with a simpler algorithm structure.
Acknowledgements
This research was supported by the Turkish Scientific and Technological Research Council (TUBITAK) under project no. 118E809.
We would like to thank the reviewers for their thoughtful comments and their constructive remarks.
References
- [1] R. S. Zengin, V. Sezer, Super-k: A Piecewise Linear Classifier Based on Voronoi Tessellations, arXiv:2012.15492 [cs] (Jan. 2021). arXiv:2012.15492.
- [2] A. K. Jain, Data clustering: 50 years beyond K-means, Pattern Recognition Letters 31 (8) (2010) 651–666. doi:10.1016/j.patrec.2009.09.011.
- [3] G. van Rossum, Python tutorial, technical report CS-R9526, centrum voor wiskunde en informatica (CWI), amsterdam.” (1995).
- [4] S. van der Walt, S. C. Colbert, G. Varoquaux, The NumPy Array: A Structure for Efficient Numerical Computation, Computing in Science Engineering 13 (2) (2011) 22–30. doi:10.1109/MCSE.2011.37.
- [5] F. Pedregosa, G. Varoquaux, A. Gramfort, V. Michel, B. Thirion, O. Grisel, M. Blondel, P. Prettenhofer, R. Weiss, V. Dubourg, J. Vanderplas, A. Passos, D. Cournapeau, M. Brucher, M. Perrot, E. Duchesnay, Scikit-learn: Machine learning in Python, Journal of Machine Learning Research 12 (2011) 2825–2830.
- [6] J. D. Hunter, Matplotlib: A 2D Graphics Environment, Computing in Science Engineering 9 (3) (2007) 90–95. doi:10.1109/MCSE.2007.55.