Limiting Value of the Kolkata Index for Social Inequality and a Possible Social Constant
Abstract
Based on some analytic structural properties of the Gini and Kolkata indices for social inequality, as obtained from a generic form of the Lorenz function, we make a conjecture that the limiting (effective saturation) value of the above-mentioned indices is about 0.865. This, together with some more new observations on the citation statistics of individual authors (including Nobel laureates), suggests that about of people or papers or social conflicts tend to earn or attract or cause about of wealth or citations or deaths respectively in very competitive situations in markets, universities or wars. This is a modified form of the (more than a) century old law of Pareto in economy (not visible today because of various welfare and other strategies) and gives an universal value () of social (inequality) constant or number.
I Introduction
Unlike the universal constants in physical sciences, like the Gravitational Constant of Newton’s Gravity law, Boltzmann Constant of thermodynamics or Planck’s Constant of Quantum Mechanics, there is no established universal constant yet in social sciences. There have of course been suggestion of several possible candidates.
Stanley Milgram’s experiment Milgram1967small to determine the social ‘contact-distance’ between any two persons of the society, by trying to deliver letters from and to random people through personal chains of friends or acquaintances, suggested ‘Six Degrees of Separation’. Studying similar distance through co-authorship of papers, between any two scientists (e.g., the Erdos number wiki , describing the collaborative distance between mathematician Paul Erdos and another mathematician) indicated similar but not identical numbers. Later, the (internet) network structure studies Newman2006Structure ; Barabasi2014Everything linked the (separation) number to be related to the network size (typically going as log of the network size) and not really as universal as six. The Dunbar number Dunbar1992Neocortex , suggesting that we can only maintain one hundred and fifty distinct social relationships (as may be seen in the sizes of the old village groups), has also been questioned. It is observed to vary from much smaller numbers, for closer shell relationships, to order of magnitude larger number, for social weblinks and can be extracted, say, from the sizes of individual’s mobile call list (see e.g., McCarty2000Comparing ; Bhattacharya2016sex ).
We find that the limiting magnitude of a particular social inequality measure shows a robust and universal value across different social contexts. In a series of papers Ghosh2014Inequality ; Ghosh2016kinetic ; Chatterjee2017Socio-economic ; Sinha2019Inequality ; Banerjee2020Kolkata1 (see also Banerjee2020Kolkata2 for a recent review), we introduced the Kolkata index () for measuring social inequality ( corresponds to perfect equality and corresponds to extreme inequality). In the economic context Ghosh2014Inequality , it says fraction of people posses fraction of wealth, while in the context of an university Ghosh2014Inequality ; Chatterjee2017Socio-economic , it says fraction of papers published by the faculty of the university attracts fraction of citations, or even in the context of wars or major social conflicts, it says Sinha2019Inequality fraction of social conflicts or wars cause fraction of deaths. We observed Ghosh2014Inequality ; Chatterjee2017Socio-economic ; Sinha2019Inequality , in a very wide range of social contexts, the limiting (or effective saturation) value of the Kolkata index to be around (except in the case of world economies today, where such limiting value of is observed to be much smaller and is about ). Indeed, the index is a quantitative generalization of the century old rule of Vilfredo Pareto Pareto1971Translation , who observed towards the end of eighteenth century that in most of the European countries (Italy, in particular) almost of the land are owned by of the people (i.e., ), and perhaps similar across the entire economy in those days (when massive economic welfare measures or land reforms, etc. did not exist!).
We will first discuss here analytically some indications of a limiting behavior of the Kolkata index, suggesting its value near 0.86. Next we will provide some detailed analysis of data from different social sectors like citations of papers published by different universities and in different journals, human deaths in different wars or social conflicts, and citations of papers published by individual authors (including Nobel Laureates) showing that the limiting value of the inequality index suggests that typically of citations (or deaths) come from papers (or conflicts).
II LORENZ CURVE: GINI & KOLKATA INDICES
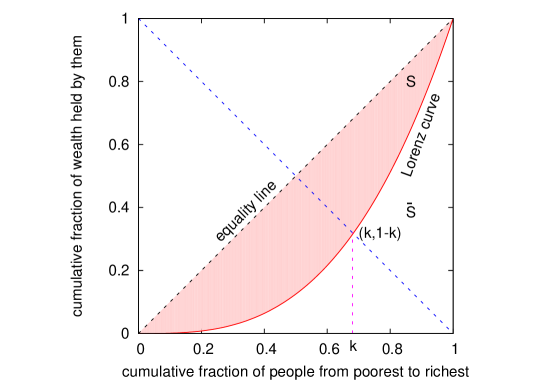
Our study here is based on the Lorenz curve (see Fig. 1) or function Lorenz1905Methods , which gives the cumulative fraction of (total accumulated) wealth (or citations or human deaths) possessed (attracted or caused) by the fraction of the people (or papers or social conflicts respectively) when counted from the poorest (or least or mildest) to the richest (or highest or deadliest). If the income/wealth (or citations or deaths) of every person (or paper or war) would be identical, then would be a straight line (diagonal) passing through the origin. This diagonal is called the equality line. The Gini coefficient or index is given by twice the area between the Lorenz curve and the equality line: corresponds to equality and corresponds to extreme inequality.
We proposed Ghosh2014Inequality the Kolkata index () given by the ordinate value (see Fig. 1) of the intersecting point of the Lorenz curve and the diagonal perpendicular to the equality line (see also Ghosh2016kinetic ; Chatterjee2017Socio-economic ; Sinha2019Inequality ; Banerjee2020Kolkata1 ; Banerjee2020Kolkata2 ). By construction, , saying that fraction of wealth (or citations or deaths) is being possessed (owned or caused) by fraction of the richest population (impactful papers or deadliest wars). As such, it gives a quantitative generalization of more than a century old phenomenologically established 80-20 law of Pareto Pareto1971Translation , saying that in any economy, typically about 80% wealth is possessed by only 20% of the richest population. Defining the Complementary Lorenz function , one gets as its (nontrivial) fixed point Banerjee2020Kolkata1 ; Banerjee2020Kolkata2 : (while Lorenz function itself has trivial fixed points at and 1). Kolkata index () can also be viewed as a normalized Hirsch index ()Lorenz1905Methods for social inequality as -index is given by the fixed point value of the nonlinear citation function against the number of publications of individual researchers. We have studied the mathematical structure of -index in Banerjee2020Kolkata1 (see Banerjee2020Kolkata2 for a recent review) and its suitability, compared with the Gini and other inequality indices or measures, in the context of different social statistics, in Ghosh2014Inequality ; Ghosh2016kinetic ; Chatterjee2017Socio-economic ; Sinha2019Inequality ; Banerjee2020Kolkata1 ; Banerjee2020Kolkata2 .
III Numerical study of and for a generic from of Lorenz function
For various distributions of wealth, citations or deaths, the generic form of the Lorenz function is such that and and it grows monotonically with . As a generic form, we assume
| (1) |
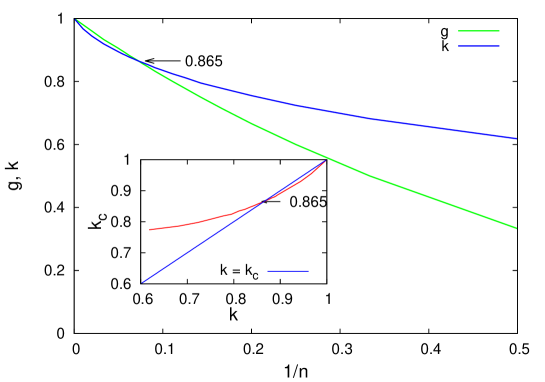
where is a positive real number. For , the Lorenz curve falls on the equality line and one gets , . For , and becomes inverse of the Golden ratio Ghosh2016kinetic ; Banerjee2020Kolkata1 ; Banerjee2020Kolkata2 . For increasing values of , both and approach unity, and our numerical study indicates some interesting non-monotonic variational relationship between and (see also Ghosh2016kinetic for similar features in the case of special distributions), and shown in Figs. 2 and 3.
IV Data analysis for citations of papers by institutions and individuals
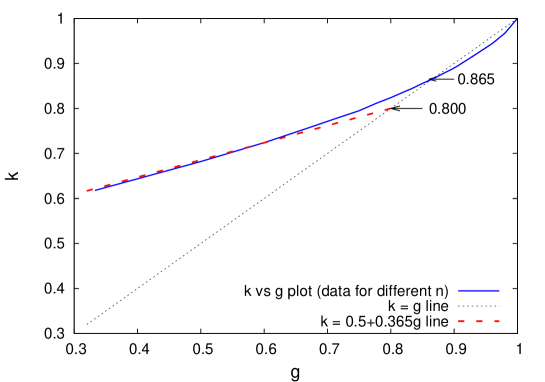
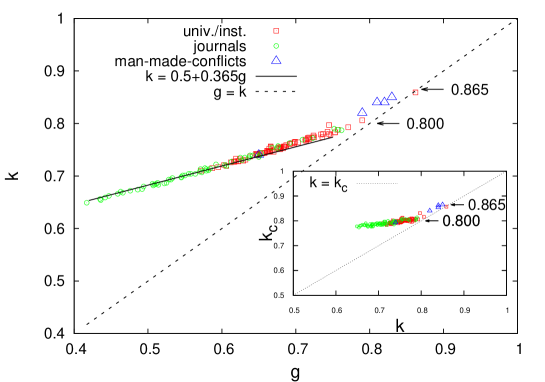
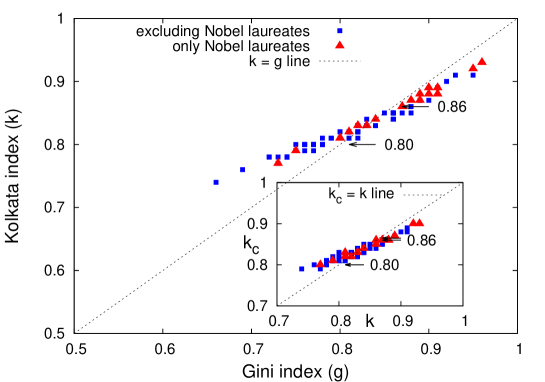
First we reanalyze the Web of Science data Ghosh2014Inequality ; Chatterjee2017Socio-economic for the citations received by papers published by scientists from a few selected Universities and Institutions of the world and citations received by papers published in some selected Journals. We also added the the analysis of the data from various World Peace Organizations and Institutions Sinha2019Inequality for human deaths in different wars and social conflicts. In Fig. 4, we plot the estimated values of against for citations received by papers published by authors from different universities or institutes and also of the publications in different journals, as well as from data for deaths distributions in various social conflicts. Noting (see Fig. 2) that has approximately a piece-wise linear relationship with as
| (2) |
with a constant , we estimate the values from the data points in Fig. 2, and using that we make a linear extrapolation for (see the inset). It may be mentioned that this approximate linear relationship is only phenomenologically observed and fits the values of and in their lower range both for this analytic form of Lorenz function (see Fig. 3) and also for the observed data (see Fig. 4).
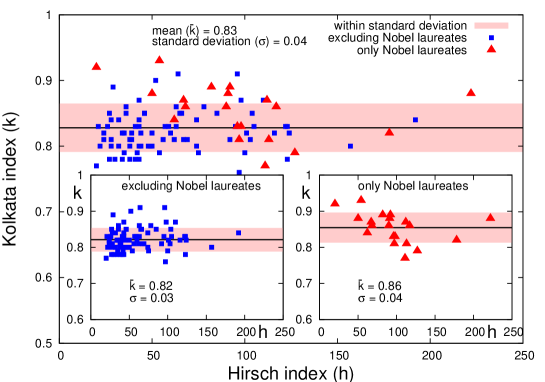
We have estimated here the values of Kolkata index against the respective Hirsch index Hirsch2005index for individual scientists, including Nobel Laureates (each having more than papers/entries and minimum index value , in their, ‘e-mail-site-verified’, Google Scholar page) from the respective paper citations (Table 1). In Fig. 5, we plot the estimated values of against of all these individual scientists. The statistics suggests the index value () to be independent of the index value (in the range ). One inset shows the values () plotted against respective values for 80 scientists who are not Nobel Laureates and another exclusively for the Nobel Laureates. This clearly shows that the limiting values of index for the Nobel Laureates on average are higher (). In Fig. 6, we show the plot of against the values of their publication statistics and the inset shows the estimated values obtained using eqn. (2) and solving for .
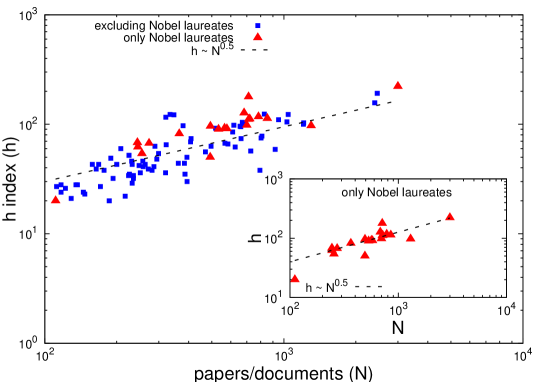
An interesting observation from Table 1 has been that the index value of an author seems to grow with number of publications, statistically speaking, following a power law (see Fig. 7, where the inset for the Nobel Laureates suggests a better fit).
| name | total | total | index values | |||
|---|---|---|---|---|---|---|
| paper | citations | |||||
| *Joseph E. Stiglitz(Econ) | 3000 | 323473 | 222 | 0.90 | 0.88 | 0.86 |
| H. Eugene Stanley(Phys) | 2458 | 200168 | 192 | 0.86 | 0.84 | 0.83 |
| C. N. R. Rao(Chem) | 2400 | 121756 | 157 | 0.77 | 0.80 | 0.81 |
| *Hiroshi AMANO(Phys) | 1300 | 44329 | 97 | 0.80 | 0.81 | 0.83 |
| didier sornette(Phys) | 1211 | 46294 | 103 | 0.80 | 0.81 | 0.82 |
| Hans J. Herrmann-Phys) | 1208 | 36633 | 100 | 0.75 | 0.79 | 0.81 |
| Giorgio Parisi(Phys) | 1043 | 88647 | 123 | 0.83 | 0.83 | 0.82 |
| George Em Karniadakis(Math) | 1030 | 53823 | 105 | 0.84 | 0.83 | 0.83 |
| Richard G M Morris(Bio) | 950 | 70976 | 110 | 0.89 | 0.87 | 0.85 |
| debashis mukherjee(Chem) | 920 | 15169 | 59 | 0.83 | 0.83 | 0.83 |
| *Joachim Frank(Chem) | 853 | 48077 | 113 | 0.80 | 0.81 | 0.82 |
| R.I.M. Dunbar(Soc) | 828 | 65917 | 124 | 0.81 | 0.82 | 0.82 |
| C. Tsallis(Phys) | 810 | 36056 | 78 | 0.88 | 0.86 | 0.84 |
| Biman Bagchi(Chem) | 803 | 23956 | 75 | 0.77 | 0.79 | 0.81 |
| Srinivasan Ramakrishnan(Phys) | 794 | 6377 | 38 | 0.78 | 0.80 | 0.82 |
| *William Nordhaus(Econ) | 783 | 74369 | 117 | 0.87 | 0.86 | 0.85 |
| Ronald Rousseau(Soc) | 727 | 15962 | 57 | 0.83 | 0.83 | 0.82 |
| *David Wineland(Phys) | 720 | 63922 | 112 | 0.88 | 0.87 | 0.86 |
| *Jean Pierre Sauvage(Chem) | 713 | 57439 | 111 | 0.73 | 0.77 | 0.80 |
| *Gregg L. Semenza(Bio) | 712 | 156236 | 178 | 0.81 | 0.82 | 0.82 |
| *Gérard Mourou(Phys) | 700 | 49759 | 98 | 0.82 | 0.83 | 0.83 |
| Jean Philippe Bouchaud(Phys) | 688 | 44153 | 101 | 0.82 | 0.82 | 0.82 |
| *Frances Arnold(Chem) | 682 | 56101 | 127 | 0.75 | 0.79 | 0.81 |
| Dirk Helbing(Phys) | 670 | 60923 | 104 | 0.86 | 0.85 | 0.84 |
| T. Padmanabhan(Phys) | 662 | 26145 | 74 | 0.86 | 0.84 | 0.84 |
| Gautam R. Desiraju(Chem) | 661 | 59333 | 95 | 0.84 | 0.83 | 0.83 |
| Brian Walker(Bio) | 656 | 136565 | 96 | 0.93 | 0.91 | 0.89 |
| A. K. Sood(Phys) | 626 | 24076 | 62 | 0.82 | 0.81 | 0.81 |
| Masahira Hattori(Bio) | 618 | 80069 | 98 | 0.90 | 0.87 | 0.85 |
| Joshua Winn(Phys) | 611 | 45701 | 85 | 0.88 | 0.85 | 0.84 |
| Kaushik Basu(Econ) | 584 | 21506 | 66 | 0.86 | 0.85 | 0.84 |
| *Abhijit Banerjee(Econ) | 578 | 59704 | 91 | 0.89 | 0.88 | 0.86 |
| Kimmo Kaski(Phys) | 567 | 19647 | 67 | 0.80 | 0.81 | 0.82 |
| *Esther Duflo(Econ) | 565 | 69843 | 92 | 0.91 | 0.89 | 0.87 |
| *Serge Haroche(Phys) | 533 | 40034 | 90 | 0.87 | 0.86 | 0.85 |
| Peter Scambler(Bio) | 518 | 31174 | 92 | 0.81 | 0.81 | 0.82 |
| Spencer J. Sherwin(Maths) | 496 | 15383 | 63 | 0.83 | 0.83 | 0.83 |
| *Michael Houghton(Bio) | 493 | 49368 | 96 | 0.83 | 0.83 | 0.83 |
| *A. B. McDonald(Phys) | 492 | 20346 | 50 | 0.91 | 0.88 | 0.86 |
| Mauro Gallegati(Econ) | 491 | 10360 | 50 | 0.80 | 0.82 | 0.83 |
| A. K. Raychaudhuri(Phys) | 470 | 12501 | 56 | 0.78 | 0.81 | 0.82 |
| Sidney Redner(Phys) | 409 | 26287 | 74 | 0.78 | 0.80 | 0.81 |
| Janos Kertesz(Phys) | 407 | 20115 | 69 | 0.80 | 0.81 | 0.82 |
| Jayanta K Bhattacharjee(Phys) | 394 | 3674 | 30 | 0.74 | 0.78 | 0.81 |
| Alex Hansen(Phys) | 393 | 9678 | 50 | 0.76 | 0.80 | 0.82 |
| Prabhat Mandal(Phys) | 386 | 4780 | 35 | 0.75 | 0.79 | 0.81 |
| Bikas K Chakrabarti(Phys) | 384 | 10589 | 44 | 0.81 | 0.82 | 0.83 |
| Ashoke Sen(Phys) | 379 | 33342 | 97 | 0.69 | 0.76 | 0.80 |
| *Paul Milgrom(Econ) | 365 | 102043 | 82 | 0.90 | 0.89 | 0.87 |
| Ramasesha S(Chem) | 362 | 7188 | 44 | 0.78 | 0.80 | 0.82 |
| name | total | total | index values | |||
|---|---|---|---|---|---|---|
| paper | citations | |||||
| Noboru Mizushima(Bio) | 347 | 117866 | 122 | 0.82 | 0.83 | 0.83 |
| William S. Lane(Bio) | 334 | 72622 | 123 | 0.74 | 0.78 | 0.80 |
| Debraj Ray(Econ) | 322 | 23558 | 65 | 0.85 | 0.85 | 0.85 |
| Beth Levine(Bio) | 321 | 103480 | 116 | 0.81 | 0.82 | 0.83 |
| Debashish Chowdhury(Phys) | 320 | 8442 | 36 | 0.88 | 0.86 | 0.84 |
| Toscani Giuseppe(Math) | 299 | 10129 | 54 | 0.75 | 0.79 | 0.82 |
| Matteo Marsili(Phys) | 294 | 8976 | 48 | 0.77 | 0.80 | 0.82 |
| Rosario Nunzio Mantegna(Phys) | 289 | 29437 | 63 | 0.88 | 0.86 | 0.85 |
| Diptiman Sen(Phys) | 286 | 6054 | 41 | 0.74 | 0.78 | 0.80 |
| J. Barkley Rosser(Econ) | 281 | 5595 | 38 | 0.81 | 0.81 | 0.82 |
| *David-Thouless(Phys) | 273 | 47452 | 67 | 0.89 | 0.87 | 0.86 |
| Sanjay Puri(Phys) | 271 | 6053 | 39 | 0.79 | 0.81 | 0.82 |
| Maitreesh Ghatak(Econ) | 263 | 11942 | 43 | 0.89 | 0.87 | 0.86 |
| Serge GALAM(Phys) | 258 | 7774 | 41 | 0.82 | 0.83 | 0.84 |
| Sriram Ramaswamy(Phys) | 257 | 13122 | 46 | 0.87 | 0.85 | 0.84 |
| *Paul Romer(Econ) | 255 | 95402 | 54 | 0.96 | 0.93 | 0.90 |
| Krishnendu Sengupta(Phys) | 251 | 7077 | 36 | 0.86 | 0.85 | 0.84 |
| Chandan Dasgupta(Phys) | 248 | 6685 | 42 | 0.76 | 0.79 | 0.81 |
| Scott Kirkpatrick(CompSc) | 245 | 80300 | 64 | 0.95 | 0.91 | 0.88 |
| *richard henderson(Chem) | 245 | 27558 | 62 | 0.84 | 0.84 | 0.84 |
| *F.D.M. Haldane(Phys) | 244 | 41591 | 68 | 0.87 | 0.86 | 0.86 |
| Kalobaran Maiti(Phys) | 235 | 3811 | 32 | 0.86 | 0.84 | 0.83 |
| Amitava Raychaudhuri(Phys) | 235 | 3522 | 34 | 0.74 | 0.78 | 0.81 |
| Bhaskar Dutta(Econ) | 232 | 6945 | 43 | 0.82 | 0.83 | 0.84 |
| Ganapathy Baskaran(Phys) | 232 | 6863 | 29 | 0.91 | 0.89 | 0.87 |
| Hulikal Krishnamurthy(Phys) | 231 | 14542 | 46 | 0.86 | 0.85 | 0.84 |
| Rahul PANDIT(Phys) | 226 | 6067 | 35 | 0.82 | 0.82 | 0.82 |
| W. Brian Arthur(Econ) | 225 | 47014 | 52 | 0.92 | 0.90 | 0.88 |
| Pratap Raychaudhuri(Phys) | 224 | 4231 | 34 | 0.80 | 0.82 | 0.83 |
| Jose Roberto Iglesias(Phys) | 217 | 1819 | 22 | 0.77 | 0.80 | 0.82 |
| Hongkui Zeng(Bio) | 208 | 18914 | 60 | 0.82 | 0.82 | 0.83 |
| Deepak Dhar(Phys) | 200 | 7401 | 43 | 0.77 | 0.80 | 0.82 |
| Sitabhra Sinha(Phys) | 193 | 2855 | 32 | 0.76 | 0.80 | 0.83 |
| Amol Dighe(Phys) | 189 | 8209 | 49 | 0.76 | 0.80 | 0.82 |
| Arup Bose(Maths) | 186 | 1965 | 20 | 0.73 | 0.77 | 0.79 |
| Abhishek Dhar(Phys) | 177 | 5004 | 38 | 0.73 | 0.78 | 0.80 |
| S. M. Bhattacharjee(Phys) | 171 | 2268 | 27 | 0.72 | 0.78 | 0.81 |
| Martin R. Maxey(Maths) | 168 | 10124 | 43 | 0.86 | 0.84 | 0.83 |
| Arnab Rai Choudhuri(Phys) | 164 | 6115 | 39 | 0.81 | 0.82 | 0.83 |
| Victor M. Yakovenko(Phys) | 158 | 7699 | 43 | 0.72 | 0.78 | 0.81 |
| Md Kamrul Hasan(Phys) | 147 | 1844 | 23 | 0.66 | 0.74 | 0.79 |
| Shankar Prasad Das(Phys) | 145 | 2476 | 24 | 0.81 | 0.81 | 0.81 |
| Amit Dutta(Phys) | 137 | 2845 | 28 | 0.79 | 0.81 | 0.82 |
| Anirban Chakraborti(Phys) | 135 | 4809 | 28 | 0.83 | 0.84 | 0.85 |
| Parongama Sen(Phys) | 129 | 3062 | 21 | 0.82 | 0.83 | 0.83 |
| Roop Mallik(Bio) | 122 | 3363 | 26 | 0.83 | 0.83 | 0.84 |
| Wataru Souma(Phys) | 117 | 2607 | 24 | 0.82 | 0.82 | 0.83 |
| Subhrangshu S Manna(Phys) | 117 | 4287 | 28 | 0.75 | 0.80 | 0.83 |
| Damien Challet(Math) | 112 | 5521 | 27 | 0.86 | 0.85 | 0.85 |
| *Donna Strickland(Phys) | 111 | 10370 | 20 | 0.95 | 0.92 | 0.90 |
V Summary and discussions
Social inequalities in every aspects, resulting from competitiveness are described by various distributions (like Log-normal, Gamma, Pareto, etc., see e.g., Chakrabarti2013Income ; Sen2014Sociophysics ). Economic inequality has long been characterized Gini1921Measurement by the Gini index () and a few other (much) less popular geometric characterizations (see e.g., Eliazar2015sociogeometry ) of the Lorenz curve or function Lorenz1905Methods (see Fig. 1). We introduced Ghosh2014Inequality the Kolkata index as a fixed point of the Complementary Lorenz function has trivial fixed points at = 0 and 1). In fact, the Kolkata index is also (geometrically) related to the ‘perpendicular diameter’ Eliazar2015sociogeometry ; Eliazar2016Harnessing of the Lorenz curve. Unlike the Gini index, which measures some average properties of the Lorenz function, Kolkata index gives a tangible interpretation: fraction of rich people or papers or social conflicts possess or attract or cause fraction of wealth or citations or deaths respectively.
Assuming a generic form (as in eqn. (1), giving and and monotonic increase parametrized by , as desired), we see (in Figs. 2 and 3) that as inequality increases (with increasing ) from equality and for to extreme inequality as , has a non-monotonic variation with respect to such that and crosses at and they finally meet at . As the Gini index is identified (see Biro2020Gintropy ) as the information entropy of social systems and the Kolkata index () as the inverse of effective temperature of such systems (increasing means decreasing average money in circulation and hence decreasing temperature Chakrabarti2013Income ), this multivaluedness of (free energy) as function of (temperature) at and (Figs. 2 and 3) indicates a first order like (thermodynamic) phase transition Stanley1971intro at .
We also noted Ghosh2014Inequality ; Ghosh2016kinetic ; Chatterjee2017Socio-economic ; Sinha2019Inequality ; Banerjee2020Kolkata1 ; Banerjee2020Kolkata2 that the index value, in extreme limits of social competitiveness, converge towards a high value around (see Fig. 4), though not near the highest possible value (maximum possible value for extreme inequality). Indeed, index gives a quantitative generalization of the century old rule () of Pareto Pareto1971Translation for economic inequality (though, as mentioned earlier, the economic inequality statistics today for various countries of the world shows Ghosh2014Inequality much lower values in the range , because of various economic welfare measures).
In summary, using a generic form (valid for all kinds of inequality distributions) of the Lorenz function (= 0 for and = 1 for and monotonically increasing in-between), we showed (see Fig. 2) that as inequality increases (with increasing values of in eqn. (1)), the difference in values between (initially higher in magnitude) and , both individually increasing, vanishes at (after which becomes higher than in magnitude) until the point of extreme inequality () where , where they touch each other in magnitude. We consider this crossing point of , which is higher than the Pareto value Pareto1971Translation ), as an attractive stable fixed point inducing a saturation and universal value for the inequality measure for the various distributions in different social sectors. Indeed, this limiting universal value of may effectively restrict the range of interactions among the agents, depending on the dynamic interplay between them in the socio-dynamical models (see e.g., Sen2014Sociophysics ; Solomon2001Power ). This saturation value of the index also restrict the exponent value of the power law distribution for income, wealth etc. (see Ghosh2016kinetic ; Solomon2001Power ).
Our earlier citation analysis Ghosh2014Inequality ; Chatterjee2017Socio-economic from the web of science data for citations against papers published by authors from different established universities or institutes and also of the publications in different competitive journals indicate the limiting value of to be . Similar analysis for human deaths in different deadly wars or social conflicts Sinha2019Inequality also suggests similar limiting value of (see Fig. 4). These are a little higher than the Pareto value Pareto1971Translation of (). It may be noted that, unlike the economic welfare measures taken to avoid social unrest (revolutions in earlier era and strikes etc these days), the universities and institutions encourage competence and discourage failure. Competition in the wars etc are of course extremely fierce.
Our citation analysis here of individual scientists, including Nobel Laureates (see Table 1), in different scientific and sociological subjects (each having at least papers or entries in their respective Google Scholar page, with ‘verifiable email site’, and having the Hirsch index value or more) suggests (see Fig. 5) and independent of the index value in the range . Indeed, for Nobel Laureates, the the average value of the Kolkata index is slightly higher (, again independent index value) saying that for any of them, typically about of their successful papers earn about of their total citations. It may be interesting to note that Google Scholar has developed a page web1 on Karl Marx, father of socialism, and it is maintained by the British National Library. The page contains entries (books, papers, documents, published by Marx himself, or later collected, translated, and edited by other individuals and different institutions. According to this page, his total citation counts and his Hirsch index value () is . Our citation analysis says, his Kolkata index value () is , suggesting again that of his citations comes from of his writings! From Table 1, we also note that individual’s index value grows, on average, with the total number of his/her publications as (more clearly so for the Nobel Laureates; see the inset of Fig. 7), and as such Hirsch index has no saturation value (as a universal limiting social number). It may be mentioned in this connection that our observation regarding the growth of Hirsch index value with the volume or number of publications by individual authors seem to suggest a similarity with the Heaps’ law Heaps in linguistics, where the number of distinct words in a document grows following a power law with the document size (having exponent value in the range ).
To conclude, based on our analytic study of the properties of the Gini () and Kolkata () indices for social inequality, based on a generic form (eqn. (1)) of the Lorenz function (in section II), and some observations on the citation statistics of individual authors (including Nobel laureates), institutions and journals (also on the statistics of deaths in wars etc), we make a conjecture that about of people or papers or social conflicts earn or attract or cause about of wealth or citations or deaths in very competitive situations in the markets, universities or wars respectively. This is a modified form of the (more than a) century old law of Pareto in economy which is not visible in today’s economies because of various welfare strategies to mitigate poverty). This limiting value of the Kolkata index for inequality gives perhaps an universal social constant or number.
acknowledgments
BKC is grateful to INSA Senior Scientist grant (from Indian National Science Academy) for support. We are extremely grateful to Soumyajyoti Biswas, Indrani Bose, Anirban Chakraborti, Arnab Chatterjee and Manipushpak Mitra for useful comments on the manuscript. We are also thankful to the two anonymous referees for raising some thoughtful points and suggestions.
References
- (1) S. Milgram, The Small World Problem. Psychology Today, Ziff-Davis Publishing Company, New York (May 1967)
- (2) https://en.wikipedia.org/wiki/Erdos_number
- (3) M. Newman, Mark, A.-L. Barabási, and D J. Watts, The Structure and Dynamics of Networks, Princeton University Press, Princeton, NJ (2006)
- (4) A.-L. Barabasi, Linked: How Everything is Connected to Everything Else and What It Means for Business, Science, and Everyday Life, Basic Books, New York (2014)
- (5) R. I. M. Dunbar, Neocortex size as a constraint on group size in primates. Journal of Human Evolution. 22 (6), 469–493 (1992)
- (6) C. McCarty, P. D. Killworth, H. R. Bernard, E. Johnsen and G. Shelley, Comparing two methods for estimating network size, Human Organization. 60 (1), 28–39 (2000)
- (7) K. Bhattacharya, A. Ghosh, D. Monsivais, R.I.M. Dunbar, K. Kaski, Sex differences in social focus across the life cycle in humans, Royal Society open science, 3 (4), 160097 (2016)
- (8) A. Ghosh, N. Chattopadhyay and B. K. Chakrabarti, Inequality in societies, academic institutions and science journals: Gini and k-indices, Physica A: Statistical Mechanics and its Applications, Elsevier, 410, 30–34 (2014)
- (9) A. Ghosh, A. Chatterjee, J. Inoue, and B. K. Chakrabarti, Inequality measures in kinetic exchange models of wealth distributions, Physica A: Statistical Mechanics and its Applications, 451, 465–474 (2016)
- (10) A. Chatterjee, A. Ghosh and B. K. Chakrabarti, Socio-economic inequality: Relationship between Gini and Kolkata indices, Physica A: Statistical Mechanics and its Applications, 466, 583–595 (2017).
- (11) A. Sinha and B. K. Chakrabarti, Inequality in death from social conflicts: A Gini & Kolkata indices-based study, Physica A: Statistical Mechanics and its Applications, 527, 121185 (2019)
- (12) S. Banerjee, B. K. Chakrabarti, M. Mitra and S. Mutuswami, On the Kolkata index as a measure of income inequality, Physica A: Statistical Mechanics and its Applications, 545, 123178 2020)
- (13) S. Banerjee, B. K. Chakrabarti, M. Mitra and S. Mutuswami, Social Inequality Measures: The Kolkata index in comparison with other measures, Frontiers in Physics, 8, 562182 (2020) [https://doi.org/10.3389/fphy.2020.562182]
- (14) V. Pareto, Alfred N. Page, Translation of ‘Manuale di economia politica’ (Manual of political economy), A.M. Kelley Publishing, New York (1971)
- (15) C. Gini, Measurement of inequality of incomes, The Economic Journal, JSTOR, 31, 124-126 (1921)
- (16) M. O. Lorenz, Methods of measuring the concentration of wealth, Publications of the American Statistical Association, Taylor & Francis, 9, 209-219 (1905)
- (17) J. E. Hirsch, An index to quantify an individual’s scientific research output, Proceedings of the National Academy of Sciences, 102, 16569-16572 (2005)
- (18) B. K. Chakrabarti, A. Chakraborti, S. R. Chakravarty and A. Chatterjee, Econophysics of Income and Wealth Distributions, Cambridge University Press, Cambridge (2013)
- (19) P. Sen and B. K. Chakrabarti, Sociophysics: An Introduction, Oxford University Press, Oxford (2014)
- (20) I. Eliazar, The sociogeometry of inequality: Part I, Physica A: Statistical Mechanics and its Applications, 426, 93-115 (2015)
- (21) I. Eliazar, Harnessing inequality, Physics Reports, 649, 1-29 (2016)
- (22) T. S. Biro and Z. Neda, Gintropy: Gini Index Based Generalization of Entropy, Entropy, 22, 879 (2020) [https://doi.org/10.3390/e22080879]
- (23) H. E. Stanley, Introduction to Phase Transitions and Critical Phenomena, Oxford University Press, Oxford (1971)
- (24) S. Solomon and P. Richmond, Power laws of wealth, market order volumes and market returns, Physica A: Statistical Mechanics and its Applications, 299, 188-197 (2001)
- (25) https://scholar.google.com/citations?user=4VSRHmIAAAAJ&hl=en&oi=ao
- (26) https://en.wikipedia.org/wiki/Heaps_law