Tomography of the unique on-going jet in the planetary nebula NGC 2392
Abstract
Jets (fast collimated outflows) are claimed to be the main shaping agent of the most asymmetric planetary nebula (PNe) as they impinge on the circumstellar material at late stages of the asymptotic giant branch (AGB) phase. The first jet detected in a PN was that of NGC 2392, yet there is no available image because its low surface brightness contrast with the bright nebular emission. Here we take advantage from the tomographic capabilities of GTC MEGARA high-dispersion integral field spectroscopic observations of the jet in NGC 2392 to gain unprecedented details of its morphology and kinematics. The jet of NGC 2392 is found to emanate from the central star, break through the walls of the inner shell of this iconic PN and extend outside the nebula’s outermost regions with an S-shaped morphology suggestive of precession. At odds with the fossil jets found in mature PNe, the jet in NGC 2392 is currently being collimated and launched. The high nebular excitation of NGC 2392, which implies a He++/He ionization fraction too high to be attributed to the known effective temperature of the star, has been proposed in the past to hint at the presence of a hot white dwarf companion. In conjunction with the hard X-ray emission from the central star, the present-day jet collimation would support the presence of such a double-degenerate system where one component undergoes accretion from a remnant circumbinary disk of the common envelope phase.
1 Introduction
Planetary nebulae (PNe) are shells of ionized gas surrounding the descendants of low- and intermediate-mass stars. The canonical Interacting Stellar Winds (ISW) model of PN formation (Kwok et al., 1978; Balick, 1987) interpreted the round, elliptical and mildly bipolar morphology of PNe in terms of the interaction of two stellar winds: the current isotropic fast stellar wind and an asymptotic giant branch (AGB) dense slow wind with an equatorial density enhancement. The ISW model, however, fails for the most asymmetric PNe and those with multipolar morphology (Balick & Frank, 2002). Their formation rests upon a completely different paradigm based on the action of fast collimated outflows (i.e., jets) launched late in the AGB phase that impinge on the nebular envelope (Sahai & Trauger, 1998). The collimation of these jets has been indeed confirmed to take place in the late AGB phase, when the heavy mass-loss of the central star feeds (or forms a circumbinary disk that feeds) an accretion disk around a main-sequence or sub-stellar companion (Bollen et al., 2019).
The origin of this paradigm shift dates back to the mid 80s, when it was discovered what was called a high-velocity multi-knot bipolar mass flow in NGC 2392 (Gieseking et al., 1985). This first jet was followed by the detection of many symmetric pairs of knots or filamentary string of knots in PNe. As of today, almost 60 have been kinematically confirmed to be jets (see Guerrero et al., 2020, and references therein). Ironically, there is no direct image of the jet of NGC 2392. Spatio-kinematic observations have confirmed its 200 km s-1 high velocity (Reay et al., 1983; Balick, 1987; García-Díaz et al., 2012), but the bright nebular emission of NGC 2392 that overwhelms the emission of the jet, particularly at its bright inner shell, hinders the acquisition of a complete view of its morphology.
The advent of high-dispersion integral-field spectroscopy (IFS) provides finally the means to resolve kinematically the emission of the jet of NGC 2392 from that of the bright main nebula. High-dispersion IFS observations of NGC 2392 have thus been acquired to provide a clean view of the extent, morphology and kinematics of its jet. Details of the instrument and data acquisition, reduction and analysis are described in §2, the results are presented in §3, and the implications are discussed in §4. A short summary is given in §5.
2 OBSERVATIONS
2.1 HST archive images
Hubble Space Telescope (HST) Wide Field and Planetary Camera 2 (WFPC2) images of NGC 2392 will be used through this work for different purposes.
Images in the F502N, F656N, F658N, and F671N filters (program IDs 8499 and 8726) corresponding to the [O iii] 5007 Å, H 6563 Å, [N ii] 6584 Å, and [S ii] 6716,6731 Å emission lines, respectively, were retrieved from the Hubble Legacy Archive111https://hla.stsci.edu/.
The count rate of each image was divided by the total throughput efficiency of the filter at the line wavelength222
The information on the filter efficiency profile can be checked at
https://www.stsci.edu/files/live/sites/www/files/home/hst/instrumentation/legacy/wfpc2/_documents/wfpc2_ihb.pdf
to derive the surface brightness.
The accuracy of these values is expected to be within 10% as the filter profiles at the line wavelengths are notably flat (e.g., Balick et al., 2021).
2.2 GTC MEGARA integral field spectroscopy
IFS observations of NGC 2392 were obtained on 2020 January 4 and 25 using the Multi-Espectrógrafo en GTC de Alta Resolución para Astronomía (MEGARA; Gil de Paz et al., 2018) at the 10.4 m Gran Telescopio de Canarias (GTC). Both observing runs were performed under clear conditions and good seeing conditions with values in the range 10-12. The high-resolution Volume-Phased Holographic (VPH) grism VPH665-HR was used, providing a spectral dispersion of 0.098 Å pix-1 and a full-width at half-maximum (FWHM) spectral resolution 16 km s-1, that is, . The spectral range 6405.6–6797.1 Å covered by the VPH665-HR grism includes the key emission lines of [N ii] 6548,6584 Å, H, and [S ii] 6716,6731 Å.
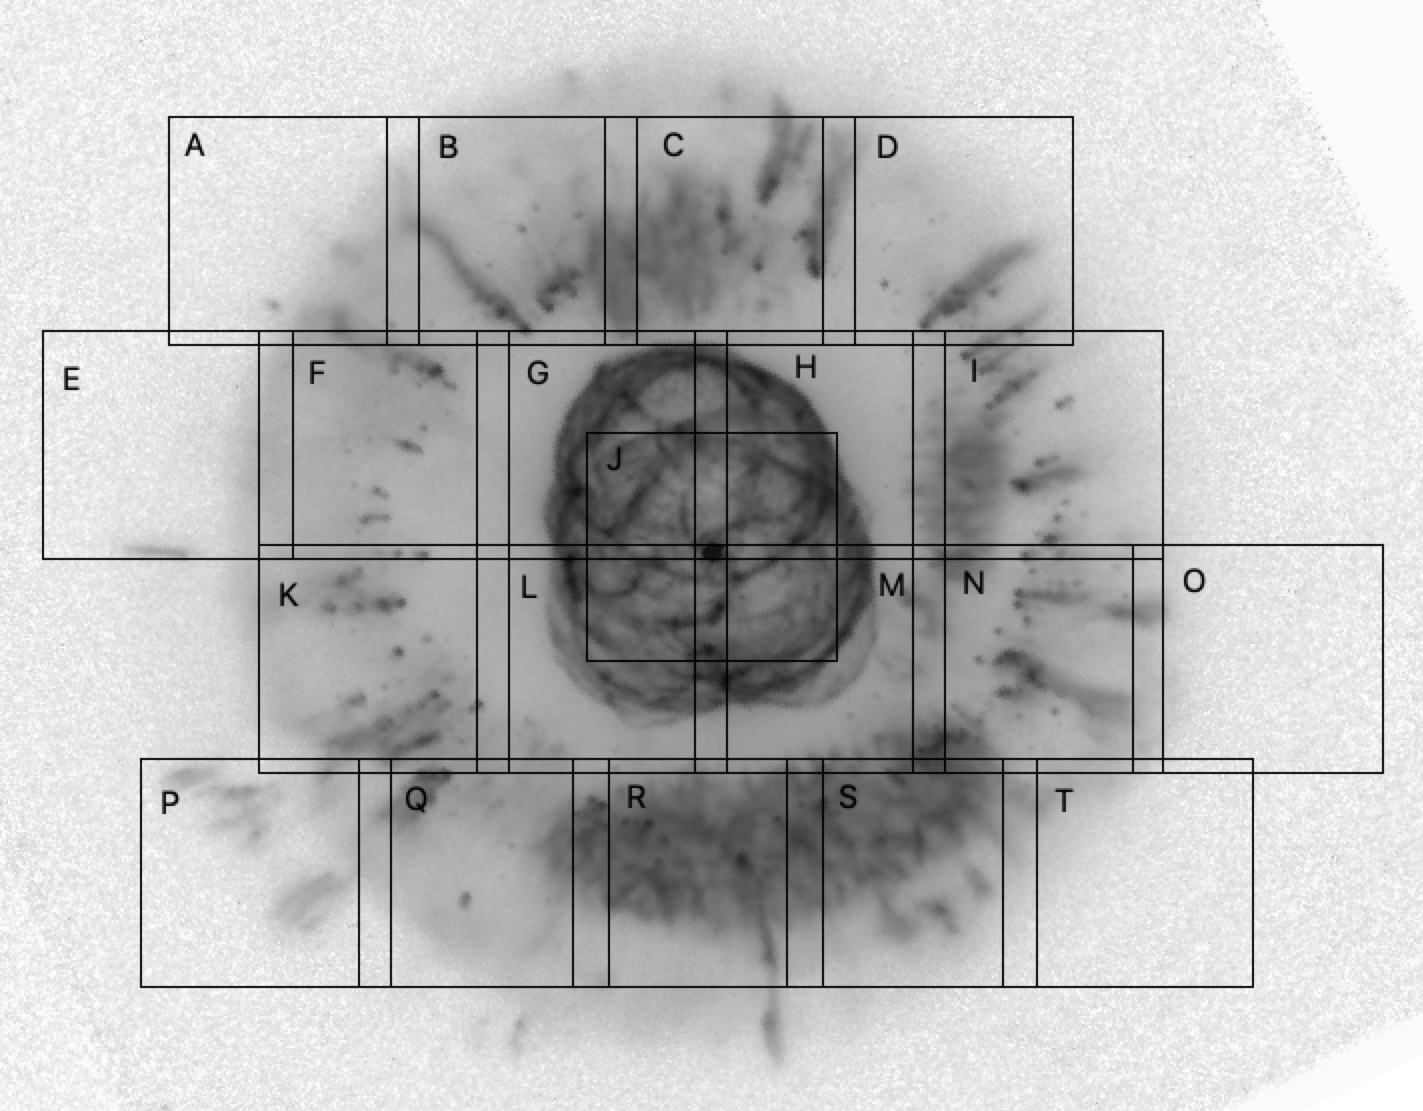
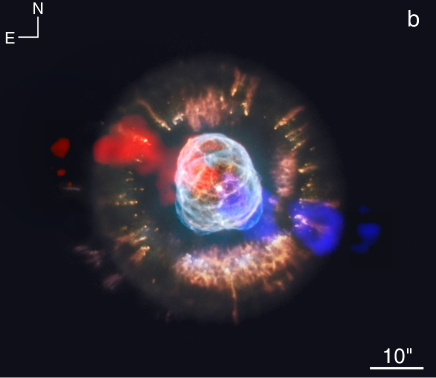
The integral-field unit (IFU) mode was used. It has 567 hexagonal spaxels with a diameter of 062 and a field of view (FoV) of 125113. Since the nebular size of NGC 2392 () is larger than the instrument FoV, observations in twenty different pointings were obtained as shown in Figure 1 to cover the inner shell and most of the outer nebular shell, with special coverage of the diameter along position angle (PA) 70∘ to map the outflow (see García-Díaz et al., 2012), which is detected in pointings “A”, “B”, “E” to “O”, “S” and “T”. The FoV of nineteen out of the twenty pointings overlap along the East-West direction and 05 along the North-South direction with adjacent fields. The twentieth pointing (“J” in Fig. 1) was centered at the location of the central star. Three 5-minute exposures were obtained at each position to facilitate removal of cosmic rays.
2.2.1 Data reduction
The MEGARA raw data were reduced following the Data Reduction Cookbook using the megaradrp v0.10.1 pipeline released on 2019 June 29 (Pascual et al., 2019). The data were sky and bias subtracted and flat-fielded. The sky subtraction used 56 ancillary fibers located from the IFU center. The individual spectra from each spaxel were then traced, extracted and wavelength calibrated to make a row-stacked spectrum (RSS). The RSS was then converted into data cubes with 4300 elements in the spectral direction and arrays of 02 square spaxels in the spatial dimension using the pipeline regularization grid task megararss2cube. The data were subsequently flux calibrated using observations of spectro-photometric standard stars.
The data cubes were then “sliced” to produce maps in the H, [N ii] 6584 Å, and [S ii] 6716,6731 Å emission lines. The surface brightness of these maps were matched with those in the available HST images in the corresponding F656N, F658N, and F671N filters applying second order flux-calibration corrections specific to each MEGARA IFU field. This procedure guarantees that the relative uncertainties in the flux-calibration among different fields are minimized. Furthermore, the comparison of the location of nebular features in the MEGARA maps and HST images allowed us to derive precise spatial offsets between the MEGARA maps.
2.2.2 Data analysis: mapping the jet
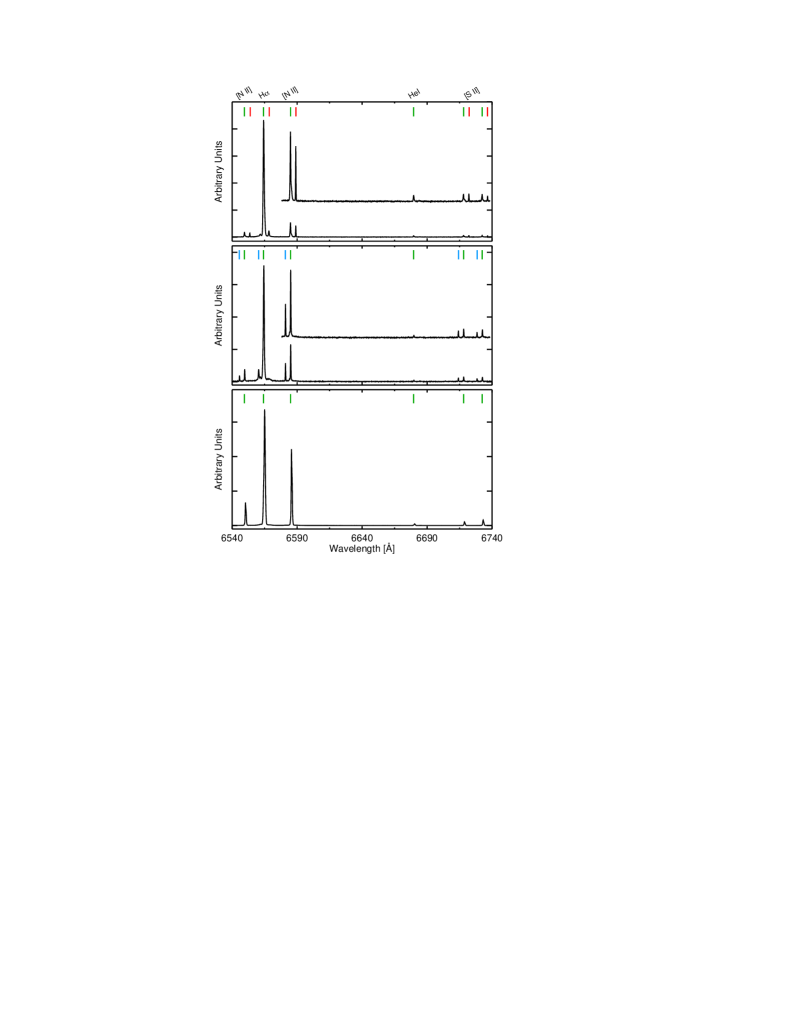
As a first step in the data analysis, the MEGARA data cubes were “sliced” at a particular wavelength range to produce a pseudo-narrow-band image at a specific velocity interval of an emission line. This provides only crude information of the spatial distribution and kinematics (radial velocity and velocity width) of the gas in the jet of NGC 2392. An inspection of the H, [N ii] and [S ii] emission line profiles at different locations reveals the presence of multiple kinematic components associated either with the nebula (bottom panel of Fig. 2) or with both the nebula and the jet (middle and top panels of Fig. 2). The emission of the high-velocity jet is generally well isolated from that of the nebular shells in the [N ii] and [S ii] emission lines. Thus the line intensities, centroids and widths at each spaxel can be fitted using a single Gaussian function. On the other hand, the H jet emission cannot be resolved properly from the H nebular emission at all locations given its low surface brightness contrast with the H nebular emission. These difficulties are further aggravated by the broader thermal width of this line. Finally, we note that the [N ii] 6548 Å line can be deprecated in favor of the three-times-brighter [N ii] 6584 Å line.
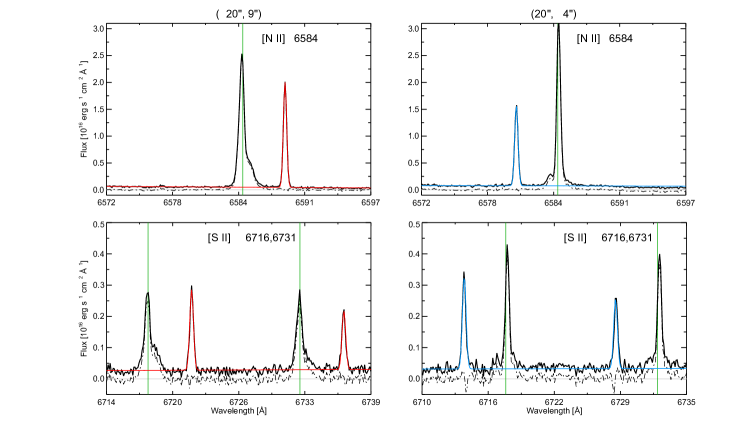
Taking into account all comments above, we applied a procedure to obtain the best single-Gaussian fit of the [N ii] 6584 Å and [S ii] emission line profiles on a spaxel-by-spaxel basis (see Figure 3 for examples of these fits). The fitting was performed to all spaxels with sufficient signal-to-noise ratio using a the Levenberg-Marquardt least-squares fitting routine mpfitexpr (Markwardt, 2009) within the Interactive Data Language333http://www.harrisgeospatial.com/SoftwareTechnology/IDL. aspx (IDL) environment for the [N ii] 6584 Å and [S ii] emission lines separately (e.g., Cazzoli et al., 2020). We found that constraints to the line widths of FWHM Å ( 45 km s-1 at the rest-frame wavelengths of these lines) and absolute radial velocities with respect to the systemic velocity444 The systemic radial velocity, , was found to be 70.5 km s-1, in agreement with the recent determination presented by García-Díaz et al. (2012). () between 130 and 250 km s-1 produced optimal results. At each spatial position, we additionally imposed that each [S ii] emission line shares the same kinematics (velocity and velocity dispersion).
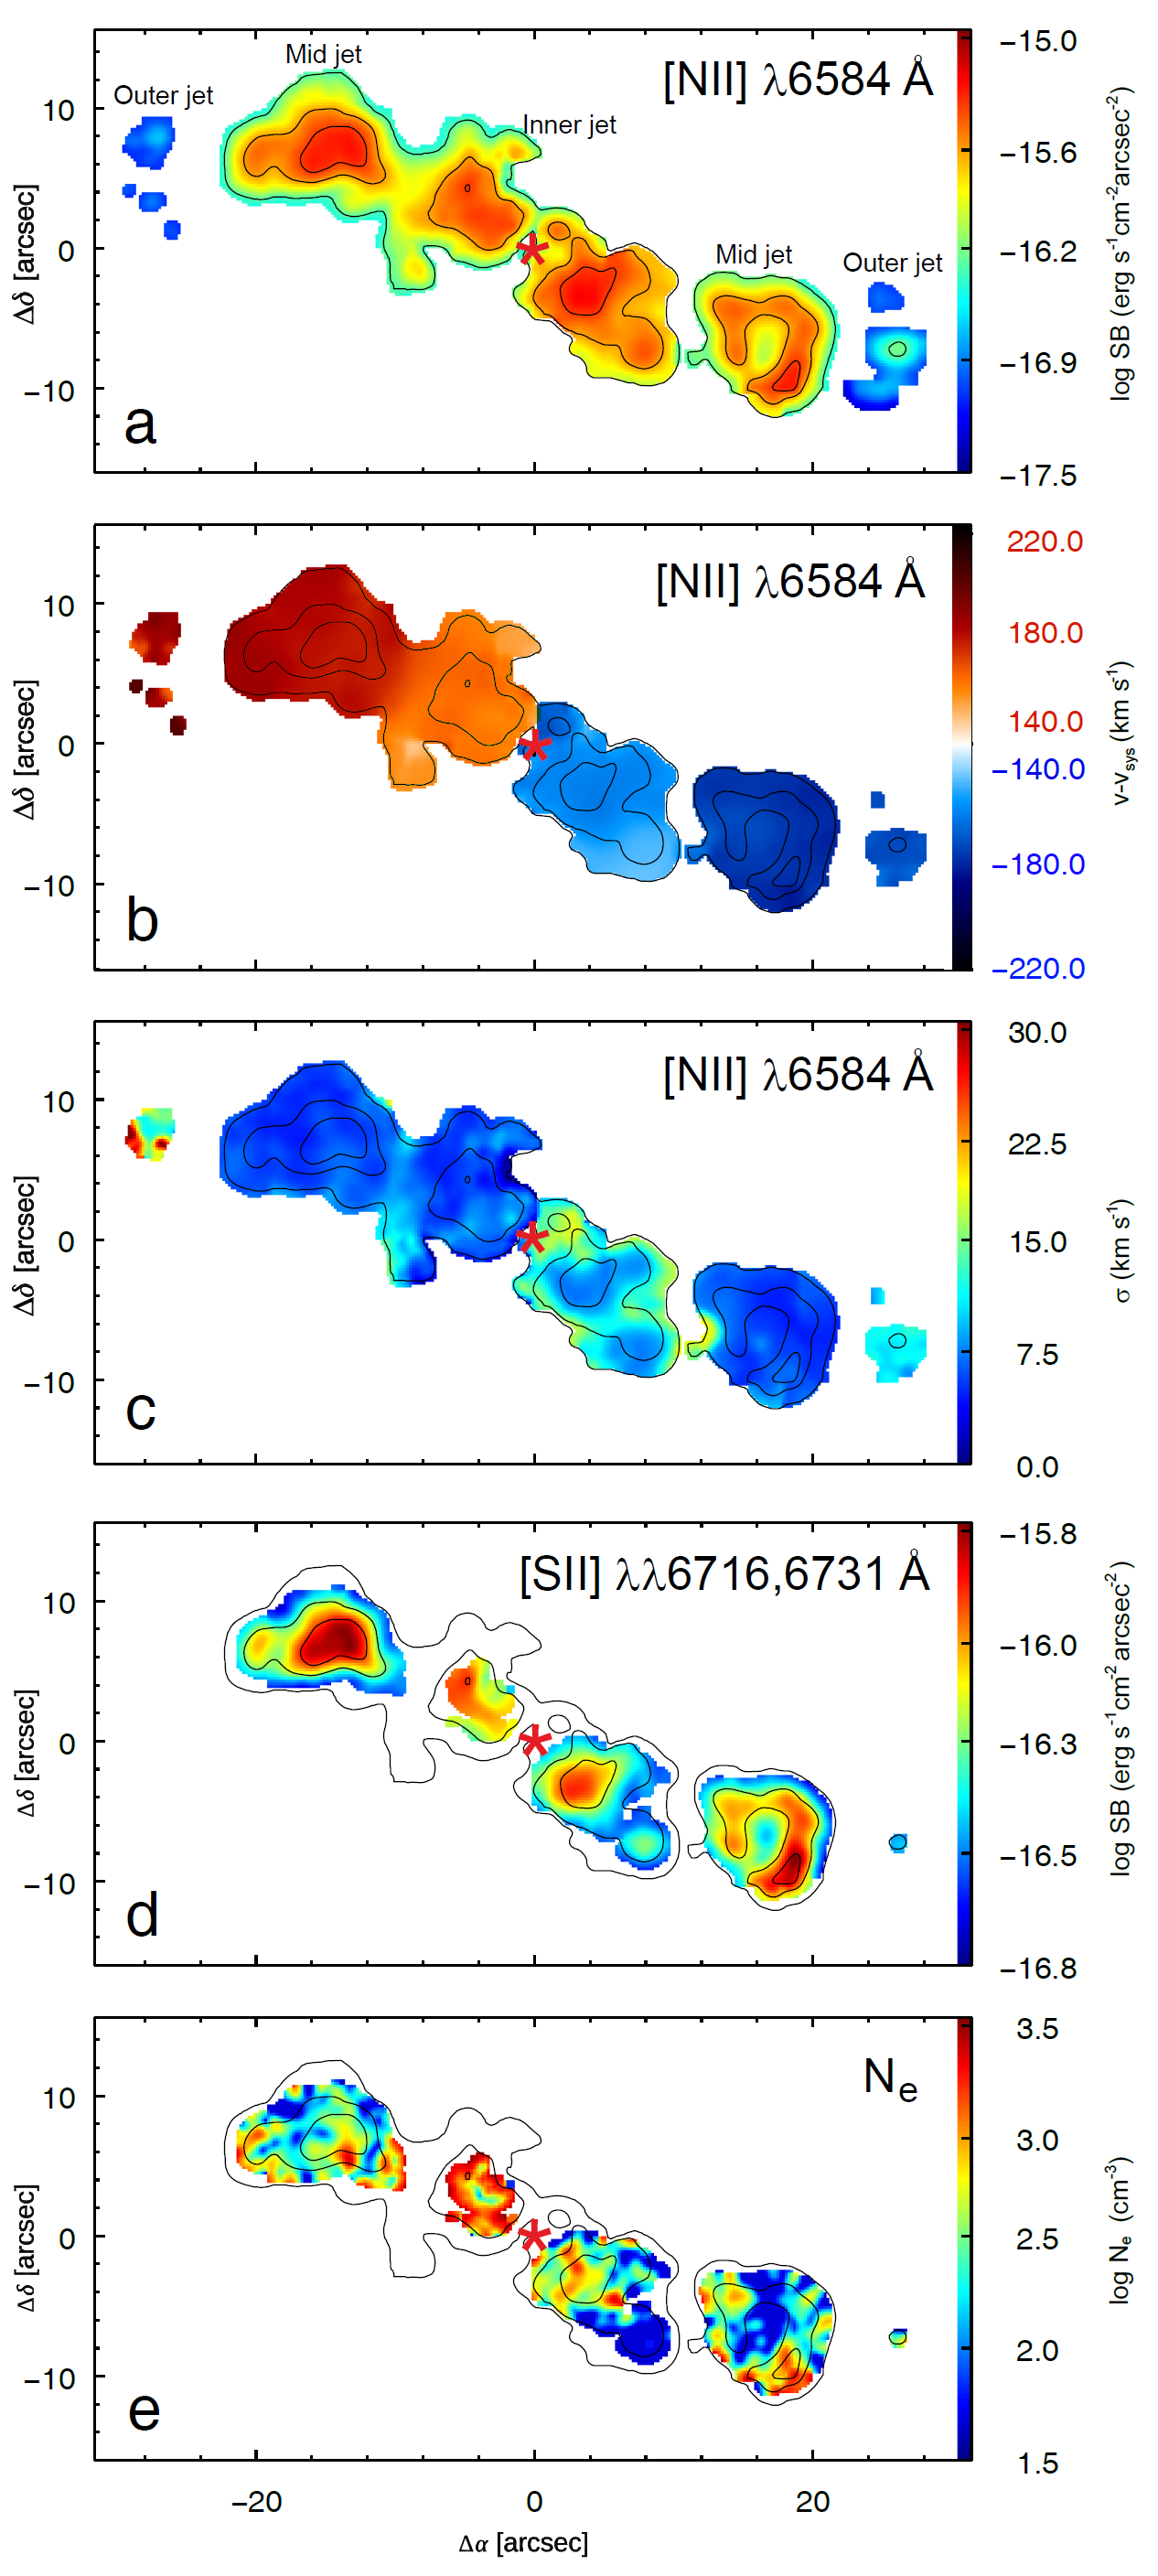
The output consists of fit parameters for each spectral feature including the central wavelength, width and flux of the line along with their uncertainties. A heliocentric velocity correction of 4 km s-1 was applied (the exact value depending on the observing time of each pointing). Finally, the observed line width was corrected for the effect of instrumental width ( km s-1) by subtracting it quadratically from the observed line width. The final maps of surface brightness, radial velocity with respect to the systemic velocity and instrumental-width-corrected velocity width of the jet are presented in Figure 4. In these maps, regions for which the significance of the [N ii] 6584 Å and [S ii] emission lines is lower than 5 and 3, respectively, have been masked out. The kinematics in the [S ii] emission lines, which is basically consistent with that of the [N ii] emission line, is not presented.
3 Results
3.1 Jet morphology, kinematics and density
The jet in NGC 2392 consists mostly of two blobs of similar angular extent and a few fainter outer knots (Fig. 4-a). These three components will be referred to hereafter as the inner, mid and outer jets, respectively. Despite the morphological differences between the Western and Eastern components, the three components of the jet appear to twist point-symmetrically from the central star in a subtle S-shaped morphology. The total flux in the [N ii] 6584 Å emission line is 6.610-14 erg cm-2 s-1, i.e., approximately 1000 times fainter than the nebula emission in this line. The average (peak) surface brightness of the jet in this line is 1.510-16 (4.510-16) erg cm-2 s-1 arcsec-2, with a jet-to-nebula surface brightness ratio peaking at 0.5 for the mid jet, but staying lower than 0.01 for the inner jet that is projected onto the bright inner shell.
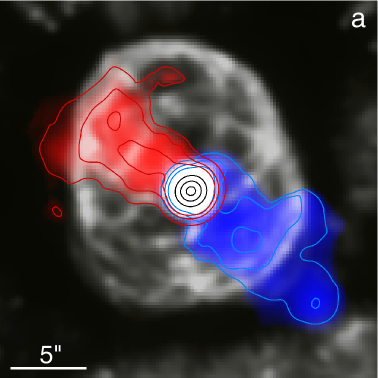
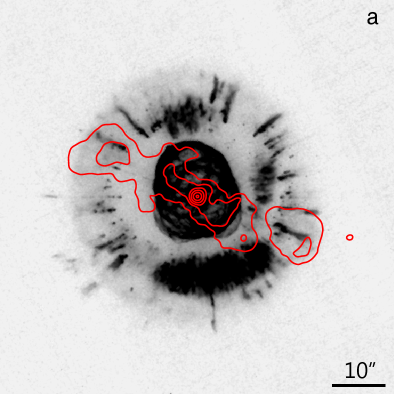
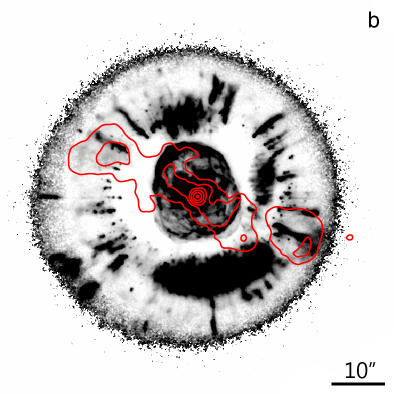
The comparison of the jet morphology and spatial extent with the nebular emission shown in Figure 5 is clarifying. In spite of the much brighter nebular emission, the inner jet can be traced down to exactly to the location of the central star of NGC 2392 (Fig. 5-left). The inner jet brightens then at a location immediately interior to the inner shell rim and breaks through the walls of the inner shell reaching the nebular outer shell (Fig. 5-left). Meanwhile, the mid jet extends across the nebula outer shell, with its outermost tips being found outside the nebular edge (Fig. 5-right). The outer jet is definitely beyond the nebular outermost edge.
The velocity map in Figure 4-b shows the Western component of the jet to approach and the Eastern component to recede from us. The jet velocity varies steadily with radius, with a notable 20 km s-1 increase from the inner to the mid jet and a small decrease between the mid and outer jets. The velocity breaks among the different components of the outflow are suggestive of episodic ejections, with small changes in the direction of the motion of the different components of the outflow. On the other hand, the velocity dispersion in Figure 4-c is notably small, close to the thermal width of the line at an electronic temperature () of 10,000 K. Thus, although the varying morphology of the approaching and receding components of the jet hints at a complex dynamics of the outflow in its interaction with the nebula, the coherent kinematics rather implies a steady motion of the gas in each component of the jet with little interaction with the bulk of the nebular material.
The GTC MEGARA high-dispersion IFS observations presented in panels a, b and c of Figure 4 provide the first clean and complete view of the morphology and kinematics of the jet of NGC 2392 in the [N ii] 6584 Å emission line. The spatial extent of the inner jet could not be described in previous works based on Fabry-Perot (Reay et al., 1983) and systematic mappings using multi-long-slit echelle spectroscopic (Balick, 1987; García-Díaz et al., 2012) observations due to the extremely low emission contrast between the inner jet and the inner shell. That issue is further aggravated by the unexpectedly (Jacob et al., 2013) fast expansion velocity of this shell (120 km s-1, García-Díaz et al., 2012), which makes difficult to deblend the emission of the jet from that of the inner shell. On the other hand, the outer jet could not be detected in previous observations due to its low surface brightness.
The morphology of the jet in the [S ii] 6716,6731 Å emission lines (Fig. 4-d) is very similar to that in [N ii] although the total flux in the [S ii] lines is 1.310-14 erg cm-2 s-1, i.e., about 5 times fainter. The average (peak) surface brightness of the [S ii] emission lines is 5.710-17 (1.410-16) erg cm-2 s-1 arcsec-2. The [S ii] 6716 Å to [S ii] 6731 Å line ratio free from nebular emission has been used to estimate the electronic density () of the material in the jet assuming a of 10,000 K (Fig. 4-a). The density of the jet is lower than that of the nebula (Pottasch et al., 2008), with values of in the range from the low-density regime 100 cm-3 up to a few thousands cm-3, for a median of 380160 cm-3. The integrated values of for the different components of the jet reveal a density gradient, from cm-3 for the inner jet, cm-3 for the mid jet, and at the low-density regime cm-3 for the outer jet.
In retrospect, we have examined the HST WFPC2 images of NGC 2392 to search for the jet emission. The inner jet, projected onto the bright emission of the inner shell, cannot be detected, neither can the weak emission from the outer jet, but it is possible to identify in the [N ii] and [S ii] images and [N ii]/[O iii] and [S ii]/[O iii] ratio maps the emission from the mid jet projected onto the outer shell (Fig. 6). The morphology of the mid jet shown by the GTC MEGARA data is confirmed in these HST images and ratio maps; the Eastern mid jet is revealed as a curving-blob, whereas the Western mid jet has a loop-like morphology with brighter emission at its tip. We remark that the identification of the emission from the mid jet in HST images and ratio maps has become possible only after a close comparison with the GTC MEGARA data, as the emission from the mid jet is basically indistinguishable from the numerous low-velocity patches of diffuse emission of the outer shell.
3.2 Jet mass
The ionized mass of a nebula can be derived using the relationship:
| (1) |
if is derived from density diagnostic emission lines and in units of erg cm-2 s-1, in kpc, and in 10,000 K (Pottasch, 1984). It is possible to derive the intrinsic H flux from the observed H flux adopting the recombination case B for an H to H theoretical ratio of 2.86 (Osterbrock & Ferland, 2006) and correcting the reddening using a value of 0.23 for (H)(Pottasch et al., 2008). Since it is not possible to build a complete map of the surface brightness in the H emission line, the [N ii] 6584 Å to H emission line ratio has been measured in spectra extracted in a number of representative apertures and its average and dispersion values estimated to be .
Accordingly, the intrinsic H flux is derived to be erg cm-2 s-1. Adopting the distance of kpc derived from the Gaia EDR3 parallax (Gaia Collaboration, 2020) and assuming a of 10,000 K, an ionized mass of is derived for the jet of NGC 2392. The error bar includes the 1- uncertainties in flux, distance, and electronic density.
3.3 Jet inclination, velocity, age and mass loss rate
Besides the jet mass, its inclination with the line of sight is a key parameter that would allow the determination of its space velocity, age, and mass-loss rate. In general, it would not be possible to derive the inclination of a jet unless additional assumptions were adopted. As for the jet of NGC 2392, its inclination angle has been proposed to be 7∘ assuming it has the same age of the inner shell (Gieseking et al., 1985) and in the range – assuming it shares the same tilt with the line of sight of the inner shell (O’Dell & Ball, 1985). The inner jet is found at an average PA on the plane of the sky 55∘ and then it twists to 70∘ in the mid jet (Fig. 4-a). The jet is thus clearly misaligned with the inner shell whose symmetry axis PA has been estimated to be – (García-Díaz et al., 2012; O’Dell et al., 1990), questioning the above assumptions on the similarity between the jet and inner shell inclinations.
The S-shaped morphology of the jet and its correlated radial velocity variations (Fig. 4-a and b) are consistent with the spatio-kinematic behavior of an episodic precessing jet. Following Guerrero & Manchado (1998), a precessing jet can be described by the half-aperture angle of the precession cone (), inclination angle of its symmetry axis with the line of sight () and space velocity (). Since the approaching and receding components of the jet are found at different sides of the central star, it is inferred that the half-aperture angle of the precession cone is smaller than the inclination angle as assumed in Figure 7. The maximum and minimum systemic radial velocities of the jet ( and ) depend on the expansion velocity of the jet and on and as
| (2) |
| (3) |
which can be expressed as
| (4) |
Since is not known but it can be substituted using equation (2), after some calculations we derive the following expression
| (5) |
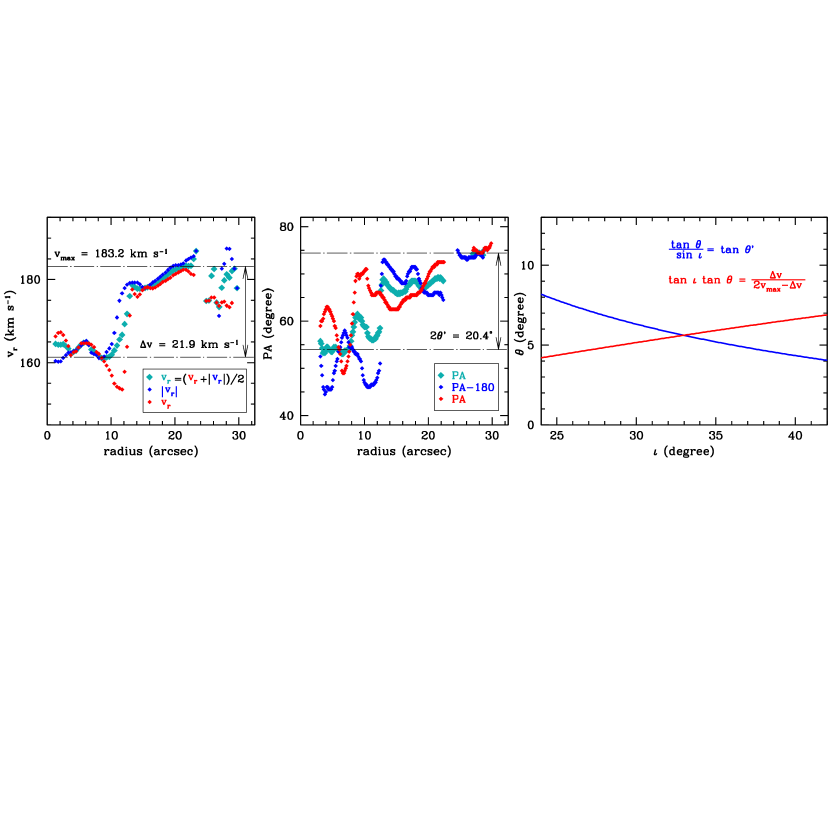
The radial dependence of the systemic radial velocity of the jet () has been obtained by computing its average value at each radius from Figure 4-b. The values of for the approaching and receding jet and its average value are shown in Figure 8-left. From this figure, values of 183.2 km s-1 and 21.9 km s-1 are obtained for and , respectively. The small value of the ratio hints at small values of and .
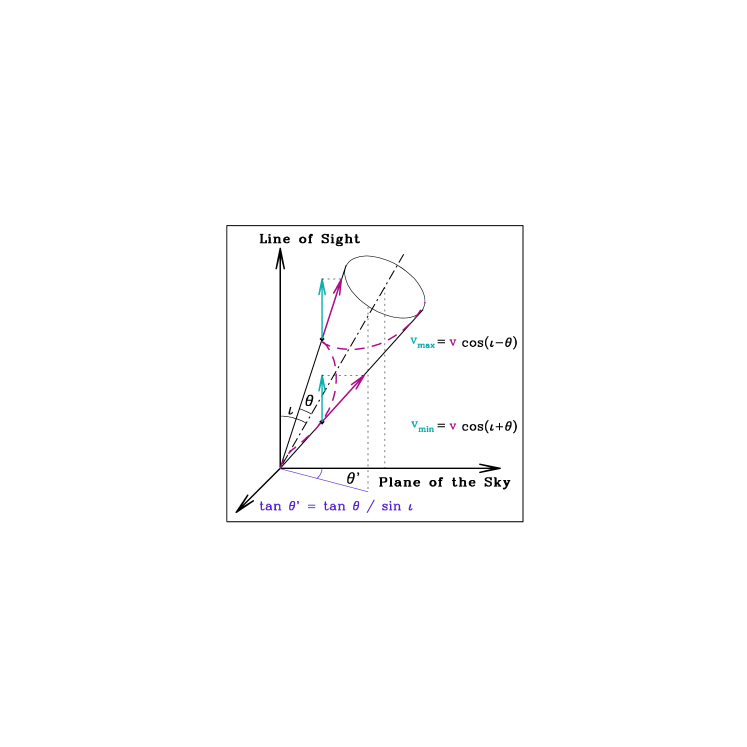
The projection of the half-aperture angle of the precession cone on the plane of the sky () depends on and according to
| (6) |
as can be inferred from Figure 7. The averaged PA at each radius of the jet has been computed from the surface brightness map in Figure 4-a. The PA of the receding and approaching components of the jet and their average value are shown in Figure 8-center, from where a value of 10.2∘ is derived for .
The values of and define the black curve in Figure 8-right. Similarly, the value of defines the purple curve in Figure 8-right. An inclination angle of the jet of 33.0∘ and half-aperture angle of the precession cone of 5.6∘ are defined where these two curves cross. According to equation (2), the space velocity of the jet is derived to be 206 km s-1.
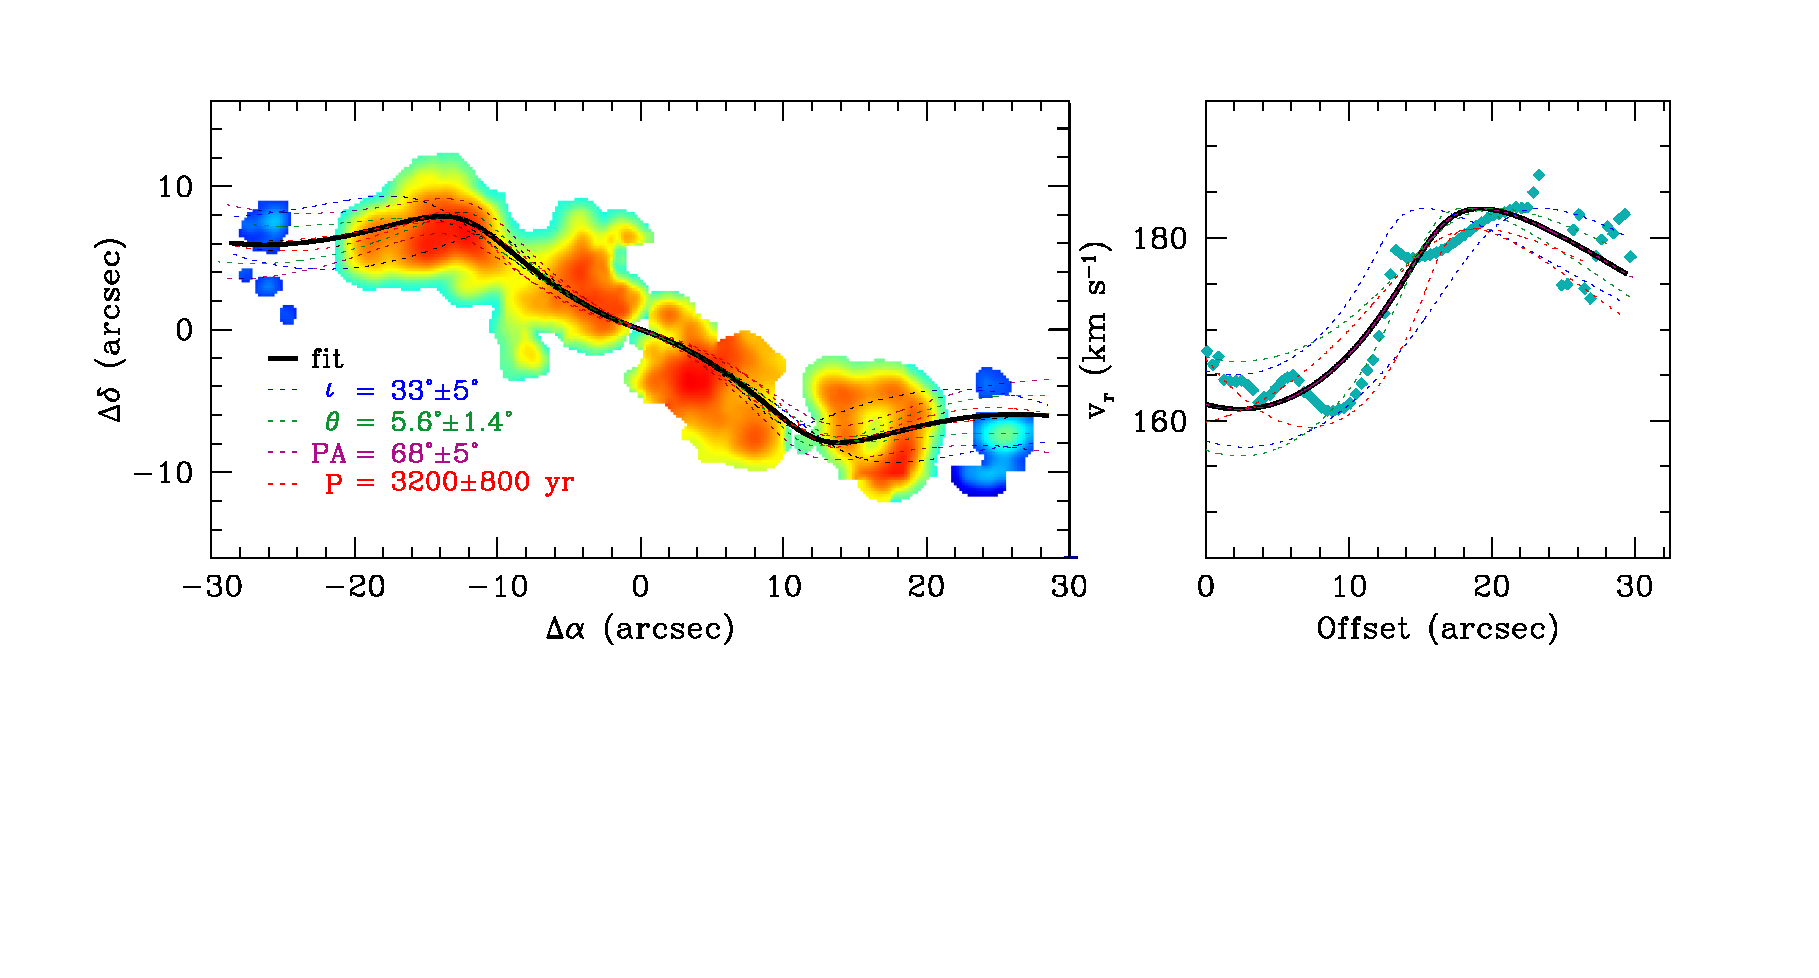
The S-shaped morphology of the jet and its velocity variations have been subsequently modeled assuming a continuous ejection of a precessing jet with the velocity , inclination and aperture angle given above. This simple analytical model indeed provides a reasonable fit to the observed morphology (Fig. 9-left) and kinematics (Fig. 9-right) of the jet of NGC 2392 –taking into account their notable complexity and the episodic nature of the ejection– for a precession period of 3200 yr and an age of 2400 yr at the adopted Gaia distance of 1.84 kpc. The full linear span of the jet would be 1.0 pc, i.e., 2.3 times larger than the nebular diameter of 0.43 pc derived from its angular size. Its mass-loss rate would be yr-1 and the mechanical luminosity 0.4 , a tiny fraction of the 3000–6000 stellar luminosity (Herald & Bianchi, 2011).
Figure 9 is additionally overlaid with variations of the different parameters still producing reasonable fits to the observations. These variations define the uncertainty in jet parameters, but they can be rather envisaged as intrinsic velocity or direction fluctuations in the launch of the jet or variations caused by its interaction with the nebular material that are not considered in the simplistic model used here to describe its morphology and kinematics.
4 Discussion
4.1 The jet and the nebula
The brightening of the inner jet at the inner shell rim (Fig. 5-left) suggests the interaction of the jet with the inner shell. Projection effects can be important, though, as the inner jet has a full linear span 0.4 pc, whereas the maximum size of the inner shell, as projected in the plane of the sky, is only 0.2 pc. The size of the inner shell along the line of sight is most likely considerably larger, as suggested by the model presented by García-Díaz et al. (2012), may be comparable to the inner jet extent. The similarity between the expansion velocity of the inner shell, 120 km s-1 (García-Díaz et al., 2012), and that of the inner jet at the location of its rim, 150 km s-1, suggests that the inner shell is being dragged by the jet.
It is also worthwhile noting the correspondence between the mid jet morphology and some cometary knots of the outer shell. The loop-like feature of the Western mid jet seems to surround a cometary knot and the Eastern mid jet curves as it seems to reach a cometary knot. These morphological correspondences might be suggestive of the interaction of the jet with nebular material, but we note that those cometary knots have been suggested to be close to the plane of the sky, whereas the jet is only 33∘ apart from the line of sight.
A comprehensive study of the detailed spatio-kinematic properties of the inner and outer shells of NGC 2392 and its cometary knots to investigate the possible jet-nebula interactions will be the goal of a subsequent work (Rechy-García et al., in preparation).
4.2 A unique on-going jet among PNe
The close-up view of the jet emission in Figure 5-left shows that, within the spatial resolution provided by the present observations, the jet of NGC 2392 emanates from its central star, confirming previous suggestions based on the emergence of the jet emission from the stellar continuum in high-dispersion echelle spectroscopic observations (Gieseking et al., 1985; García-Díaz et al., 2012). On these grounds, the high-ionization polar stellar wind proposed for its central star (Prinja & Urbaneja, 2014) could be interpreted as the onset of the jet rather than an isotropic stellar wind. Indeed, the terminal velocity of such stellar wind 300 km s-1 is abnormally low for central stars of PNe, but close to the velocity of the jet.
The launch mechanism of the jet of NGC 2392 is thus presently active, i.e., it is an on-going jet (Miszalski et al., 2019). This is also the case of the late-AGB jets in BD+46∘442 and IRAS 191353937 (Bollen et al., 2019). The mass-loss rates of those jets is M⊙ yr-1 and M⊙ yr-1, respectively (Bollen et al., 2020). Adopting a ratio of ejected mass-loss rate to accretion rate for the jet in the range 0.01–0.3 for NGC 2392, similar to that adopted by Bollen et al. (2020), the accretion rate would be in the range –10-5 M⊙ yr-1. The high-regime of accretion of late-AGB jets sustained by the heavy stellar mass-loss at this phase is apparently not operating in NGC 2392, which is a mature PN.
This seems natural, as once the central star of a PN enters the post-AGB phase and its heavy mass-loss ceases, the accretion onto a companion and the jet formation can be expected to come to an end too. Indeed, jets are found to be mostly coeval with their PNe (Guerrero et al., 2020). Only the jets of the post-common envelope (post-CE) PNe Hb 4, NGC 6337 and NGC 6778 (Derlopa et al., 2019; García-Díaz et al., 2009; Tocknell et al., 2014) have been proposed to originate during the post-AGB phase. These post-CE jets would be fed by the re-accretion of nebular gas or material from the remains of a circumbinary disk onto the primary (Soker & Livio, 1994).
Besides the case of Hen 2-90 (Sahai & Nyman, 2000; Guerrero et al., 2001), which might be a symbiotic star rather than a PN (Schmeja & Kimeswenger, 2001), all the jets in PNe, including those in post-CE systems, are spatially detached from their central stars, with notable spatial gaps from them to the innermost regions of the jets. It is then implied that the jet collimation in PNe ceased hundreds to thousands of years ago, making the jet in NGC 2392 the only on-going one observed in a mature PN.
4.3 NGC 2392 in the ecosystem of PNe
NGC 2392 has been proposed to be an analogue to NGC 6543 and NGC 7009 with a pole-on orientation (García-Díaz et al., 2012). More naturally, the large jet-to-nebula size ratio of NGC 2392 derived above, 2.3, and the fast expansion velocity and S-shaped morphology of its jet would make it rather an analogue to Fleming 1, the archetype of PNe with bipolar, rotating, episodic jets (BRET, López et al., 1993; Palmer et al., 1996). The physical structure of NGC 2392, with its ring of high-density knots (O’Dell et al., 1990) and long precessing jet is also reminiscent of IPHASX J194359.5170901 (Corradi et al., 2011). Interestingly, both Fleming 1 and IPHASX J194359.5170901 harbour post-CE binary systems (Boffin et al., 2012; Miszalski et al., 2013). Their jets have been suggested to pre-date their formation (Tocknell et al., 2014), which may be the case of NGC 2392 as well given the age of yr kpc-1 proposed for the inner shell (O’Dell & Ball, 1985). NGC 2392 would then be a young twin of Fleming 1 and IPHASX J194359.5170901 caught in the short time lapse between the PN formation and the jet extinction.
Finally, it is worth noting that the central star of NGC 2392 has recently been recognized to be in a binary system (Miszalski et al., 2019). Its orbital period is yet unsettled, as periodic radial velocity variations of 3 hours (Prinja & Urbaneja, 2014) and 1.9 days (Miszalski et al., 2019) and a hard X-ray emission modulation of 6 hours (Guerrero et al., 2019) have been reported. The companion of the central star of NGC 2392 has been proposed to be a hot white dwarf as its effective temperature 43,000 K (Méndez et al., 2012) cannot explain its high nebular excitation, being notably discrepant from the higher He ii Zanstra temperature (Heap, 1977; Pottasch et al., 2008; Miszalski et al., 2019). This would make the central star of NGC 2392 one of the few double-degenerate ones as Fleming 1 itself or Hen 2-428 (Boffin et al., 2012; Santander-García et al., 2015; Reindl et al., 2020). The present-day launch and collimation of a jet in NGC 2392 strongly supports the presence of a binary system and an accretion disk around a compact source at its heart. The low mass-loss rate of its central star, yr-1, is not capable however to feed the material in the jet (Herald & Bianchi, 2011), which would be rather accreted from a circumbinary disk remnant of a CE episode late in the AGB phase. Indeed, the peculiar chemical abundances of the central star of NGC 2392 have been suggested to originate in such a CE phase (Méndez et al., 2012). The central star of NGC 2392 would be in its final transition towards a double-degenerate binary system, when the second component of the system evolves into the white dwarf stage ejecting its envelope to form a PN-like shell. It is of upmost importance to determine the real orbital period and masses of the double-degenerate binary system in NGC 2392 to assess its possible fate as a Type Ia supernova.
5 Summary
The jet in NGC 2392 was the first fast collimated outflow ever detected in a PN, yet a direct image of this jet was lacking. This peculiar situation was caused not only by the low surface brightness of the jet projected onto the much brighter nebular emission, but also by the high expansion velocity of the inner shell, close to the velocity of the jet in the innermost regions of NGC 2392. The lack of an exact description of the morphology and kinematics of the jet in NGC 2392 impeded a clear understanding of its role in the formation and shaping of this PN.
To overcome these difficulties, we have obtained high-dispersion IFS observations of NGC 2392 using MEGARA and its high-resolution VPH665-HR grism at the 10.4 m GTC in the spectral range of the [N ii] 6548,6584 Å, H, and [S ii] 6716,6731 Å emission lines. The 2D spectra presented here, with their spectral resolution 16 km s-1, unprecedentedly resolves the [N ii] and [S ii] emission of the jet from that of the nebula to build maps of their surface brightness, velocity, velocity width, and electronic density and to derive its total mass.
The jet of NGC 2392 is found to consist mostly of two large blobs and a few fainter knots emerging from the central star and extending outside the edge of the outer shell. The S-shaped morphology of the jet and its correlated velocity variations are highly suggestive of a precessing jet. Adopting a model of the continuous ejection of a precessing jet, an inclination angle with the line of sight of 33.0∘ and a space velocity of 206 km s-1 are derived. Accordingly, the linear span of the jet of NGC 2392 is found to be 1.1 pc, its age 2600 yr, and its mass-loss rate yr-1.
The linear size of the jet of NGC 2392 is thus 2.3 times larger than the nebula. The jet pierces through the bright inner shell, brightening at its rim. The expansion velocity of the jet at these locations is close to that of the inner shell, suggesting that the jet powers the abnormally high speed expansion of the inner shell of NGC 2392 rather than its feeble stellar wind. The jet of NGC 2392 may be the primary mechanism for the shaping and expansion of its inner shell.
Very importantly, the jet in NGC 2392 is found to be currently active, i.e., it is being launched right now. This is unique among the many collimated outflows found in PNe, which have been hitherto described as fossil evidence of previous ejections. The hard X-ray emission from the central star of NGC 2392 and the high excitation of the nebula strongly support a white dwarf as the binary companion of the central star. The jet in NGC 2392 would arise from an accretion disk around this compact companion fed by the circumbinary disk of a previous common-envelope phase.
References
- Balick (1987) Balick, B. 1987, AJ, 94, 671.
- Balick et al. (1987) Balick, B., Preston, H. L., & Icke, V. 1987, AJ, 94, 1641.
- Balick & Frank (2002) Balick, B. & Frank, A. 2002, ARA&A, 40, 439.
- Balick et al. (2021) Balick, B., Guerrero, M. A., & Ramos-Larios, G. 2020, ApJ, in press, arXiv:2009.01701
- Boffin et al. (2012) Boffin, H. M. J., Miszalski, B., Rauch, T., et al. 2012, Science, 338, 773.
- Bollen et al. (2020) Bollen, D., Kamath, D., De Marco, O., et al. 2020, A&A, 641, A175.
- Bollen et al. (2019) Bollen, D., Kamath, D., Van Winckel, H., et al. 2019, A&A, 631, A53.
- Cazzoli et al. (2020) Cazzoli, S., Gil de Paz, A., Márquez, I., et al. 2020, MNRAS, 493, 3656.
- Corradi et al. (2011) Corradi, R. L. M., Sabin, L., Miszalski, B., et al. 2011, MNRAS, 410, 1349.
- Derlopa et al. (2019) Derlopa, S., Akras, S., Boumis, P., et al. 2019, MNRAS, 484, 3746.
- Gaia Collaboration (2020) Gaia Collaboration, Brown, A.G.A., et al. 2020, A&A, in preparation
- García-Díaz et al. (2012) García-Díaz, M. T., López, J. A., Steffen, W., et al. 2012, ApJ, 761, 172.
- García-Díaz et al. (2009) García-Díaz, M. T., Clark, D. M., López, J. A., et al. 2009, ApJ, 699, 1633.
- Gieseking et al. (1985) Gieseking, F., Becker, I., & Solf, J. 1985, ApJ, 295, L17.
- Gil de Paz et al. (2018) Gil de Paz, A., Carrasco, E., Gallego, J., et al. 2018, Proc. SPIE, 10702, 1070217.
- Guerrero & Manchado (1998) Guerrero, M. A. & Manchado, A. 1998, ApJ, 508, 262.
- Guerrero et al. (2001) Guerrero, M. A., Miranda, L. F., Chu, Y.-H., et al. 2001, ApJ, 563, 883.
- Guerrero et al. (2020) Guerrero, M. A., Rechy-García, J. S., & Ortiz, R. 2020, ApJ, 890, 50.
- Guerrero et al. (2019) Guerrero, M. A., Toalá, J. A., & Chu, Y.-H. 2019, ApJ, 884, 134.
- Heap (1977) Heap, S. R. 1977, ApJ, 215, 864.
- Herald & Bianchi (2011) Herald, J. E. & Bianchi, L. 2011, MNRAS, 417, 2440.
- Jacob et al. (2013) Jacob, R., Schönberner, D., & Steffen, M. 2013, A&A, 558, A78.
- Kwok et al. (1978) Kwok, S., Purton, C. R., & Fitzgerald, P. M. 1978, ApJ, 219, L125.
- López et al. (1993) López, J. A., Meaburn, J., & Palmer, J. W. 1993, ApJ, 415, L135.
- Markwardt (2009) Markwardt, C. B. 2009, Astronomical Data Analysis Software and Systems XVIII, 411, 251
- Méndez et al. (2012) Méndez, R. H., Urbaneja, M. A., Kudritzki, R.-P., et al. 2012, Planetary Nebulae: An Eye to the Future, Proceedings of the International Astronomical Union, IAU Symposium, 283, 436. Eds. A. Manchado, L. Stanghellini & D. Schönberner
- Miszalski et al. (2019) Miszalski, B., Manick, R., Van Winckel, H., et al. 2019, PASA, 36, e018.
- Miszalski et al. (2013) Miszalski, B., Boffin, H. M. J., & Corradi, R. L. M. 2013, MNRAS, 428, L39.
- O’Dell et al. (1990) O’Dell, C. R., Weiner, L. D., & Chu, Y.-H. 1990, ApJ, 362, 226.
- O’Dell & Ball (1985) O’Dell, C. R. & Ball, M. E. 1985, ApJ, 289, 526.
- Osterbrock & Ferland (2006) Osterbrock, D. E. & Ferland, G. J. 2006, Astrophysics of gaseous nebulae and active galactic nuclei, 2nd. ed. by D.E. Osterbrock and G.J. Ferland. Sausalito, CA: University Science Books, 2006
- Palmer et al. (1996) Palmer, J. W., Lopez, J. A., Meaburn, J., et al. 1996, A&A, 307, 225
- Pascual et al. (2019) Pascual, S., Cardiel, N., Gil de Paz, A., et al. 2019, Highlights on Spanish Astrophysics X, 227
- Pottasch et al. (2008) Pottasch, S. R., Bernard-Salas, J., & Roellig, T. L. 2008, A&A, 481, 393.
- Pottasch (1984) Pottasch, S. R. 1984, Astrophysics and Space Science Library, Dordrecht: Reidel, 1984.
- Prinja & Urbaneja (2014) Prinja, R. K. & Urbaneja, M. A. 2014, MNRAS, 440, 2684.
- Reay et al. (1983) Reay, N. K., Atherton, P. D., & Taylor, K. 1983, MNRAS, 203, 1087.
- Reindl et al. (2020) Reindl, N., Schaffenroth, V., Miller Bertolami, M. M., et al. 2020, A&A, 638, A93.
- Sahai & Nyman (2000) Sahai, R. & Nyman, L.-Å. 2000, ApJ, 538, L145.
- Sahai & Trauger (1998) Sahai, R. & Trauger, J. T. 1998, AJ, 116, 1357.
- Santander-García et al. (2015) Santander-García, M., Rodríguez-Gil, P., Corradi, R. L. M., et al. 2015, Nature, 519, 63.
- Schmeja & Kimeswenger (2001) Schmeja, S. & Kimeswenger, S. 2001, A&A, 377, L18.
- Soker & Livio (1994) Soker, N. & Livio, M. 1994, ApJ, 421, 219.
- Tocknell et al. (2014) Tocknell, J., De Marco, O., & Wardle, M. 2014, MNRAS, 439, 2014.