Solar Irradiance Variability Due To Solar Flares Observed in Lyman-alpha Emission
1 Introduction
sec:intro The Lyman-alpha (Ly) line of neutral hydrogen at 1216Å is the brightest emission line in the solar spectrum. It results from the 2p–1s transition, and in the quiet-Sun, its formation height ranges from the mid-chromosphere (6,000 K; line wings) to the base of the transition region (40,000 K; line core). During solar flares, nonthermal electrons deposit their energy at these layers, generating localised heating and ionisation at the flare footpoints. Precisely how the Ly line responds to this injection of energy remains unknown due to the lack of spectrally-resolved measurements of this fundamental line during flares. One exception is a serendipitous observation of the 28 October 2003 X17 flare by Woods et al. (2004). They found that the line core increased by around 20% while the line wings were enhanced by around factor of two, with the blue wing responding more than the red wing (see also Canfield and van Hoosier 1980, Brekke et al. 1996, and Milligan and Chamberlin 2016). However, even in this case the data were recorded with a scanning spectrograph and so different parts of the line profile may have been sampled at different stages of the flare’s impulsive phase.
Ly is believed to be a significant radiator of flare energy, accounting for several percent of the total radiated energy in a single emission line (Rubio da Costa et al., 2009; Milligan et al., 2014). It has also recently been shown that flare-induced acoustic oscillations can be detected in disk-integrated Ly observations, suggesting a potential diagnostic for the dissipation of mechanical energy as well (Milligan et al., 2017, 2020). The study of flares in Ly is also crucial for the field of space weather as photons at this wavelength can induce chemical and dynamic changes in planetary atmospheres (Chubb et al., 1957; Lean, 1985; Woods et al., 1995). During quiescent solar conditions, Ly photons get absorbed in the D-layer of Earth’s ionosphere, along with solar X-rays, although Raulin et al. (2013) were unable to detect any appreciable D-layer effects during seven small-to-moderate flares observed in Ly; these flares were found to produce Ly enhancements of %. However, during an X-class flare that exhibited a 30% Ly enhancement, Milligan et al. (2020) noted that the impulsive increase in Ly emission correlated with induced currents in the E-layer due to the ionization of nitric oxide as determined from magnetometer data. The corresponding D-layer response occurred several minutes later in line with the more gradually varying soft X-rays (SXR). Further study of flares in Ly emission and the corresponding response of the terrestrial atmosphere is required to establish if was an isolated case, or a more common occurrence.
The few reports of solar flare observations in Ly that previously existed were mostly from broadband, disk-integrated irradiance measurements, and often focused on small numbers of events due to the limited duty cycles of instruments capable of observing flares at this wavelength (Kretzschmar, Dominique, and Dammasch, 2013; Raulin et al., 2013; Milligan et al., 2014; Kretzschmar, 2015; Milligan and Chamberlin, 2016; Dominique et al., 2018). However, Milligan et al. (2020) recently carried out a statistical study of 477 M- and X-class flares in broadband, disk-integrated Ly emission, and calculated the distribution of contrasts. It was found that most flares (95%) produced less than a 10% enhancement above background, with a maximum of 30%, although X-class flares that occurred closer to the solar limb were found to produce less of an enhancement. They also measured how the total energy radiated in Ly scaled with energy radiated in X-rays; the excess solar irradiance in Ly was found to be up to two orders of magnitude more energetic than that of the corresponding X-rays.
The study of Milligan et al. (2020) focused on larger flares as smaller GOES class events (B- and C-class) did not produce an appreciable response in Ly above the intense background. This may be due to instrumental sensitivity, or perhaps Ly emission from weaker events is not inherently significant. The aim of this paper is therefore to use a superposed-epoch analysis technique to determine how much of an enhancement these smaller flares would produce, if any, and how much this increase contributes to the solar irradiance at this wavelength. Kretzschmar et al. (2010) used this simple technique to determine the effects of solar flares on the total solar irradiance (TSI; solar flux over all wavelengths incident at the top of Earth’s atmosphere). Using the time of peak soft X-ray emission (i.e. the 1–8Å channel from the X-Ray Sensor (XRS) on-board the Geostationary Operational Environmental Satellite (GOES; Hanser and Sellers 1996)) as a key time marker for several hundred flares, the corresponding TSI time series around each flare could then be co-added (or averaged) to reduce the background fluctuations (due to acoustic oscillations and granulation), thereby increasing the coherent flare signal. Similarly, Kretzschmar (2011) followed this study by using the same technique on visible, EUV, and SXR irradiance datasets from the Solar and Heliospheric Observatory (SOHO) to show that all flares can be considered to be white light flares, and that the visible component of flare emission (corresponding to a temperature of 9,000 K) can amount to 70% of the total radiated energy. Section \irefsec:data_anal of this paper describes the dataset that was used and how the analysis technique was applied. The results are presented in Section \irefsec:results, while a summary and discussion are given in Section \irefsec:conc.
2 Data Analysis
sec:data_anal The Extreme Ultra-Violet Sensor (EUVS; Viereck et al. 2007) onboard the GOES-N series of satellites (GOES-13, GOES-14, and GOES-15) comprises five channels, A, B, C, D, and E, covering the 50–170Å, 240–340Å, 200–620Å, 200–800Å, and 1180–1250Å wavelength ranges, respectively, with the E-channel centered on the Ly line at 1216Å. Each broadband channel samples the solar EUV irradiance at 10.24 s cadence, compared to the more familiar GOES-N/XRS which samples the 0.5–4Å and 1–8Å wavelength ranges at 2 s cadence. While the availability of EUVS data from GOES-13 and GOES-14 has been inconsistent since their launches, GOES-15 has provided continuous coverage since its launch in 2010. However, only data taken up until 6 June 2016 have been made publicly available at the time of writing. EUVS-E data are scaled to a Whole Heliosphere Interval quiet-Sun reference spectrum111http://lasp.colorado.edu/lisird/data/whi˙ref˙spectra (Woods et al., 2009), providing Ly irradiance measurements in physical units of W m-2. Thus the data may not necessarily reflect flare-related time variations of the line profile, generating some systematic uncertainties. To correct for detector degradation, the EUVS-E data are scaled to the daily-averaged data from the Solar–Stellar Irradiance Comparison Experiment (SOLSTICE; McClintock, Rottman, and Woods 2005) aboard the Solar Radiation and Climate Experiment (SORCE), and only Version 4 of the EUVS-E data were used in this study222https://www.ngdc.noaa.gov/stp/satellite/goes/doc/GOES˙NOP˙EUV˙readme.pdf.

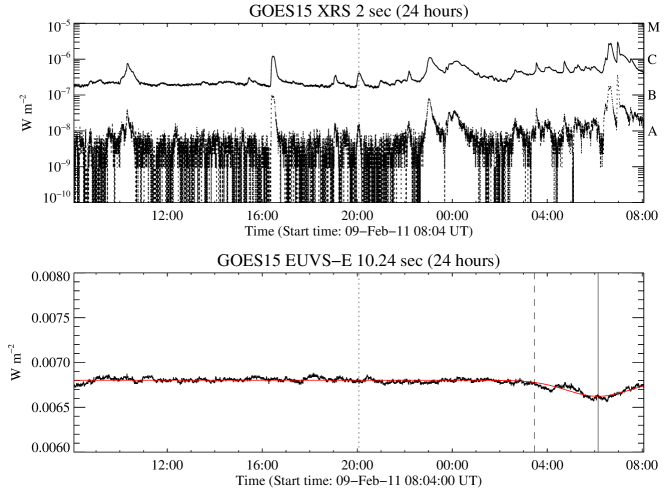
Figure \ireffig:72hr_goes shows a 72-hour period from February 2011, during which, flares of a range of X-ray magnitudes occurred (top panel; the vertical dotted lines in both panels denote the peak times of each X-ray event). However, over the same period, only the largest of these events produced a discernible response in Ly emission (bottom panel). Also visible in the bottom panel are the daily dips in detected Ly emission due to attenuation by the Earth’s geocorona - which is opaque to Ly photons (Meier and Prinz, 1970; Baliukin et al., 2019) - for a few hours during each GOES orbit. For every event considered in this study, a 24 hour period of Ly emission centred on the peak X-ray time of the flare was fitted with a constant, equal to the modal value, plus an inverted Gaussian (red curve in the bottom panel of Figure \ireffig:bflare_ex) to account for the geocoronal dip given that the amount of attenuation varies throughout the year. As the effect of the geocorona on Ly flare irradiance is likely to be nonlinear, any events that occurred within (vertical dashed line) of the minimum of each daily dip (vertical solid line), were omitted from this study.
The start, peak, and end times of every X-ray flare are listed in the GOES event list333https://www.ngdc.noaa.gov/stp/satellite/goes/index.html hosted by the National Oceanic and Atmospheric Administration/Space Weather Prediction Center (NOAA/SWPC). However this list does not always include a flare’s location, whereas the Heliophysics Event Knowlegebase (HEK)444https://www.lmsal.com/hek/ does, although it is missing several months of data throughout Solar Cycle 24 (Milligan and Ireland, 2018). The superposed-epoch technique employed in this study uses the peak time of the of all X-ray flares above B1 from the HEK database as a fiducial time after removing any events affected by geocoronal absorption, eclipse periods, or corrupted data. This resulted in 3123 B-class and 4972 C-class flares555Note that there were more C-class flares than B-class flares due to the high X-ray background around the time of solar maximum.. While the Ly component of M- and X-class flares can often be detected above the solar background, the averaged profiles of 453 M- and 31 X-class flares were also included in this analysis. This then allows the average flux (in W m-2) and contrast (relative percentage increase) to be measured for each GOES classification (Section \irefsec:results). Furthermore, given the abundance of events observed by GOES-15/EUVS-E over Solar Cycle 24, and with knowledge of their locations from the HEK, the average Ly profile can be determined as a function of heliographic angle in order to establish any potential center-to-limb variation (CLV; Section \irefsec:clv).
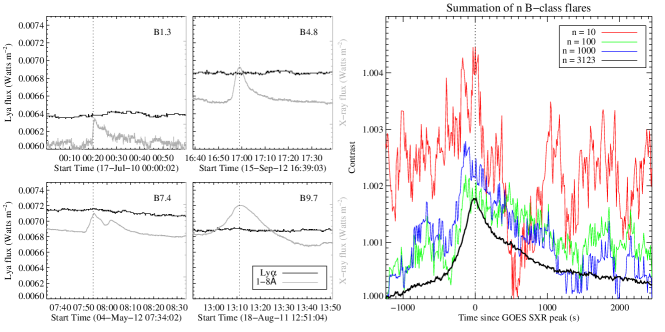
A one-hour time range of the Ly time series, from 20 minutes prior to the X-ray peak to 40 minutes after, were averaged over for all flares of a given GOES class. Four B-class flares are shown in the left hand panels of Figure \ireffig:nbflares as an example. For each individual event, there does not appear to be any discernible Ly enhancement due to the flare, but by averaging over increasing numbers of Ly time series of equal length, the signal-to-noise ratio is vastly improved as shown in the right hand panel. The red, green, and blue profiles represent the summation of 10, 100, and 1000 randomly chosen B-class flares, respectively. The smoothly-varying solid black lightcurve is the result of averaging all 3123 B-class flares considered. This illustrates how the signal-to-noise ratio is increased by increasing the number of events added together.
3 Results
sec:results


The four panels in Figure \ireffig:spe_flares show the average Ly time profiles for B-, C-, M-, and X-class flares. All profiles show a clear and distinct peak in Ly emission that was not readily visible for individual events, particularly weaker GOES classes. The average B-class flare produced an enhancement of 0.18% above background, while C-class flares showed a 0.35% increase. These values are in agreement with those reported by Raulin et al. (2013) for several C-class flares observed by PROBA-2/LYRA. Most individual M- and X-class flares can be readily observed in Ly, as shown by Milligan et al. (2020), but are included here for completeness. M-class flares were measured to increase the solar irradiance by 1.5% on average, while X-classes exhibited a 3.8% increase in Ly above background. Although the flare-related changes in Ly irradiance quoted here are quite small, these changes can still correspond to a significant amount of radiated energy. This confirms that weaker flares do have associated responses in Ly emission that are ordinarily obscured by the intense solar background. This will have significant implications for more sensitive Ly instruments that aim to observe solar flares in the future.
The peak timings of the averaged profiles are also shown in Figure \ireffig:spe_flares as vertical dotted lines. For B-class flares, the average peak time coincides with the peak of the SXR emission for the summed events to within one GOES-15/EUVS-E time bin (10.24 s). For C-class flares, Ly peaks slightly earlier than the X-ray peak (40.96 s; four time bins), while M- and X-class flares peak even earlier still (51.20 s and 71.68 s, respectively). This somehow implies that Ly emission from B-class flares may be thermally generated, while C-, M-, and X-class flares exhibit more nonthermal Ly emission in accordance with the Neupert Effect (Neupert, 1968). Although it is tempting to assume that this systematic change in peak timing is physically significant, great care must be taken in drawing conclusions from summed epoch analyses as individual events can sometimes skew the resulting profile.
3.1 Centre-to-Limb Variation
sec:clv
As Ly is optically thick (Woods et al., 2000), flares that occur closer to the solar limb are assumed to produce less of a response in Ly than if they had occurred at disk centre due to scattering by the increasing column mass along the line-of-sight. Milligan et al. (2020) showed that this was true for 31 X-class flares by normalising their Ly flux to their X-ray flux (which is optically thin) and showing that this ratio decreases with increasing heliocentric angle from disk centre. This center-to-limb variation was also confirmed through a stereoscopic observation of an X-class limb event as viewed by GOES-15 from Earth that was observed simultaneously by the EUV Monitor on-board the Mars Atmospheric and Volatile Evolution satellite (MAVEN/EUM; Eparvier et al. 2015), when Earth and Mars were around 90 degrees apart. After correcting for the Earth-Mars distance and light travel time, the flux detected by MAVEN (which observed the flare close to disk center) was greater than that detected by GOES.
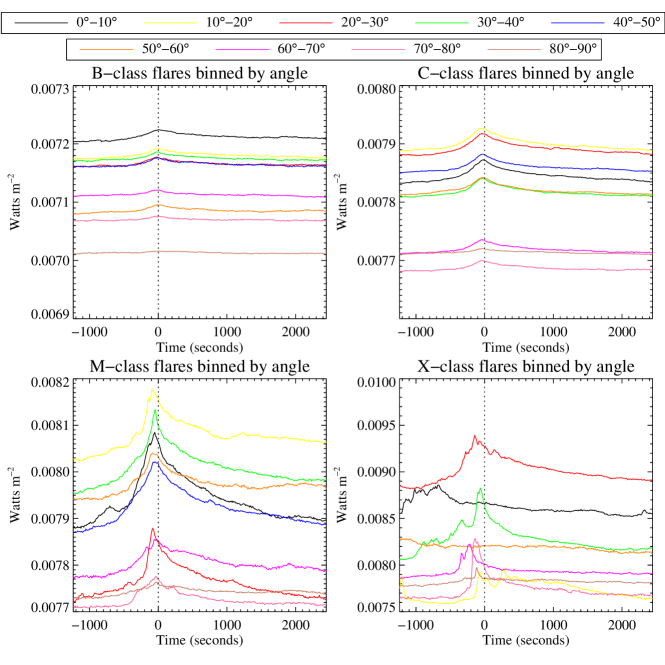
Figure \ireffig:mplot_clv_cont shows averaged flare time profiles for the four GOES classes in increments of 10 degrees from 0–90∘. In most cases, flares that occurred closer to disk center had a higher absolute flux value, and a more pronounced peak relative to the background around the time of the GOES SXR peak. This trend breaks down for X-class flares due to the diminishing number of events. To illustrate this point, Figure \ireffig:flare_clv_cont shows the contrast value (peak flux divided by minimum flux) for each heliographic angle bin for B-, C-, and M-class flares. Error bars were taken as the 1 value for each curve in Figure \ireffig:mplot_clv_cont divided by the square root of the number events in each bin (Kretzschmar et al., 2010). These data points were fitted with the commonly used CLV function:
| (1) |

as derived by Brekke and Kjeldseth-Moe (1994) and also employed by Woods, Kopp, and Chamberlin (2006) and Milligan et al. (2020). is the intensity at a given angle, is the intensity ratio at disk center, is the limb variation relative to center, and . The values of for B-, C-, and M-class flares are 1.002, 1.004, and 1.021, respectively, while the corresponding values are 0.99, 0.99, and 0.97. In agreement with Milligan et al. (2020), all flare classifications showed a smaller relative enhancement in Ly emission for flares that occurred closer to the solar limb compared to those that occurred closer to disk center. While it would be more physically meaningful to normalize each curve to their respective GOES class (Woods, Kopp, and Chamberlin, 2006), the summed nature of the superposed-epoch analysis coupled with the difficulty associated with subtracting the solar background for smaller X-ray events, make this much more of a challenge, and is likely to return similar trends, albeit with much lower -values. Note that Kretzschmar et al. (2010) and Kretzschmar (2011) did not include flares that occurred beyond 60∘ of disk center in their superposed-epoch analysis on flares in the TSI, visible, EUV, and SXR emission as they assumed that limb flares would not produce a measurable response at these wavelengths in the chromosphere.
3.2 An Unusual C-class Flare
sec:cclass
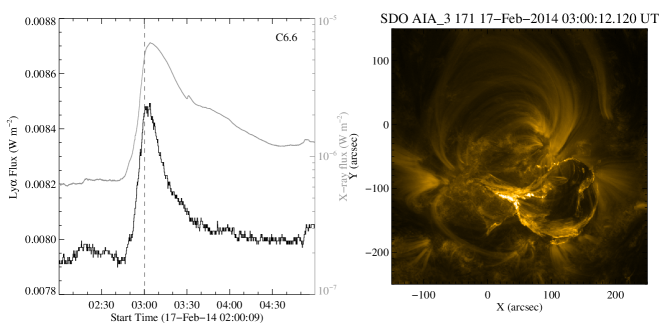
While the vast majority of B- and C-class flares do not produce a Ly signature above the bright solar background, one event in this study - a C6.6 flare that occurred on 17 February 2014 (SOL2014-02-17)- displayed a remarkable 7% enhancement. Such a degree of contrast has hitherto only been associated with a few X-class flares (Woods et al., 2004; Milligan et al., 2020). Converting the flare excess in Ly into units of energy for this event yielded a value of 1030 erg, which is comparable to that calculated for the 15 February 2011 X2.2 by Milligan et al. (2014) using Ly data from the EUV Variability Experiment (EVE; Woods et al. 2012) on-board the Solar Dynamics Observatory (SDO; Pesnell, Thompson, and Chamberlin 2012). A plot of the Ly and X-ray lightcurves for the event is shown in Figure \ireffig:c6_flare, along with a 171Å image from the Atmospheric Imaging Assembly (AIA; Lemen et al. 2012), also on SDO, taken around the time of peak emission (vertical dashed line in left hand panel). Ordinarily, flare-related increases in Ly (or indeed any inherent chromospheric emission) is primarily detected during the impulsive phase as the chromosphere is heated by precipitating particles from the corona, or late in the decay phase as hot flare plasma cools through instrumental passbands. Large increases in Ly would therefore usually be attributed to a particularly energetic beam of electrons, and/or an unusually large footpoint area. Unfortunately, hard X-ray data from the Ramaty High Energy Solar Spectroscopic Imager (Lin et al. 2002) or Fermi (Meegan et al., 2009) were not available for this event, and so the parameters of the electron distribution that may have been responsible remains unknown. However, SDO/AIA data appear to show a failed filament eruption in all EUV channels (only 171Å is shown in Figure \ireffig:c6_flare). No associated coronal mass ejection could be seen in coronagraph images around the time and location of the flare. The Ly emission from this event appears to correlate well with the main X-ray phase suggesting that the it could have been emanating from the corona as heating took place within the large volume of the filament. A similar conclusion was reached by Rubio da Costa et al. (2009) who reported co-spatial Ly (from the Transition Region and Coronal Explorer; Handy et al. 1999) and X-ray emission during a filament eruption.
4 Conclusions
sec:conc This paper presents a study of 8579 solar flares observed in the Ly line of neutral hydrogen. As weaker flares do not readily produce a Ly signature above the intense solar background at this wavelength, a superposed-epoch analysis was carried out on 3123 B-class flares and 4972 C-class flares. On average, these flares were found to exhibit a 0.1–0.3% enhancement. For completion and comparison, 453 M- and 31 X-flares were also co-added, and average increases of 1–4% were measured. For each GOES classification, flares were also summed according to their heliographic location revealing that in all cases, flares closer to disk centre displayed a greater enhancement on average that those that occurred closer to the solar limb due to the opacity of Ly, or possible foreshortening of the flare ribbons. A C-class flare that exhibited an abnormally high contrast of 7% (equating to 1030 erg) was also presented.
While GOES/EUVS was designed as an EUV irradiance monitor, the results presented here show just how stable the data are and how they can be utilized for detailed scientific analysis, in particular for large scale statistical studies. And although the sensitivity of GOES-15/EUVS-E might be limited to larger flares, the new Ly irradiance instruments that are part of the EXIS (Eparvier et al., 2009; Chamberlin et al., 2009) suite on the newly launched GOES-R series of spacecraft (GOES-16 and GOES-17 were launched in February 2017 and June 2018, respectively, with GOES-18 and GOES-19 to follow) will have a greater dynamic range, as well as providing pseudo line profiles by sampling the Ly profile in five wavelength pixels rather than as broadband measurements. Similarly, the imaging capability of the EUV Imager (EUI; Schühle et al. 2011; Rochus et al. 2020) on-board Solar Orbiter will be able to spatially resolve flares in Ly for the first time. The findings presented illustrate that even minor flares can produce small, but perceptible changes in the solar Ly irradiance, and should therefore serve as a baseline for the advent of new Ly flare observations and advanced numerical simulations that will become available during Solar Cycle 25.
Acknowledgments
The author would like to thank Science and Technologies Facilities Council (UK) for the award of an Ernest Rutherford Fellowship (ST/N004981/1), and Hugh Hudson, Mihalis Mathioudakis, Graham Kerr, and Shaun McLaughlin for feedback on an early draft. The GOES data used in this study are freely and publicly available from the instrument websites (GOES/EUVS: https://satdat.ngdc.noaa.gov/sem/goes/data/euvs/GOES˙v4/G15/; GOES/XRS: https://www.ngdc.noaa.gov/stp/satellite/goes/dataaccess.html).
References
- Baliukin et al. (2019) Baliukin, I.I., Bertaux, J.-L., Quémerais, E., Izmodenov, V.V., Schmidt, W.: 2019, SWAN/SOHO Lyman- Mapping: The Hydrogen Geocorona Extends Well Beyond the Moon. Journal of Geophysical Research (Space Physics) 124(2), 861. DOI. ADS.
- Brekke and Kjeldseth-Moe (1994) Brekke, P., Kjeldseth-Moe, O.: 1994, The solar UV continuum 1440-1680 Å and its center-to-limb variation. Sol. Phys. 150, 19. DOI. ADS.
- Brekke et al. (1996) Brekke, P., Rottman, G.J., Fontenla, J., Judge, P.G.: 1996, The Ultraviolet Spectrum of a 3B Class Flare Observed with SOLSTICE. ApJ 468, 418. DOI. ADS.
- Canfield and van Hoosier (1980) Canfield, R.C., van Hoosier, M.E.: 1980, Observed L-alpha profiles for two solar flares - 14:12 UT 15 June, 1973 and 23:16 UT 21 January, 1974. Sol. Phys. 67, 339. DOI. ADS.
- Chamberlin et al. (2009) Chamberlin, P.C., Woods, T.N., Eparvier, F.G., Jones, A.R.: 2009, Next generation x-ray sensor (XRS) for the NOAA GOES-R satellite series, Society of Photo-Optical Instrumentation Engineers (SPIE) Conference Series 7438, 743802. DOI. ADS.
- Chubb et al. (1957) Chubb, T.A., Friedman, H., Kreplin, R.W., Kupperian, J. J. E.: 1957, Lyman Alpha and X-Ray Emissions during a Small Solar Flare. J. Geophys. Res. 62(3), 389. DOI. ADS.
- Dominique et al. (2018) Dominique, M., Zhukov, A.N., Heinzel, P., Dammasch, I.E., Wauters, L., Dolla, L., Shestov, S., Kretzschmar, M., Machol, J., Lapenta, G., Schmutz, W.: 2018, First Detection of Solar Flare Emission in Mid-ultraviolet Balmer Continuum. ApJ 867(2), L24. DOI. ADS.
- Eparvier et al. (2009) Eparvier, F.G., Crotser, D., Jones, A.R., McClintock, W.E., Snow, M., Woods, T.N.: 2009, The Extreme Ultraviolet Sensor (EUVS) for GOES-R, Society of Photo-Optical Instrumentation Engineers (SPIE) Conference Series 7438, 743804. DOI. ADS.
- Eparvier et al. (2015) Eparvier, F.G., Chamberlin, P.C., Woods, T.N., Thiemann, E.M.B.: 2015, The Solar Extreme Ultraviolet Monitor for MAVEN. Space Sci. Rev. 195(1-4), 293. DOI. ADS.
- Handy et al. (1999) Handy, B.N., Acton, L.W., Kankelborg, C.C., Wolfson, C.J., Akin, D.J., Bruner, M.E., Caravalho, R., Catura, R.C., Chevalier, R., Duncan, D.W., Edwards, C.G., Feinstein, C.N., Freeland , S.L., Friedlaender, F.M., Hoffmann, C.H., Hurlburt, N.E., Jurcevich, B.K., Katz, N.L., Kelly, G.A., Lemen, J.R., Levay, M., Lindgren, R.W., Mathur, D.P., Meyer, S.B., Morrison, S.J., Morrison, M.D., Nightingale, R.W., Pope, T.P., Rehse, R.A., Schrijver, C.J., Shine, R.A., Shing, L., Strong, K.T., Tarbell, T.D., Title, A.M., Torgerson, D.D., Golub, L., Bookbinder, J.A., Caldwell, D., Cheimets, P.N., Davis, W.N., Deluca, E.E., McMullen, R.A., Warren, H.P., Amato, D., Fisher, R., Maldonado, H., Parkinson, C.: 1999, The transition region and coronal explorer. Sol. Phys. 187(2), 229. DOI. ADS.
- Hanser and Sellers (1996) Hanser, F.A., Sellers, F.B.: 1996, Design and calibration of the GOES-8 solar x-ray sensor: the XRS. In: Washwell, E.R. (ed.) GOES-8 and Beyond, Proc. SPIE 2812, 344. DOI. ADS.
- Kretzschmar (2011) Kretzschmar, M.: 2011, The Sun as a star: observations of white-light flares. A&A 530, A84. DOI. ADS.
- Kretzschmar (2015) Kretzschmar, M.: 2015, Temperature Dependence of the Flare Fluence Scaling Exponent. Sol. Phys. 290(12), 3593. DOI. ADS.
- Kretzschmar, Dominique, and Dammasch (2013) Kretzschmar, M., Dominique, M., Dammasch, I.E.: 2013, Sun-as-a-Star Observation of Flares in Lyman by the PROBA2/LYRA Radiometer. Sol. Phys. 286, 221. DOI. ADS.
- Kretzschmar et al. (2010) Kretzschmar, M., de Wit, T.D., Schmutz, W., Mekaoui, S., Hochedez, J.-F., Dewitte, S.: 2010, The effect of flares on total solar irradiance. Nature Physics 6(9), 690. DOI. ADS.
- Lean (1985) Lean, J.L.: 1985, Calculations of Lyman Alpha absorption in the mesosphere. In: Zerefos, C.S., Ghazi, A. (eds.) Atmospheric ozone; Proceedings of the Quadrennial, 697. ADS.
- Lemen et al. (2012) Lemen, J.R., Title, A.M., Akin, D.J., Boerner, P.F., Chou, C., Drake, J.F., Duncan, D.W., Edwards, C.G., Friedlaender, F.M., Heyman, G.F., Hurlburt, N.E., Katz, N.L., Kushner, G.D., Levay, M., Lindgren, R.W., Mathur, D.P., McFeaters, E.L., Mitchell, S., Rehse, R.A., Schrijver, C.J., Springer, L.A., Stern, R.A., Tarbell, T.D., Wuelser, J.-P., Wolfson, C.J., Yanari, C., Bookbinder, J.A., Cheimets, P.N., Caldwell, D., Deluca, E.E., Gates, R., Golub, L., Park, S., Podgorski, W.A., Bush, R.I., Scherrer, P.H., Gummin, M.A., Smith, P., Auker, G., Jerram, P., Pool, P., Soufli, R., Windt, D.L., Beardsley, S., Clapp, M., Lang, J., Waltham, N.: 2012, The Atmospheric Imaging Assembly (AIA) on the Solar Dynamics Observatory (SDO). Sol. Phys. 275(1-2), 17. DOI. ADS.
- Lin et al. (2002) Lin, R.P., Dennis, B.R., Hurford, G.J., Smith, D.M., Zehnder, A., Harvey, P.R., Curtis, D.W., Pankow, D., Turin, P., Bester, M., Csillaghy, A., Lewis, M., Madden, N., van Beek, H.F., Appleby, M., Raudorf, T., McTiernan, J., Ramaty, R., Schmahl, E., Schwartz, R., Krucker, S., Abiad, R., Quinn, T., Berg, P., Hashii, M., Sterling, R., Jackson, R., Pratt, R., Campbell, R.D., Malone, D., Landis, D., Barrington-Leigh, C.P., Slassi-Sennou, S., Cork, C., Clark, D., Amato, D., Orwig, L., Boyle, R., Banks, I.S., Shirey, K., Tolbert, A.K., Zarro, D., Snow, F., Thomsen, K., Henneck, R., McHedlishvili, A., Ming, P., Fivian, M., Jordan, J., Wanner, R., Crubb, J., Preble, J., Matranga, M., Benz, A., Hudson, H., Canfield, R.C., Holman, G.D., Crannell, C., Kosugi, T., Emslie, A.G., Vilmer, N., Brown, J.C., Johns-Krull, C., Aschwanden, M., Metcalf, T., Conway, A.: 2002, The Reuven Ramaty High-Energy Solar Spectroscopic Imager (RHESSI). Sol. Phys. 210(1), 3. DOI. ADS.
- McClintock, Rottman, and Woods (2005) McClintock, W.E., Rottman, G.J., Woods, T.N.: 2005, Solar-Stellar Irradiance Comparison Experiment II (Solstice II): Instrument Concept and Design. Sol. Phys. 230, 225. DOI. ADS.
- Meegan et al. (2009) Meegan, C., Lichti, G., Bhat, P.N., Bissaldi, E., Briggs, M.S., Connaughton, V., Diehl, R., Fishman, G., Greiner, J., Hoover, A.S., van der Horst, A.e.J., von Kienlin, A., Kippen, R.M., Kouveliotou, C., McBreen, S., Paciesas, W.S., Preece, R., Steinle, H., Wallace, M.S., Wilson, R.B., Wilson-Hodge, C.: 2009, The Fermi Gamma-ray Burst Monitor. ApJ 702(1), 791. DOI. ADS.
- Meier and Prinz (1970) Meier, R.R., Prinz, D.K.: 1970, Absorption of the solar Lyman alpha line by geocoronal atomic hydrogen. J. Geophys. Res. 75(34), 6969. DOI. ADS.
- Milligan and Chamberlin (2016) Milligan, R.O., Chamberlin, P.C.: 2016, Anomalous temporal behaviour of broadband Ly observations during solar flares from SDO/EVE. A&A 587, A123. DOI. ADS.
- Milligan and Ireland (2018) Milligan, R.O., Ireland, J.: 2018, On the Performance of Multi-Instrument Solar Flare Observations During Solar Cycle 24. Sol. Phys. 293(2), 18. DOI. ADS.
- Milligan et al. (2014) Milligan, R.O., Kerr, G.S., Dennis, B.R., Hudson, H.S., Fletcher, L., Allred, J.C., Chamberlin, P.C., Ireland, J., Mathioudakis, M., Keenan, F.P.: 2014, The Radiated Energy Budget of Chromospheric Plasma in a Major Solar Flare Deduced from Multi-wavelength Observations. ApJ 793, 70. DOI. ADS.
- Milligan et al. (2017) Milligan, R.O., Fleck, B., Ireland, J., Fletcher, L., Dennis, B.R.: 2017, Detection of Three-minute Oscillations in Full-disk Ly Emission during a Solar Flare. ApJ 848(1), L8. DOI. ADS.
- Milligan et al. (2020) Milligan, R.O., Hudson, H.S., Chamberlin, P.C., Hannah, I.G., Hayes, L.A.: 2020, Lyman-alpha Variability During Solar Flares Over Solar Cycle 24 Using GOES-15/EUVS-E. Space Weather 18(7), e02331. DOI. ADS.
- Neupert (1968) Neupert, W.M.: 1968, Comparison of Solar X-Ray Line Emission with Microwave Emission during Flares. ApJ 153, L59. DOI. ADS.
- Pesnell, Thompson, and Chamberlin (2012) Pesnell, W.D., Thompson, B.J., Chamberlin, P.C.: 2012, The Solar Dynamics Observatory (SDO). Sol. Phys. 275(1-2), 3. DOI. ADS.
- Raulin et al. (2013) Raulin, J.-P., Trottet, G., Kretzschmar, M., Macotela, E.L., Pacini, A.r., Bertoni, F.C.P., Dammasch, I.E.: 2013, Response of the low ionosphere to X-ray and Lyman- solar flare emissions. Journal of Geophysical Research (Space Physics) 118(1), 570. DOI. ADS.
- Rochus et al. (2020) Rochus, P., Auchère, F., Berghmans, D., Harra, L., Schmutz, W., Schühle, U., Addison, P., Appourchaux, T., Aznar Cuadrado, R., Baker, D., Barbay, J., Bates, D., BenMoussa, A., Bergmann, M., Beurthe, C., Borgo, B., Bonte, K., Bouzit, M., Bradley, L., Büchel, V., Buchlin, E., Büchner, J., Cabé, F., Cadiergues, L., Chaigneau, M., Chares, B., Choque Cortez, C., Coker, P., Condamin, M., Coumar, S., Curdt, W., Cutler, J., Davies, D., Davison, G., Defise, J.-M., Del Zanna, G., Delmotte, F., Delouille, V., Dolla, L., Dumesnil, C., Dürig, F., Enge, R., François, S., Fourmond, J.-J., Gillis, J.-M., Giordanengo, B., Gissot, S., Green, L.M., Guerreiro, N., Guilbaud, A., Gyo, M., Haberreiter, M., Hafiz, A., Hailey, M., Halain, J.-P., Hansotte, J., Hecquet, C., Heerlein, K., Hellin, M.-L., Hemsley, S., Hermans, A., Hervier, V., Hochedez, J.-F., Houbrechts, Y., Ihsan, K., Jacques, L., Jérôme, A., Jones, J., Kahle, M., Kennedy, T., Klaproth, M., Kolleck, M., Koller, S., Kotsialos, E., Kraaikamp, E., Langer, P., Lawrenson, A., Le Clech’, J.-C., Lenaerts, C., Liebecq, S., Linder, D., Long, D.M., Mampaey, B., Markiewicz-Innes, D., Marquet, B., Marsch, E., Matthews, S., Mazy, E., Mazzoli, A., Meining, S., Meltchakov, E., Mercier, R., Meyer, S., Monecke, M., Monfort, F., Morinaud, G., Moron, F., Mountney, L., Müller, R., Nicula, B., Parenti, S., Peter, H., Pfiffner, D., Philippon, A., Phillips, I., Plesseria, J.-Y., Pylyser, E., Rabecki, F., Ravet-Krill, M.-F., Rebellato, J., Renotte, E., Rodriguez, L., Roose, S., Rosin, J., Rossi, L., Roth, P., Rouesnel, F., Roulliay, M., Rousseau, A., Ruane, K., Scanlan, J., Schlatter, P., Seaton, D.B., Silliman, K., Smit, S., Smith, P.J., Solanki, S.K., Spescha, M., Spencer, A., Stegen, K., Stockman, Y., Szwec, N., Tamiatto, C., Tandy, J., Teriaca, L., Theobald, C., Tychon, I., van Driel-Gesztelyi, L., Verbeeck, C., Vial, J.-C., Werner, S., West, M.J., Westwood, D., Wiegelmann, T., Willis, G., Winter, B., Zerr, A., Zhang, X., Zhukov, A.N.: 2020, The Solar Orbiter EUI instrument: The Extreme Ultraviolet Imager. A&A 642, A8. DOI. ADS.
- Rubio da Costa et al. (2009) Rubio da Costa, F., Fletcher, L., Labrosse, N., Zuccarello, F.: 2009, Observations of a solar flare and filament eruption in Lyman and X-rays. A&A 507(2), 1005. DOI. ADS.
- Schühle et al. (2011) Schühle, U., Halain, J.-P., Meining, S., Teriaca, L.: 2011, The Lyman-alpha telescope of the extreme ultraviolet imager on Solar Orbiter. In: Fineschi, S., Fennelly, J. (eds.) Solar Physics and Space Weather Instrumentation IV, Society of Photo-Optical Instrumentation Engineers (SPIE) Conference Series 8148, 81480K. DOI. ADS.
- Viereck et al. (2007) Viereck, R., Hanser, F., Wise, J., Guha, S., Jones, A., McMullin, D., Plunket, S., Strickland, D., Evans, S.: 2007, Solar extreme ultraviolet irradiance observations from GOES: design characteristics and initial performance. In: Fineschi, S., Viereck, R.A. (eds.) Solar Physics and Space Weather Instrumentation II, Society of Photo-Optical Instrumentation Engineers (SPIE) Conference Series 6689, 66890K. DOI. ADS.
- Woods, Kopp, and Chamberlin (2006) Woods, T.N., Kopp, G., Chamberlin, P.C.: 2006, Contributions of the solar ultraviolet irradiance to the total solar irradiance during large flares. Journal of Geophysical Research (Space Physics) 111, A10S14. DOI. ADS.
- Woods et al. (1995) Woods, T.N., Rottman, G.J., White, O.R., Fontenla, J., Avrett, E.H.: 1995, The Solar LY alpha Line Profile. ApJ 442, 898. DOI. ADS.
- Woods et al. (2000) Woods, T.N., Tobiska, W.K., Rottman, G.J., Worden, J.R.: 2000, Improved solar Lyman irradiance modeling from 1947 through 1999 based on UARS observations. J. Geophys. Res. 105, 27195. DOI. ADS.
- Woods et al. (2004) Woods, T.N., Eparvier, F.G., Fontenla, J., Harder, J., Kopp, G., McClintock, W.E., Rottman, G., Smiley, B., Snow, M.: 2004, Solar irradiance variability during the October 2003 solar storm period. Geophys. Res. Lett. 31, L10802. DOI. ADS.
- Woods et al. (2009) Woods, T.N., Chamberlin, P.C., Harder, J.W., Hock, R.A., Snow, M., Eparvier, F.G., Fontenla, J., McClintock, W.E., Richard, E.C.: 2009, Solar Irradiance Reference Spectra (SIRS) for the 2008 Whole Heliosphere Interval (WHI). Geophys. Res. Lett. 36(1), L01101. DOI. ADS.
- Woods et al. (2012) Woods, T.N., Eparvier, F.G., Hock, R., Jones, A.R., Woodraska, D., Judge, D., Didkovsky, L., Lean, J., Mariska, J., Warren, H., McMullin, D., Chamberlin, P., Berthiaume, G., Bailey, S., Fuller-Rowell, T., Sojka, J., Tobiska, W.K., Viereck, R.: 2012, Extreme Ultraviolet Variability Experiment (EVE) on the Solar Dynamics Observatory (SDO): Overview of Science Objectives, Instrument Design, Data Products, and Model Developments. Sol. Phys. 275(1-2), 115. DOI. ADS.