Towards Imperceptible Query-limited Adversarial Attacks with Perceptual Feature Fidelity Loss
Abstract
Recently, there has been a large amount of work towards fooling deep-learning-based classifiers, particularly for images, via adversarial inputs that are visually similar to the benign examples. However, researchers usually use -norm minimization as a proxy for imperceptibility, which oversimplifies the diversity and richness of real-world images and human visual perception. In this work, we propose a novel perceptual metric utilizing the well-established connection between the low-level image feature fidelity and human visual sensitivity, where we call it Perceptual Feature Fidelity Loss. We show that our metric can robustly reflect and describe the imperceptibility of the generated adversarial images validated in various conditions. Moreover, we demonstrate that this metric is highly flexible, which can be conveniently integrated into different existing optimization frameworks to guide the noise distribution for better imperceptibility. The metric is particularly useful in the challenging black-box attack with limited queries, where the imperceptibility is hard to achieve due to the non-trivial perturbation power.
1 Introduction
1.1 Vulnerability of deep learning model
In many areas, it has been widely observed that deep neural networks are susceptible to adversarial image perturbations [45, 17, 1]. For instance, with visually imperceptible perturbation added to the input images, deep-learning-based image classifiers could be compromised [6, 28, 8, 3]. Generating adversarial inputs with inconspicuous perturbation is of vital importance to study the model robustness, adversarial defense, and machine perception mechanism. A commonly agreed-upon assumption is that a small -distance is a good proxy of the imperceptibility in the image domain, and thus many works seek to generate adversarial examples with bounded distance [10, 8, 9, 7]. However, recent works [43, 44, 50] reveal that visually imperceptible perturbations do not necessarily require small -distance, which motivates us to deeply explore the intrinsic connection of perturbation between statistical distribution and imperceptibility.
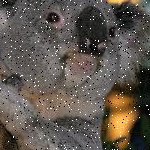
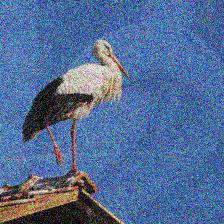
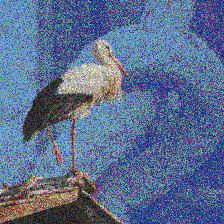
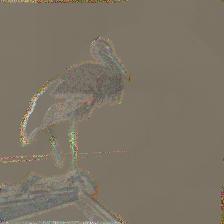
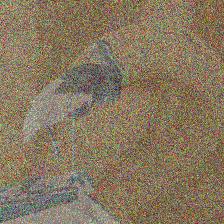
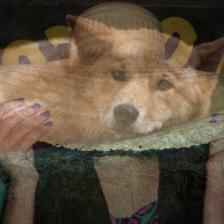
First and foremost, our work starts from questioning the validity of treating every image pixel with equal importance in the -based methods [9, 7]. A widely recognized and accepted conclusion in Image Quality Assessment (IQA) is that human visual perception, as a highly complex and subjective system, does not have a uniform and consistent sensitivity in every pixel, which is very likely to be influenced by the local image statistics, such as intensity contrast, local structure consistency, and self-similarity. In the field of image processing, very often people associate human visual sensitivity with low-level image feature fidelity [40], [30], e.g., most people are more sensitive to the distortion on smooth regions rather than the fast-changing textures. Using this empirical fact, we manage to guide the spatial distribution of the adversarial perturbations by minimizing the Perceptual Feature Fidelity Loss (PFFL), to make it consistent with the benign image statistics. This effectively allows us to “entangle” large adversarial perturbation in image spatial space with fewer query resources, through a manner hidden from the human visual attention, as shown in fig. 1. This is of particular use in query-limited adversarial attacks, where the noise level is relatively large due to insufficient iterations, thence making the noise consistent with low-level image statistics is a sensible way to achieve imperceptibility.
1.2 Imperceptibility of perturbation on images
SSIM=1
 original image
SSIM=0.43
 PSNR=19.46
SSIM=0.94
 PSNR=19.46
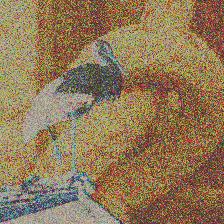
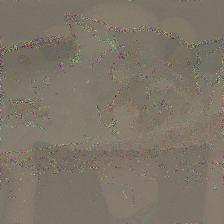
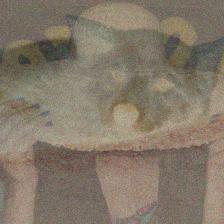
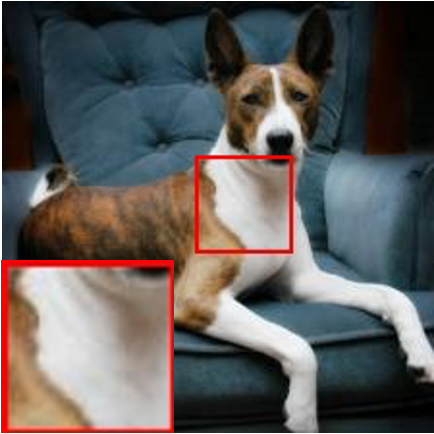
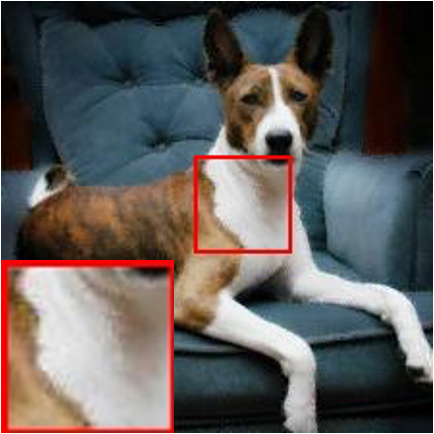
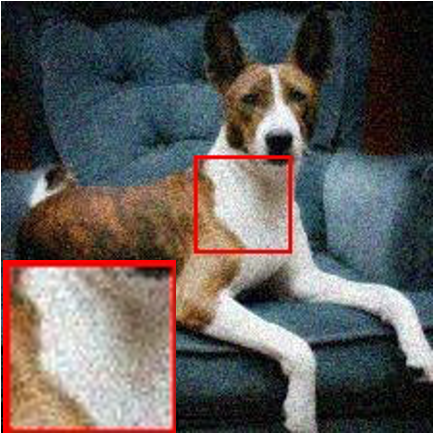
Perturbing the initial image “unconsciously” is quite valuable in many deep-learning related applications. The adversarial image attack is expected to be blocked and prevented by human inspectors or statistical tests [34, 18] if the perturbation is visually noticeable. Fig. 2 motivates the use of Perceptual Feature Fidelity Loss for guiding the spatial distribution of the adversarial image perturbations. To be more specific, the same amount of noise (Peak Signal-to-Noise Ratio: ) has been put on the same original image (left), which interestingly gives rise to two distinct perturbed images: the noise in the middle example is randomly and uniformly distributed in image space; while the noise in the right example is carefully designed with close correlation to the initial image statistics, i.e. low-level feature fidelity. Obviously, the resultant perturbations are only noticeable in the randomly-distributed example (middle) with significant grain effects, despite the fact that noise levels of both images remain identical. The reason behind this is that image feature fidelity perceived by the human eye does not change uniformly over distance in image space. In other words, relatively small perturbations in image space may result in large distortion in image features. Conversely, relatively large image space changes may still be imperceptible as long as the added perturbation causes small distortion of the initial image features.
On the other hand, fig. 2 also reveals that it may not be reliable to evaluate the generated image quality only depending on a single indicator. In image and video processing tasks, people often compare the PSNR and SSIM metrics simultaneously to make a comprehensive evaluation of image quality [14, 4, 46]. Given the difficulty of precisely balancing these two metrics in practical applications, this inspires us to propose a new metric to cover both PSNR and SSIM as much as possible to guide the imperceptible adversarial attacks effectively.
1.3 Contribution
Although several meaningful attempts try to achieve imperceptible attack via exploiting image structural information [32, 10, 54], they essentially do not investigate the key ingredients of image structures that directly influence the final visual quality. As a result, this gives rise to a relatively rough manner of structure information utilization. Besides, producing imperceptible adversarial perturbation in black-box and hard-label setting (only access the top-1 category) is usually achieved via intensive queries, while improving noise distribution to reduce visibility in this challenging problem has not been explored before. In this paper, we propose a new metric, Perceptual Feature Fidelity Loss (PFFL) to improve the visual imperceptibility of generated adversarial example. The metric is based on the distortion of low-level image features and is flexibly applicable to various image contexts. We summarize our contribution as follows:
-
•
An in-depth study on creating adaptive and flexible adversarial attacks that achieve better perceptual quality with limited query budget (Fig. 1).
-
•
Our experiments demonstrate that the proposed metric can effectively guide the noise spatial distribution so as to make it consistent with the initial image statistics, which has not been explored in the query-limited hard-label black-box attacks before.
-
•
Novel feature distortion metric: the proposed metric takes both the overall noise power and the local feature distortion into consideration, quantitatively ensuring the comprehensive and reliable image quality evaluation.
2 Background
Image quality assessment (IQA). IQA aims at characterizing visual difference between two images captured by humans as closely as possible. Over decades, people have actively studied this problem with many meaningful attempts, such as PSNR, SSIM, BRISQUE [27, 22, 33, 35, 48]. However, designing a comprehensive and reliable evaluation indicator applicable to most image/video processing tasks remains intractable [47, 53]. As a compromise, in practice, researchers and practitioners usually compare two most-often used indicators simultaneously, i.e., PSNR and SSIM, to obtain a case-specific evaluation result empirically. The reason is that PSNR describes the overall noise power yet ignoring the local noise behavior; conversely, the SSIM indicator is of complex expression characterizing the local consistency of noise distribution yet neglecting the overall noise power. Hence, it is expected that combing them together can give a more comprehensive and accurate evaluation.
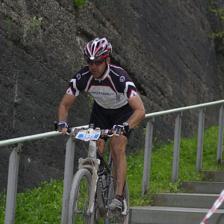
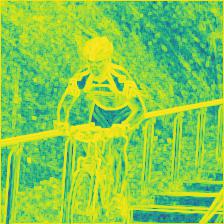
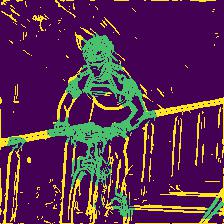
Perception-based adversarial attack. With the growing awareness that the commonly-used distance oversimplifies human perception [43, 44], researchers have attempted to address the imperceptibility of adversarial attacks using different approaches. One direction is preserving semantical similarity [23, 15, 56, 39]. However, since assessing the image fidelity and semantic similarity is still an unsolved problem [47, 53], the above direction is not the focus of this work. Besides, other methods are trying to make improvement upon -distance based on the conventional IQA metrics, such as a combination of and [10], local smoothness [54], space saturation [57] and local variance [32]. However, these methods still lack in-depth investigation of the predominant factors affecting image visual quality. This gives rise to the rough image feature maps. For instance, as shown in fig. 3: compared to our refined feature response (right), the common response map used in [32] is much more susceptible to image outlier, blurring, and background interference. Besides, nearly all of the above works target at white-box adversarial attacks, where imperceptible perturbation can have already been produced given the access to victim models. In this work, we study a more challenging attack setting, the hard-label black-box attack, where the query budget could become the restriction from reducing noise power. Given the relatively large perturbation, leveraging the low-level image feature consistency is desirable to achieve imperceptibility.
Perception on low-level image feature. The human visual perception is a quite sophisticated system related to many aspects, e.g., image resolution, object types, image contrast, user preference, etc. [51, 20, 25]. An empirical consensus in practice is that the image visual quality is closely related to the low-level image feature distortion [2, 41, 38, 11], despite the fact that the explicit expression is intractable. Generally speaking, given an image, people tend to be more sensitive to the low-variation features instead of textures and edges [13, 52, 29, 19]. Following the convention in image/video processing, people usually divide the low-level image features into three categories: smooth regions, edges, and textures. This motivates the key idea of quantitatively describing the feature distortion of the perturbed image in our work: assign different penalty to each feature categories based on their visual response sensitivity.
3 Perceptual Feature Fidelity Loss
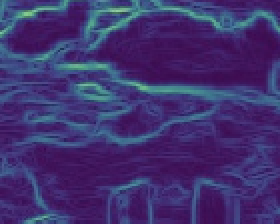
As mentioned above, although the precise quantization of human visual evaluation is difficult to obtain, we can still find out the close connection between human visual perception and image feature distortion. To describe the feature distortion caused by adversarial perturbations, we introduce the FA (Fourier-Agrand) filter, which is the optimal steerable filter, to distinguish smooth regions and fast-variation features based on the local directionality response (workable even under PSNR). We further discriminate between the edges and textures empirically through the feature spatial sparsity [49, 31]. (as shown in fig. 5). Finally, we propose a weighted feature loss based on the feature-sensitivity relationship with the obtained feature map, which leads to efficient and adaptive adversarial attack algorithms.

reef
FA response

smooth area

edge

texture
3.1 Refined feature classification
To characterize the feature distortion of the perturbed image, the first and foremost step is to classify the low-level image features pixel by pixel robustly. This is a challenging job in image segmentation because of the diversity of real images. Over decades, people have proposed a series of detectors or classifiers to implement image segmentation, such as Canny edge detector [5], deep-learning-based segmentation networks [40], steerable filter [16], etc.. However, these methods cannot take both the computational efficiency and accuracy into account, resulting in rough and unsatisfactory results. Specifically, low-level features characterize the image local directionality, e.g., edges are usually unidirectional, yet textures are usually multidirectional. This requires that the classifier used should be able to capture all possible directional changes, i.e., angles in . However, it is very difficult to balance the accuracy and complexity: either we achieve finer angle discretization with expensive computational cost, or we keep low complexity by rougher angle discretization–as is done by the Canny edge detector.
(a) original

(b) texture

(c) edge

FA Filter. To handle the trade-off between computation and accuracy, people further propose steerable filters [16, 55], whose space of all rotated versions is finite as long as the steerability assumption is satisfied. Using a linear combination of basis filters [16], they can effectively obtain an approximated version of the original filter, which is rotation invariant. Recently, people develop Fourier-Argand (FA) filter [55] and prove its optimality and efficiency in terms of the approximation error of steerable patterns. To be more specific, the key idea of the FA filter is to find the optimal basis consisting of functions for approximating all rotated versions of the given pattern (edge/texture) that is able to sensitively capture the image spatial variation along a certain direction. Specifically, let denote the matching pattern characterized by the direction (), and be an arbitrary basis of elements. Let denote the orthogonal projection onto the approximation space . Zhao et al. [55] find the optimal basis for all rotated versions of by minimizing the average approximation error over all possible angles:
| (1) |
This minimization automatically leads to the optimal and rotation-invariant Fourier-Argand basis . The optimality and the rotation invariance ensure that all spatial directions can be accurately characterized with minimal angle quantization error. The properties provide an efficient tool to accurately identify the fast-variation and directional image features with small computational cost, and hence is the key of the proposed image distortion metric. We refer to this paper [55] for more details if readers have interests.
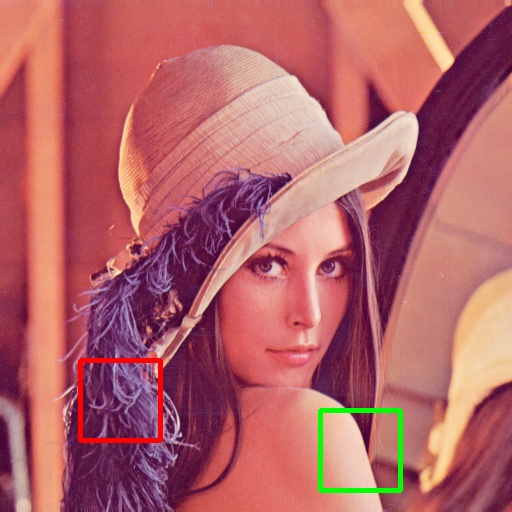
Low-level Feature Classification. The next question is to further discriminate the edge and texture features, given the FA directionality response. The key idea is based on the following observation: intuitively, the spatial sparsity of the texture features in the FA response is much higher than the edge features as shown in fig. 5. This provides a valid criterion to effectively discriminate the edge and texture features which has been used for decades [31, 49, 36, 37]. We need to point out that this texture discrimination is tentative and empirical from image processing tasks. So far, similar to human visual evaluation, there is still no clear definition to discriminate edge and texture [26], and we are actively working towards better criterion. Fig. 4 gives an intuitive example of low-level image feature classification.
To be more specific, let , , denote three distortion penalty of smooth region, edge, and texture respectively. Let denote the indicator function. We first define the sparsity of FA directional response within a local patch centered at pixel :
| (2) |
| (3) |
therefore, reflects the directional response density within the local patch . With the response density , the low-level image features can be tentatively discriminated: for pixel with FA response smaller than the high-variation threshold , it will be classified as the smooth area category; for the others, the pixel will either be classified as texture if its FA directional response density is larger than , or edge category if its response density is smaller than . Mathematically, the feature category label is given by:
| (4) | |||
where indicates the sensitivity penalty of pixel depending on its feature category. Fig. 6 gives an intuitive depiction of the flowchart of the FA classifier.
3.2 Optimization Formulation & Algorithmic Framework
Perceptual Feature Fidelity Loss. Consider the input image where is the size of the image. The hard-label classifier gives its predicted label , where . Given the original image , its ground-truth label , a target class , we generate the adversarial image using Perceptual Feature Fidelity Loss (PFFL):
| (5a) | |||||
| subject to | (5b) | ||||
where
| (6) |
The notation denotes the Hadamard product operator. PFFL strives to quantitatively describe the low-level image feature distortion with the weighted sensitivity penalty .
Proposed Algorithm. Algorithm 1 gives the implementation details to illustrate the attack process. Note that the function is proposed in [9, 8], where the hard-label black-box attack is formulated as a real-valued optimization problem . Except for the SignOPT realization, we also leverage HSJA [7] and Boundary Attack [3] to demonstrate the efficiency and flexibility of PFFL (for more detailed implementation and experiments, we refer our reader to the appendix).
SSIM /PSNR SignOPT HSJA Queries PFFL PFFL 4.8k 0.60 /23.15 0.46 /22.36 0.38 /18.63 0.50 /19.95 0.30 /20.11 0.18 /17.44 7.2k 0.71 /25.75 0.54 /25.03 0.41 /19.38 0.63 /21.70 0.38 /22.60 0.23 /19.27 9.6k 0.77 /27.67 0.61 /27.24 0.44 /19.89 0.74 /23.73 0.47 /25.08 0.29 /20.37 12k 0.83 /29.55 0.66 /29.31 0.47 /20.47 0.80 /25.07 0.55 /26.99 0.34 /21.34
SSIM /PSNR DenseNet MobileNet Queries PFFL PFFL 4.8k 0.60 /22.83 0.44 /22.62 0.35 /18.24 0.60 /22.42 0.49 /22.95 0.39 /19.25 7.2k 0.70 /25.66 0.53 /25.93 0.40 /18.73 0.69 /25.10 0.60 /26.06 0.43 /20.63 9.6k 0.77 /27.79 0.61 /28.55 0.43 /19.53 0.77 /27.44 0.67 /28.62 0.45 /21.08 12k 0.82 /29.50 0.68 /30.00 0.45 /20.06 0.81 /29.30 0.71 /30.64 0.47 /21.81
The main difference from [9] is that the objective function is replaced with . Furthermore, we also conduct untargeted hard-label black-box attack, where the starting image is initialized with:
| (7) |
where random noise is generated from Gaussian or uniform distribution. The other procedures remain the same.


original image

PFFL

PFFL (noise)
(noise)
(noise)
4 Experimental results
original
PFFL+HSJA
+HSJA
original
PFFL+SignOPT
+SignOPT
Experiment setup. We first randomly select 100 correctly classified image pairs from ImageNet test dataset[12]. Then we use SignOPT [9] and HopSkipJumpAttack (HSJA)[7] frameworks to optimize the PFFL objective. Experiments are conducted on three different network architectures: ResNet-50[21], DenseNet[24], and MobileNet_v2[42]. We mainly focus on the hard-label black-box attack setting, where the initial images are correctly classified in the targeted class. Besides, , , and in Eqn. (4) are set to 1, 0.3, and 0.5 respectively. is 1/10 of the width of input images and equals to 0.4. In the experiments, each input image is normalized following the conventions used in PyTorch***https://pytorch.org/docs/stable/torchvision/models.html. PFFL is calculated as described in (6). To evaluate the quality of generated images, we mainly use SSIM[47] and PSNR(9) as our referring metrics. We report the median value of PSNR and SSIM across all examples within a specific query in the following experiments.
| (8) |
| (9) |
where is the maximum possible pixel value of the image.
4.1 Comparison on different attacks
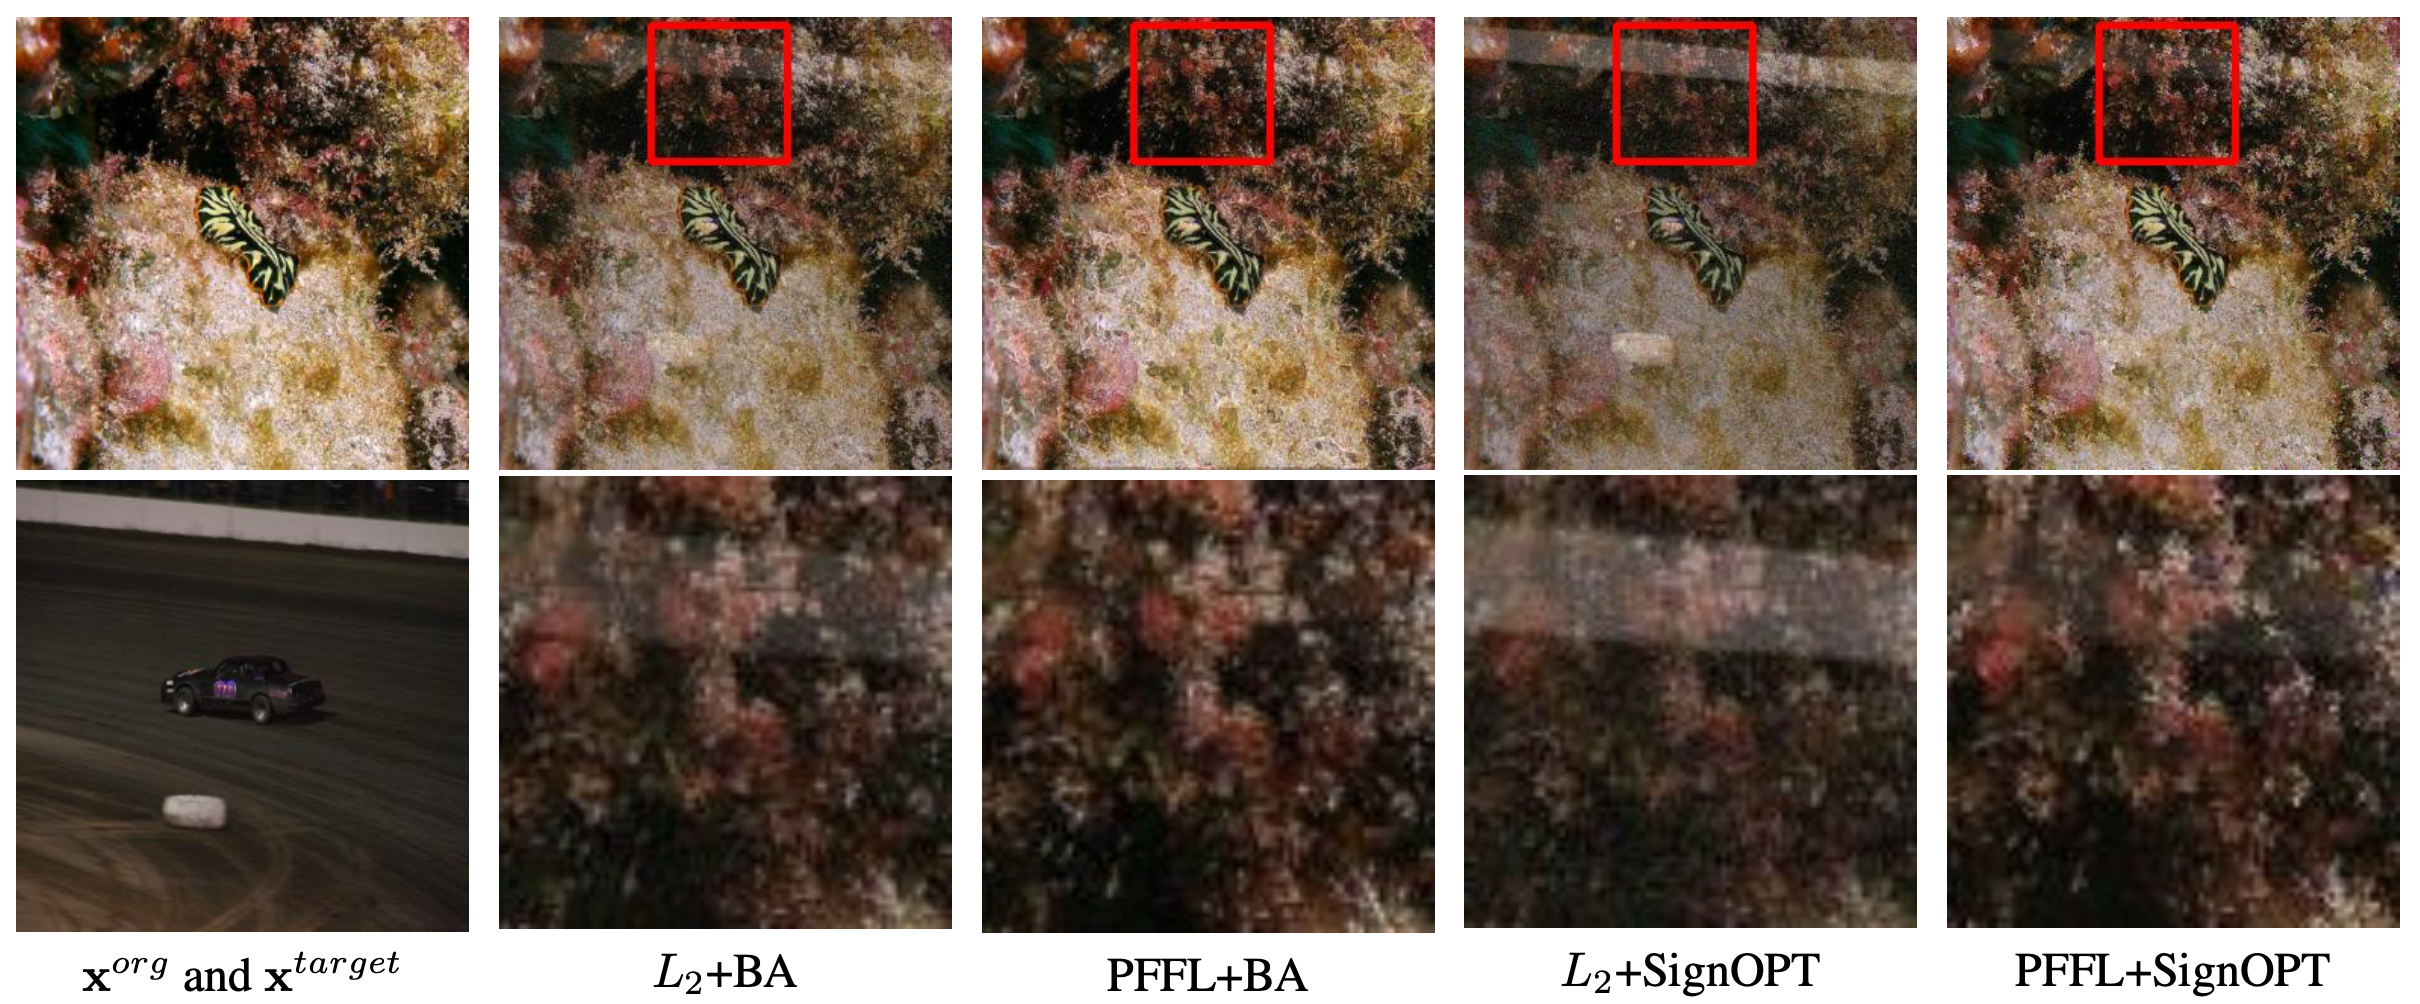
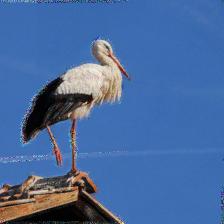
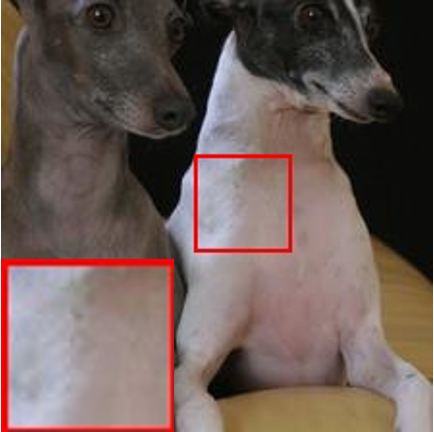
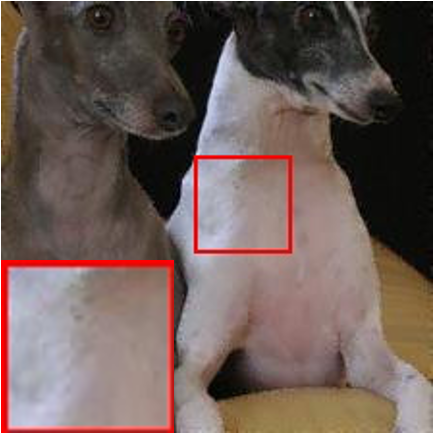
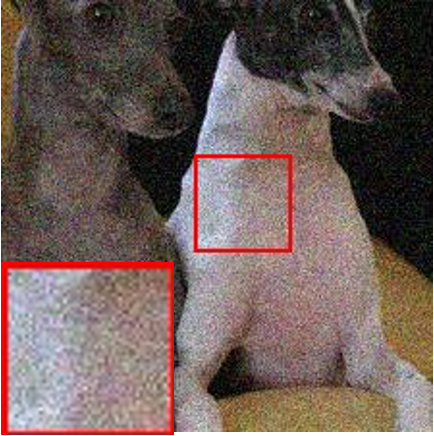
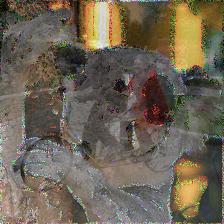
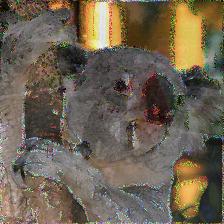
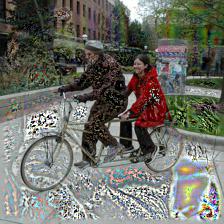
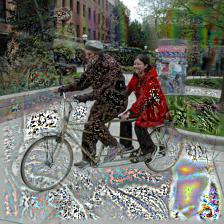
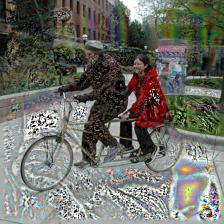
In these experiments, we conduct attacks using different objectives (PFFL, , and ) and attack frameworks (SignOPT and HSJA). We calculate their corresponding SSIM and PSNR value as indicators of visual quality at different queries. From table 1, we can observe a significant improvement in SSIM (generally 0.1+ SSIM increase already means significant visual quality improvement [46, 47]) and a comparable PSNR of PFFL perturbed adversarial images using the same amount of queries. Moreover, the adversarial attacks using PFFL produce images with much higher SSIM and PSNR than the attack using . This quantitatively demonstrates that PFFL can effectively guide the noise distribution to improve visual quality without changing the overall noise power. Furthermore, fig. 7 visually shows the comparison using different metrics with the same amount of query and demonstrates that adversarial perturbations generated using PFFL are indeed more imperceptible given the benign noise distribution. Here we need to point out that when the noise power is too small, our improvement is not as drastic because the injected noise is nearly unnoticeable. However, when the noise power is non-trivial, the visual gain produced by benign noise distributions is apparent. For more visualization examples, we refer our readers to Section 1 of the appendix. Additionally, a similar result can be observed in the experiments implemented on different network architectures, as shown in table 2. The above results indicate that PFFL can be flexibly applied to other network structures and attack frameworks.
For the untargeted attacks, we only report results generated using fewer query budget, as the perturbation is already imperceptible in the later iteration indicated by the high PSNR and SSIM. In this setting, the improvement of PFFL is also remarkable, as shown by table 3. When the query budget is further limited, e.g., using 800 queries, PFFL generates adversarial perturbations, which has much better visual quality with considerable SSIM and PSNR improvements. Figure 8 intuitively demonstrates the significant visual quality improvement by using PFFL to strategically guide the perturbation spatial distribution, in contrast to the undesired salt and pepper noise in -based examples.

original
PSNR=17.23
PSNR=18.01
PSNR=19.47
PSNR=10.17
PSNR=10.21
PSNR=10.23
Besides, we also conduct human perception evaluation on adversarial images generated by different metrics (results are reported in the appendix). The human perception study also supports that our proposed approach can generate much more imperceptible adversarial examples than baseline methods.
SSIM/PSNR SignOPT HSJA Queries PFFL PFFL 0.8k 0.67 /25.42 0.32 /23.00 0.65 /20.41 0.20 /18.64 1.6k 0.77 /28.09 0.45 /26.40 0.87 /28.28 0.57 /29.72 2.4k 0.88 /32.12 0.63 /30.99 0.92 /31.65 0.78 /34.27 3.2k 0.94 /35.64 0.74 /34.48 0.94 /33.23 0.85 /37.30
4.2 Why PFFL is a suitable objective?
In order to get a deeper insight into the effectiveness of PFFL, we further compare the adversarial images generated using SSIM as the attack objective. We optimize the SSIM metric using the HSJA algorithm. From fig. 9, we can find that images produced have much worse image quality with visible undesired textures and patterns. Notice that the PSNR performance of the SSIM-based adversarial examples is quite poor because the SSIM metric does not consider the overall noise power, as discussed in Sec. 2. This again shows that optimizing the existing metric (SSIM, , etc.) solely can hardly give rise to an efficient and visually satisfactory result.
The superior imperceptibility of images produced by PFFL is endowed by suppressing the overall noise power and local feature distortion simultaneously. To get more insights into the characteristics of PFFL, we further conduct a study on the correlation between PFFL, PSNR, and SSIM without attacks. We start from images with noise of different power added to it. By using projected gradient descent, we decrease the PFFL while making either PSNR or SSIM unchanged. From table 4 we can observe that: PFFL monotonically increases as SSIM decreases and PSNR remains unchanged; PFFL monotonically increases when PSNR reduces and SSIM is fixed. This effectively shows that, PFFL consider both aspects simultaneously when evaluating image quality and thus is a more reliable measure.
19.0 17.0 14.5 13.0 10.0 8.22 6.46 SSIM 0.7 66.13 76.07 97.65 116.3 - - - 0.6 82.33 90.35 107.3 122.5 166.5 202.5 247.3 0.5 105.9 106.8 121.1 136.5 180.6 215.5 258.0 0.4 143.1 130.5 140.0 152.2 193.9 229.4 274.1 0.3 175.1 171.3 166.3 178.4 213.5 247.6 290.9 0.2 - 191.5 213.6 218.2 249.6 281.8 322.5
From fig. 10 where different objective functions are used as the attack objective, it is straightforward to see that PFFL give rise to the perturbed adversarial results with higher SSIM and comparable PSNR, even though the metric directly optimize PSNR index. Better image quality is efficiently attained using PFFL through correlating perturbations with local image features and overall noise power. This is in line with our motivation as discussed in Sec. 2.


5 Conclusion
In this work, we propose a new metric, Perceptual Feature Fidelity Loss, for adversarial attack based on low-level image features for better visual quality. The metric relies on our novel low-level feature classifier and is compatible with different optimization methods. With the total distortion amount () comparable, our method can strategically change the noise distribution to improve imperceptibility, which is also verified quantitatively and qualitatively by our experiments.
Acknowledgement
The research presented in this paper is supported in part by the U.S. Army Research Laboratory and the U.K. Ministry of Defence under Agreement Number W911NF-16-3-0001 and the National Science Foundation (NSF) under awards # CNS-1705135 and CNS-1822935, and by the National Institutes of Health (NIH) award # P41EB028242 for the mDOT Center. The views and conclusions contained in this document are those of the authors and should not be interpreted as representing the official policies, either expressed or implied, of the NSF, the NIH, the U.S. Army Research Laboratory, the U.S. Government, the U.K. Ministry of Defence or the U.K. Government. The U.S. and U.K. Governments are authorized to reproduce and distribute reprints for Government purposes notwithstanding any copyright notation hereon.
References
- [1] Moustafa Alzantot, Yash Sharma, Supriyo Chakraborty, Huan Zhang, Cho-Jui Hsieh, and Mani B Srivastava. Genattack: Practical black-box attacks with gradient-free optimization. In Proceedings of the Genetic and Evolutionary Computation Conference, pages 1111–1119, 2019.
- [2] Peter J. Bex, Samuel G. Solomon, and Steven C. Dakin. Contrast sensitivity in natural scenes depends on edge as well as spatial frequency structure. Journal of Vision, 9(10):1–1, 09 2009.
- [3] Wieland Brendel, Jonas Rauber, and Matthias Bethge. Decision-based adversarial attacks: Reliable attacks against black-box machine learning models. arXiv preprint arXiv:1712.04248, 2017.
- [4] Antoni Buades, Bartomeu Coll, and J-M Morel. A non-local algorithm for image denoising. In 2005 IEEE Computer Society Conference on Computer Vision and Pattern Recognition (CVPR’05), volume 2, pages 60–65. IEEE, 2005.
- [5] John Canny. A computational approach to edge detection. IEEE Transactions on pattern analysis and machine intelligence, (6):679–698, 1986.
- [6] Nicholas Carlini and David Wagner. Towards evaluating the robustness of neural networks. In 2017 ieee symposium on security and privacy (sp), pages 39–57. IEEE, 2017.
- [7] Jianbo Chen, Michael I Jordan, and Martin J Wainwright. Hopskipjumpattack: A query-efficient decision-based attack. In 2020 IEEE Symposium on Security and Privacy (SP), pages 1277–1294. IEEE, 2020.
- [8] Minhao Cheng, Thong Le, Pin-Yu Chen, Jinfeng Yi, Huan Zhang, and Cho-Jui Hsieh. Query-efficient hard-label black-box attack: An optimization-based approach. arXiv preprint arXiv:1807.04457, 2018.
- [9] Minhao Cheng, Simranjit Singh, Pin-Yu Chen, Sijia Liu, and Cho-Jui Hsieh. Sign-opt: A query-efficient hard-label adversarial attack. arXiv preprint arXiv:1909.10773, 2019.
- [10] Francesco Croce and Matthias Hein. Sparse and imperceivable adversarial attacks. In Proceedings of the IEEE International Conference on Computer Vision, pages 4724–4732, 2019.
- [11] James Davis, Yi-Hsuan Hsieh, and Hung-Chi Lee. Humans perceive flicker artifacts at 500 hz. Scientific reports, 5:7861, 2015.
- [12] Jia Deng, Wei Dong, Richard Socher, Li-Jia Li, Kai Li, and Li Fei-Fei. Imagenet: A large-scale hierarchical image database. In 2009 IEEE conference on computer vision and pattern recognition, pages 248–255. Ieee, 2009.
- [13] Russell L DeValois and Karen K DeValois. Spatial vision. Oxford university press, 1990.
- [14] Weisheng Dong, Lei Zhang, Guangming Shi, and Xin Li. Nonlocally centralized sparse representation for image restoration. IEEE transactions on Image Processing, 22(4):1620–1630, 2012.
- [15] Logan Engstrom, Dimitris Tsipras, Ludwig Schmidt, and Aleksander Madry. A rotation and a translation suffice: Fooling cnns with simple transformations. arXiv preprint arXiv:1712.02779, 1(2):3, 2017.
- [16] William T. Freeman and Edward H Adelson. The design and use of steerable filters. IEEE Transactions on Pattern Analysis & Machine Intelligence, (9):891–906, 1991.
- [17] Ian J Goodfellow, Jonathon Shlens, and Christian Szegedy. Explaining and harnessing adversarial examples. arXiv preprint arXiv:1412.6572, 2014.
- [18] Kathrin Grosse, Praveen Manoharan, Nicolas Papernot, Michael Backes, and Patrick McDaniel. On the (statistical) detection of adversarial examples. arXiv preprint arXiv:1702.06280, 2017.
- [19] R. Guo and T. Blu. Fri sensing: Retrieving the trajectory of a mobile sensor from its temporal samples. IEEE Transactions on Signal Processing, pages 1–1, 2020.
- [20] Richard F Haines. The effects of video compression on acceptability of images for monitoring life sciences experiments, volume 3239. National Aeronautics and Space Administration, Office of Management …, 1992.
- [21] Kaiming He, Xiangyu Zhang, Shaoqing Ren, and Jian Sun. Deep residual learning for image recognition. In Proceedings of the IEEE conference on computer vision and pattern recognition, pages 770–778, 2016.
- [22] Alain Hore and Djemel Ziou. Image quality metrics: Psnr vs. ssim. In 2010 20th international conference on pattern recognition, pages 2366–2369. IEEE, 2010.
- [23] Hossein Hosseini and Radha Poovendran. Semantic adversarial examples. In Proceedings of the IEEE Conference on Computer Vision and Pattern Recognition Workshops, pages 1614–1619, 2018.
- [24] Gao Huang, Zhuang Liu, Laurens Van Der Maaten, and Kilian Q Weinberger. Densely connected convolutional networks. In Proceedings of the IEEE conference on computer vision and pattern recognition, pages 4700–4708, 2017.
- [25] Graham Hudson, Alain Léger, Birger Niss, István Sebestyén, and Jørgen Vaaben. Jpeg-1 standard 25 years: past, present, and future reasons for a success. Journal of Electronic Imaging, 27(4):040901, 2018.
- [26] Anne Humeau-Heurtier. Texture feature extraction methods: A survey. IEEE Access, 7:8975–9000, 2019.
- [27] Quan Huynh-Thu and Mohammed Ghanbari. Scope of validity of psnr in image/video quality assessment. Electronics letters, 44(13):800–801, 2008.
- [28] Andrew Ilyas, Logan Engstrom, Anish Athalye, and Jessy Lin. Black-box adversarial attacks with limited queries and information. arXiv preprint arXiv:1804.08598, 2018.
- [29] Shanika A Karunasekera and Nick G Kingsbury. A distortion measure for blocking artifacts in images based on human visual sensitivity. IEEE Transactions on image processing, 4(6):713–724, 1995.
- [30] Weisi Lin and C-C Jay Kuo. Perceptual visual quality metrics: A survey. Journal of visual communication and image representation, 22(4):297–312, 2011.
- [31] Haosen Liu and Shan Tan. Image regularizations based on the sparsity of corner points. IEEE Transactions on Image Processing, 28(1):72–87, 2018.
- [32] Bo Luo, Yannan Liu, Lingxiao Wei, and Qiang Xu. Towards imperceptible and robust adversarial example attacks against neural networks. In Thirty-Second AAAI Conference on Artificial Intelligence, 2018.
- [33] Rafał Mantiuk, Kil Joong Kim, Allan G Rempel, and Wolfgang Heidrich. Hdr-vdp-2: A calibrated visual metric for visibility and quality predictions in all luminance conditions. ACM Transactions on graphics (TOG), 30(4):1–14, 2011.
- [34] Jan Hendrik Metzen, Tim Genewein, Volker Fischer, and Bastian Bischoff. On detecting adversarial perturbations. arXiv preprint arXiv:1702.04267, 2017.
- [35] Flávia Cristina Brisque Neiva, Débora Martins Cattoni, José Lauro de Araújo Ramos, and Hugo Issler. Desmame precoce: implicações para o desenvolvimento motor-oral. Jornal de Pediatria, 79(1):7–12, 2003.
- [36] University of Washington. CSE576: Computer Vision: Chapter 7, 2000.
- [37] University of Washington. Computer Vision: Texture, 2009.
- [38] L.J. Ping, B. Igor, N.L. M, P.S. S, and Y. Simon. Information Computing And Automation (In 3 Volumes) - Proceedings Of The International Conference. World Scientific Publishing Company, 2008.
- [39] Haonan Qiu, Chaowei Xiao, Lei Yang, Xinchen Yan, Honglak Lee, and Bo Li. Semanticadv: Generating adversarial examples via attribute-conditional image editing. arXiv preprint arXiv:1906.07927, 2019.
- [40] Mohammad Saeed Rad, Behzad Bozorgtabar, Urs-Viktor Marti, Max Basler, Hazim Kemal Ekenel, and Jean-Philippe Thiran. Srobb: Targeted perceptual loss for single image super-resolution. In Proceedings of the IEEE International Conference on Computer Vision, pages 2710–2719, 2019.
- [41] Mohammad Saeed Rad, Behzad Bozorgtabar, Urs-Viktor Marti, Max Basler, Hazim Kemal Ekenel, and Jean-Philippe Thiran. Srobb: Targeted perceptual loss for single image super-resolution. 2019 IEEE/CVF International Conference on Computer Vision (ICCV), Oct 2019.
- [42] Mark Sandler, Andrew Howard, Menglong Zhu, Andrey Zhmoginov, and Liang-Chieh Chen. Mobilenetv2: Inverted residuals and linear bottlenecks. In Proceedings of the IEEE conference on computer vision and pattern recognition, pages 4510–4520, 2018.
- [43] Ayon Sen, Xiaojin Zhu, Liam Marshall, and Robert Nowak. Should adversarial attacks use pixel p-norm? arXiv preprint arXiv:1906.02439, 2019.
- [44] Mahmood Sharif, Lujo Bauer, and Michael K Reiter. On the suitability of lp-norms for creating and preventing adversarial examples. In Proceedings of the IEEE Conference on Computer Vision and Pattern Recognition Workshops, pages 1605–1613, 2018.
- [45] Christian Szegedy, Wojciech Zaremba, Ilya Sutskever, Joan Bruna, Dumitru Erhan, Ian Goodfellow, and Rob Fergus. Intriguing properties of neural networks. arXiv preprint arXiv:1312.6199, 2013.
- [46] Wei Wang, Ruiming Guo, Yapeng Tian, and Wenming Yang. Cfsnet: Toward a controllable feature space for image restoration. In Proceedings of the IEEE International Conference on Computer Vision, pages 4140–4149, 2019.
- [47] Zhou Wang, Alan C Bovik, Hamid R Sheikh, and Eero P Simoncelli. Image quality assessment: from error visibility to structural similarity. IEEE transactions on image processing, 13(4):600–612, 2004.
- [48] Andrew B Watson. Toward a perceptual video-quality metric. In Human Vision and Electronic Imaging III, volume 3299, pages 139–147. International Society for Optics and Photonics, 1998.
- [49] S Sabina Wolfson and Michael S Landy. Examining edge-and region-based texture analysis mechanisms. Vision Research, 38(3):439–446, 1998.
- [50] Eric Wong, Frank R Schmidt, and J Zico Kolter. Wasserstein adversarial examples via projected sinkhorn iterations. arXiv preprint arXiv:1902.07906, 2019.
- [51] Jinjian Wu, Guangming Shi, and Weisi Lin. Survey of visual just noticeable difference estimation. Frontiers of Computer Science, 13(1):4–15, 2019.
- [52] Qing Xia, Xiaoguang Li, L Zhuo, and KM Lam. Visual sensitivity-based low-bit-rate image compression algorithm. IET image processing, 6(7):910–918, 2012.
- [53] Shaoping Xu, Shunliang Jiang, and Weidong Min. No-reference/blind image quality assessment: a survey. IETE Technical Review, 34(3):223–245, 2017.
- [54] Hanwei Zhang, Yannis Avrithis, Teddy Furon, and Laurent Amsaleg. Smooth adversarial examples. arXiv preprint arXiv:1903.11862, 2019.
- [55] T Zhao and T Blu. The fourier-argand representation: An optimal basis of steerable patterns. IEEE Transactions on Image Processing: a Publication of the IEEE Signal Processing Society, 2020.
- [56] Zhengli Zhao, Dheeru Dua, and Sameer Singh. Generating natural adversarial examples. arXiv preprint arXiv:1710.11342, 2017.
- [57] Zhengyu Zhao, Zhuoran Liu, and Martha Larson. Towards large yet imperceptible adversarial image perturbations with perceptual color distance. arXiv preprint arXiv:1911.02466, 2019.
