High Values from CMB E-mode Data: A Clue for Resolving the Hubble Tension?
Abstract
The E-mode (EE) CMB power spectra measured by Planck, ACTPol, and SPTpol constrain the Hubble constant to be , , and km s-1 Mpc-1 within the standard model (posterior mean and central 68% interval bounds). These values are higher than the constraints from the Planck temperature (TT) power spectrum, and consistent with the Cepheid-supernova distance ladder measurement km s-1 Mpc-1. If this preference for a higher value was strengthened in a joint analysis it could provide an intriguing hint at the resolution of the Hubble disagreement. We show, however, that combining the Planck, ACTPol, and SPTpol EE likelihoods yields km s-1 Mpc-1, lower than the distance ladder measurement. This is due to different degeneracy directions across the full parameter space, particularly involving the baryon density, , and scalar tilt, , arising from sensitivity to different multipole ranges. We show that the E-mode constraints are consistent across the different experiments within , and with the Planck TT results at . Combining the Planck, ACTPol, and SPTpol EE data constrains the phenomenological lensing amplitude, , consistent with the expected value of unity.
1 Introduction
The standard Lambda-Cold Dark Matter () cosmological model is supported by a range of observations, including fluctuations in the cosmic microwave background (CMB), the large-scale distribution of galaxies, and, with the exception of lithium-7, primordial element abundance (e.g., Bennett et al., 2013; Planck Collaboration VI, 2020; Fields et al., 2020; eBOSS Collaboration, 2020). A significant disagreement has emerged between constraints and more direct measurements of the Hubble constant, . Combining Planck CMB data with baryon acoustic oscillation (BAO) measurements yields km s-1 Mpc-1 (eBOSS Collaboration, 2020), while the latest Cepheid-supernova distance ladder result is km s-1 Mpc-1 from the Supernova for the Equation Of State team (SH0ES; Riess et al., 2021). The SH0ES result is supported by various partially or fully independent low-redshift observations (e.g., Wong et al., 2020; Schombert et al., 2020; Kourkchi et al., 2020; Soltis et al., 2021; Blakeslee et al., 2021). Some low-redshift analyses have yielded lower values, consistent with both the CMB+BAO value and the SH0ES result (e.g., Freedman et al., 2019; Birrer et al., 2020). The ‘low’ values of based on measurements sensitive to the physics in the early universe are not driven by any single data set or observational method (e.g., Aubourg et al., 2015; Addison et al., 2018).
CMB data play a critical role in constraining possible deviations from , including modifications introduced in an attempt to address the disagreement (e.g., Knox & Millea, 2020, and references therein). Future improvements in cosmological constraints from the CMB will largely come from polarization. The Planck temperature-polarization (TE) cross-spectrum already constrains parameters with a comparable precision to the temperature (TT) spectrum, for example km s-1 Mpc-1 from TE+lowE, and km s-1 Mpc-1 from TT+lowE, where ‘lowE’ denotes the E-mode polarization likelihood at , which primarily constrains the optical depth, (Planck Collaboration VI, 2020).
Ongoing and upcoming ground-based surveys including Advanced ACTPol (Henderson et al., 2016), SPT-3G (Benson et al., 2014), Simons Observatory (Ade et al., 2019), and CMB-S4 (Abazajian et al., 2019), will make increasingly precise measurements of the EE spectrum, ultimately aiming to achieve uncertainties dominated by signal (sample variance) in the damping tail out to . By this point, the E-mode polarization will be more constraining than the temperature fluctuations, both for parameters like , and additional parameters constrained from the damping tail, such as the effective number of relativistic species, (e.g., Galli et al. 2014, Section 4 of Ade et al. 2019).
Parameter uncertainties from current EE spectra from Planck, the Atacama Cosmology Telescope (ACT) ACTPol receiver (Thornton et al., 2016), and the South Pole Telescope (SPT) SPTpol camera (Austermann et al., 2012) are fairly large, with constrained to 4-6% precision for each survey (Planck Collaboration VI, 2020; Henning et al., 2018; Aiola et al., 2020). Recently, Dutcher et al. (2021) reported the first cosmological constraints from the SPT-3G receiver. Assuming , they found a preference for a higher from the EE spectrum ( km s-1 Mpc-1) than Planck TT. They pointed out that the EE results from every one of Planck, ACTPol, SPTpol, and SPT-3G individually exhibit this same trend (see their Fig. 13). The EE spectra mildly prefer higher values than the Planck TT data, and also their TE counterparts.
Is this trend made more significant by combining the EE spectra from the different surveys? If so, it could be hinting at some modification to that addresses the Hubble tension while impacting temperature and polarization results differently. Such a hint would be valuable since the low-redshift measurements provide very little direction for physical resolutions of the disagreement. Alternatively, statistically significant shifts in parameters from EE compared to TT could indicate some new systematic issue that needs to be understood moving forward.
In this work we reexamine constraints from the Planck, ACTPol and SPTpol EE data111At the time of writing, the SPT-3G likelihood from Dutcher et al. (2021) is not publicly available, although we expect the SPT-3G and SPTpol results to produce similar constraints when combined with Planck (see Section 3.2). to shed light on this issue, motivated by both parameter tensions and the importance of the EE measurements for the future of CMB cosmology. We describe the public data sets and codes used in this work in Section 2, present results in Section 3 and conclude in Section 4. The main results are shown in Table LABEL:table:results and Figure 1.
2 Data and Model Fitting
We perform cosmological parameter fitting using Markov chain Monte Carlo (MCMC) sampling implemented in the CosmoMC222https://cosmologist.info/cosmomc/ package (Lewis & Bridle, 2002; Lewis, 2013). Theoretical CMB power spectra are computed from parameters using CAMB333https://camb.info/ (Lewis et al., 2000; Howlett et al., 2012). The parameters varied in the fits are the physical baryon and cold dark matter densities, and , the CosmoMC parameter , which is closely related to the angular spacing of the acoustic peaks, the scalar amplitude, , the optical depth, , and the scalar tilt, . The value of at each step in the chain is then derived from these. We follow the assumptions used by Planck Collaboration VI (2020) for massive neutrinos (fixing sum of masses to eV), the connection between primordial helium abundance and , and the parametric ‘tanh’ form for the evolution of the ionization fraction at reionization.
The Planck and ACTPol teams have released multiple likelihood versions. In this work we use the likelihoods used to compute the main results reported by these collaborations. For Planck we use the plik likelihood at , and the lowE likelihood at . These likelihoods are described by Planck Collaboration V (2020) and available on the Planck Legacy Archive444http://pla.esac.esa.int/pla/. For ACTPol we use the public ACTPollite likelihood described by Choi et al. (2020) and Aiola et al. (2020)555https://lambda.gsfc.nasa.gov/product/act/act_dr4_likelihood_get.cfm. For SPTpol we use the public likelihood provided by Henning et al. (2018)666https://pole.uchicago.edu/public/data/henning17/ and https://lambda.gsfc.nasa.gov/product/spt/sptpol_lh_2017_get.cfm. Foreground and nuisance parameters are varied in the fits using priors recommended by each collaboration and marginalized over in all results provided in this work. The overall calibration of the Planck, ACTPol, and SPTpol spectra, and associated uncertainties, are discussed in Section 3.3.4 of Planck Collaboration V (2020), Section 7 of Choi et al. (2020), and Section 4.5 of Henning et al. (2018), respectively. Convergence of the fits is assessed using multiple chains following the standard CosmoMC approach, requiring the Gelman-Rubin diagnostic of within-chain and across-chain parameter spread, (Gelman & Rubin, 1992).
3 Results
| EE Data | ||||||
|---|---|---|---|---|---|---|
| Planck | ||||||
| ACTPol | ||||||
| SPTpol | ||||||
| Planck+ACTPol | ||||||
| Planck+SPTpol | ||||||
| ACTPol+SPTpol | ||||||
| Planck+ACTPol+SPTpol |
3.1 Results from each experiment separately
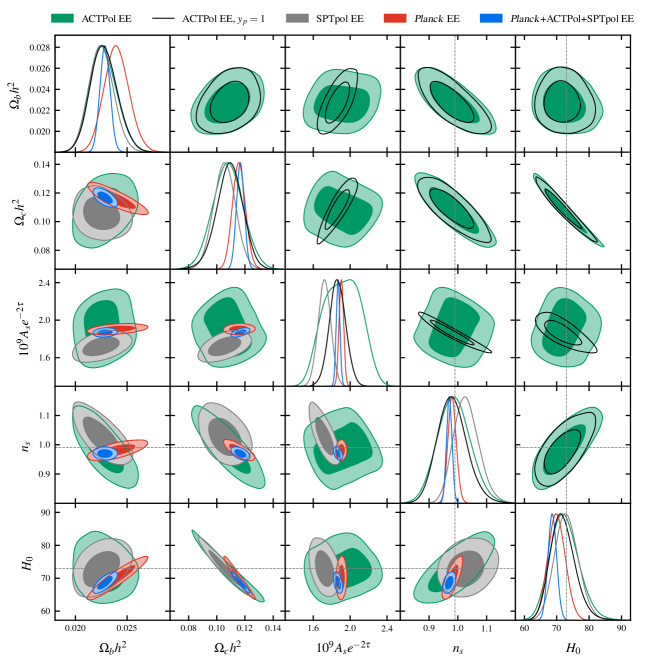
We present results from fitting to the Planck, SPTpol, and ACTPol EE spectra in Table LABEL:table:results. We provide the posterior mean plus bounds of the central 68% interval. Since the constraint on is largely driven by the Planck lowE likelihood in each case we report the combination rather than and separately (Kosowsky et al., 2002). Figure 1 shows two-dimensional contours containing 68 and 95% of the posterior distributions for each experiment. In the figure we show instead of to facilitate comparison with low-redshift measurements.
We remark here that, for all three experiments separately, lies within of unity, and differs by at most from the latest SH0ES measurement of km s-1 Mpc-1 (Riess et al., 2021).
3.2 Results from combining experiments
.
We show results for parameters from a joint fit to the Planck, ACTPol, and SPTpol EE spectra in Table LABEL:table:results and Figure 1.
Combining the three EE spectra does not reinforce the preference for higher values of from the individual fits, yielding km s-1 Mpc-1 (posterior mean and central 68% interval). This value lies lower than the distance ladder measurement km s-1 Mpc-1 (Riess et al., 2021). This is the main result of this paper, and is due to the different degeneracy directions in the full multidimensional parameter space, and the fact that there are offsets in the preferred mean values from each experiment (even though, as discussed in Section 3.3, below, they are statistically consistent).
To help illustrate this, we include dashed lines in Figure 1 corresponding to of 73 km s-1 Mpc-1 and of 0.99. These values are allowed within the 68% contours of each individual experiment but disfavored at around in the combination. Looking at the panel of Figure 1 we see that these parameters are positively correlated for Planck EE, but negatively correlated for ACTPol and SPTpol. While the experiments individually prefer or allow higher values, with correspondingly higher , this is not possible in the combination because a consensus must also be reached for . The portion of multidimensional parameter space most acceptable to all the data sets instead features lower and values.
Most of the Planck EE spectrum constraining power is at larger angular scales (), where, for pivot scale Mpc-1, increasing leads to an overall suppression of power. The ACTPol and SPTpol EE constraining power is mostly from finer scales, where increasing leads to an overall enhancement of power. The Planck, ACTPol, and SPTpol EE bandpowers are shown in Figure 8 of Dutcher et al. (2021). This difference in behavior leads to a significant change in the degeneracy direction because the derivative of the theory spectrum with respect to also changes sign between larger and smaller angular scales (Fig. 1 of Galli et al., 2014). A similar change in the degeneracy direction is also apparent over different multipole ranges of the TT spectrum (e.g., Fig. 1 of Addison et al., 2016). These changes in degeneracy directions are reproduced in Fisher forecasts, without using the actual measured power spectra, although where exactly the different contours intersect in parameter space is, of course, determined by the measurements.
As a point of comparison, a simple inverse variance weighting of the one-dimensional constraints from Planck, ACTPol, and SPTpol, ignoring the parameter correlations, yields km s-1 Mpc-1. The reduction in the uncertainty in the full multidimensional fit illustrates this complementarity of the lower and higher multipoles of the EE spectrum for breaking parameter degeneracies.
While we do not yet have access to the SPT-3G EE likelihood, we note that the SPT-3G and SPTpol two-dimensional parameter contours exhibit similar degeneracy directions (Fig. 9 of Dutcher et al., 2021). We therefore expect the combination of Planck and SPT-3G to produce similar results to the Planck+SPTpol or Planck+ACTPol results in Table LABEL:table:results, including a lower value of and than reported for SPT-3G EE alone.
| EE Data Sets | Overall | Worst 1-D |
|---|---|---|
| Planck vs ACTPol | ||
| Planck vs SPTpol | ||
| ACTPol vs SPTpol | ||
| Planck vs ACTPol+SPTpol | ||
| Planck+ACTPol vs SPTpol | ||
| Planck+SPTpol vs ACTPol |
3.3 Consistency of different EE spectra within CDM
In this subsection we quantify the consistency of the Planck, ACTPol, and SPTpol EE results within . Provided the data sets are independent and the posterior parameter distributions are well-approximated as multivariate Gaussian777We discuss these assumptions in Sections 3.3.1 and 3.3.2. we can perform a simple test for the consistency of the difference of the posterior means with zero (e.g., Addison et al., 2016; Raveri & Hu, 2019),
| (1) |
Here the data sets are labeled with subscripts 1 and 2, the Roman subscripts label parameters, and and are the mean and covariance estimated from the MCMC chains. This is converted to an equivalent Gaussian ‘’ by matching the probability-to-exceed from the distribution to that from a standard Gaussian distribution but considering only positive values (so corresponds to difference). These values are reported in Table LABEL:table:consistency. Based on calculations using subsets of the full MCMC chains, the finite number of steps used to estimate sets an uncertainty floor of around in this test. Since the posteriors are driven by the common lowE likelihood we perform a comparison in five dimensions888Substituting for in these tests impacts the consistency results at ., , following, for example, Aiola et al. (2020) and Dutcher et al. (2021).
In addition to testing the consistency between each pair out of Planck, ACTPol, and SPTpol, we tested the consistency between each experiment and the combination of the other two. These results are also shown in Table LABEL:table:consistency. Overall we find no significant evidence for disagreement, with parameter differences no larger than . This indicates that the preference for the lower value in the combined fit cannot be attributed to any significant tensions between the separate EE data sets.
The most notable single parameter difference is in for SPTpol, which falls low of Planck EE. The SPTpol polarization maps were calibrated by comparing the SPTpol and SPTpolPlanck EE spectra on the SPTpol patch (Section 7.3 of Henning et al., 2018). This difference may therefore simply arise from an unfortunate statistical fluctuation on the SPTpol patch, but could also hint at some systematic issues arising when reanalyzing Planck data on small sky patches (see also Section 13.3 of Choi et al., 2020). Given the low statistical significance we do not attempt to investigate this issue further in this work. The SPT-3G data produced constraints in better agreement with Planck (Fig. 9 of Dutcher et al., 2021), although this is not surprising given the calibration was performed against the full-sky Planck spectra in that analysis.
3.3.1 Independence of EE spectra from different experiments
In reality the different data sets are correlated with one another due to partial sky overlap. Due to a combination of current EE noise levels and the small size of the SPTpol patch we argue below that we can safely neglect these correlations (as done in previous studies).
The covariance between the parameters from the Planck and ACTPol EE spectra was estimated by Aiola et al. (2020) under the assumption that the E-modes measured by ACTPol are a subset of the modes accessible to the Planck analysis. Aiola et al. (2020) found that ignoring the covariance would artificially tighten parameter constraints from a joint EE fit only at the per cent level (i.e., the uncertainties derived in a joint MCMC ignoring the covariance would be too tight by order per cent). This would fall below the uncertainty floor mentioned above for our consistency tests.
The SPTpol 500 deg2 survey area is around nine times smaller than ACTPol’s, covering only a few per cent of the area used in the Planck analysis, and thus we can also neglect the Planck-SPTpol EE covariance.
There is partial overlap between the SPTpol patch and the W5 field used in the ACTPol analysis below declination (compare Fig. 1 of Henning et al. 2018 and Fig. 2 of Choi et al. 2020). However, this overlap region is a small fraction of the total ( deg2) area used in the ACTPol analysis, and among the shallowest, with all the deep ACTPol fields lying at higher declination.
3.3.2 Gaussianity of posterior distributions
The ACTPol contours in Figure 1 display clear non-Gaussian features, which arise primarily because the nuisance parameter , which controls the polarization efficiency, is assigned a broad uniform prior on . When fitting only to ACTPol EE data this opens up a large degeneracy with and, to some extent, other parameters. In joint fits with either TT or TE spectra, or another experiment, this degeneracy is broken and is tightly constrained, consistent with unity to within (See Table 4 of Aiola et al., 2020, for results from joint fits to ACTPol and WMAP or Planck). For the consistency tests involving a comparison with ACTPol alone in Table LABEL:table:consistency we therefore ran ACTPol chains fixing , which produces approximately Gaussian posteriors for the parameters (shown in the upper triangle of Fig. 1). This yields slightly more stringent consistency tests in the sense that the additional scatter corresponding to different values is not allowed.
Some small asymmetry of the one-dimensional posteriors is apparent for various parameters (not only for ACTPol) in Table LABEL:table:results. Given the lack of evidence for tension between the data sets in Table LABEL:table:consistency we have not pursued additional tests attempting to account for this.
3.4 Comparison with Planck TT constraints and impact of gravitational lensing on the EE spectrum
Comparisons between parameter constraints from the CMB temperature and E-mode fluctuations are important for checking the performance of the model and looking for hints of deviations. Since the Planck TT data is far more constraining than other TT results we compare the combined Planck+ACTPol+SPTpol EE parameters discussed above to the Planck TT parameters derived in conjunction with the lowE constraint on (Planck Collaboration VI, 2020), rather than performing a joint TT analysis with ACT or SPT data.
Taking the EE and Planck TT constraints as independent, we find that the five-dimensional consistency test used in Table LABEL:table:consistency yields TT-EE consistency at the level, with the largest single parameter difference being for . The TT and EE spectra and parameters from the same sky area are partially correlated (evidenced by the non-zero TE spectrum). Over the multipole range accessible to Planck, however, the correlation coefficients between parameters from TT and their EE counterparts have magnitude 0.1 or smaller, even for ideal noiseless data (see Figs. 4 and 5 of Kable et al., 2020). Given the significant noise levels in the Planck polarization data the TT and EE constraints are therefore well approximated as independent.
The Planck TT data has shown a persistent preference for a larger-than-expected value of the phenomenological lensing amplitude parameter, , when this is added as a free model parameter (see Planck Collaboration VI, 2020; Efstathiou & Gratton, 2019, for most recent results). This is associated with tensions between parameters for different multipole ranges and a preference for a closed universe when using TT data alone (e.g., Planck Collaboration XI, 2016; Addison et al., 2016; Planck Collaboration Int. LI, 2017; Di Valentino et al., 2020; Efstathiou & Gratton, 2020; Handley, 2021).
The Planck EE spectrum alone yields . Combining the EE data sets produces a much tighter constraint, comparable in precision to TT, but shifted to lower values:
| (Planck EE+ACTPol EE+SPTpol EE+lowE) | (2) | |||
These values differ at , although the difference across the full parameter space (five parameters, as in the earlier consistency tests, plus ) is . The parameters are in good agreement, differing only at .
These results are qualitatively similar to those presented for the SPTpol TE+EE data by Henning et al. (2018), where the value of fell low of the Planck TT constraint. Marginalizing over produced good agreement for the parameters from Planck TT and SPTpol, however, which were in mild tension for .
Aiola et al. (2020) reported for the ACTPol spectra (TT+TE+EE), and combining ACTPol and WMAP likewise resulted in a value centred around unity. Story et al. (2013) reported from a joint fit to WMAP and the SPT TT spectrum. We find from a similar joint fit to WMAP and ACTPol TT.
Overall, current EE measurements are consistent with the results from the Planck TT data, and do not show the same preference for . The exact origin of the Planck TT behavior is unclear, and it may well have no connection to any underlying physics (see also, e.g., Couchot et al., 2017; Efstathiou & Gratton, 2019). Any modified cosmology models that do attempt to address the TT issue should also be tested against the EE data from Planck, ACTPol and SPTpol, however, given that Planck EE provides a far weaker constraint than the combination.
3.5 Choice of prior on optical depth
The results shown in this work adopt the lowE Planck likelihood to constrain , based on a cross-correlation analysis of Planck High Frequency Instrument (HFI) 100 and 143 GHz data, using 30 and 353 GHz maps to clean the Galactic synchrotron and dust (see Section 2.2 of Planck Collaboration V, 2020, for more details). In recent years, a number of other studies have constrained using different combinations of Planck and WMAP data, including alternative processing and mapmaking for the Planck polarization (e.g., Weiland et al., 2018; Planck Collaboration Int. LVII, 2020; BeyondPlanck Collaboration I, 2020; Natale et al., 2020). These analyses give a spread in mean values of from 0.05 to 0.07, and uncertainties from 0.006 to 0.2. The lowE likelihood gives (Planck Collaboration VI, 2020). We also ran MCMC chains instead using a Gaussian prior , matching the choice adopted in the ACTPol analysis by Aiola et al. (2020). We found that for the EE results shown in Table LABEL:table:results the impact of this choice is very small, with shifts in posterior means at the level, and changes in 68% interval bounds only at the few per cent level.
4 Conclusions
We have examined the parameter constraints from separate and joint fits to EE power spectra from the Planck, ACTPol, and SPTpol surveys, motivated by the recent observation that the EE spectra from each experiment separately produce higher values of than, for example, Planck TT, in good agreement with the Cepheid-SNe SH0ES ladder (Dutcher et al., 2021).
A joint fit to Planck, ACTPol and SPTpol EE spectra yields km s-1 Mpc-1. This value is lower than the distance ladder, and also lower than the result from any of the data sets separately. This behavior arises from different degeneracy directions across the full parameter space, particularly for and . We found, however, that the EE spectra from the different experiments produce consistent parameters, with differences across the five-dimensional parameter space (excluding ) at the level or lower (Table LABEL:table:consistency). In other words, the shift to a lower is not because the data sets are incompatible. There is a tension in values of the power spectrum amplitude, , inferred from Planck EE and SPTpol EE, which may hint at some calibration issues.
The parameters from the joint EE fit are consistent with the parameters from the Planck TT data within . We found that the EE data precisely constrain the phenomenological lensing amplitude parameter , preferring a value consistent with unity, . Like earlier analyses of the ACTPol and SPTpol data we do not reproduce the preference for seen in the Planck TT spectrum.
Based on our results, the preference for higher values from the separate EE measurements seems more likely to be due to chance fluctuations than the first hint of systematic differences in preferred parameters from, for example, the TT data. Such differences could still exist, of course, and will no doubt be the subject of future work with upcoming data. New theoretical models that impact the TT and EE spectra differently may yet be promising for resolving the Hubble disagreement. Given the consistency between the current TT and EE data within , however, it seems unlikely that such models would be favored over at a statistically significant level by CMB data.
Acknowledgments
I would like to thank Chuck Bennett for many valuable discussions, as well as comments on this work. I’m also grateful to Janet Weiland, Gary Hinshaw, and Mark Halpern for helpful discussions and suggestions, and to Erminia Calabrese and Jason Hennings for help with the ACTPol and SPTpol likelihood codes.
This work was supported in part by NASA ROSES grants NNX17AF34G and 80NSSC19K0526. This work was based on observations obtained with Planck (http://www.esa.int/Planck), an ESA science mission with instruments and contributions directly funded by ESA Member States, NASA, and Canada. I acknowledge the use of the Legacy Archive for Microwave Background Data Analysis (LAMBDA), part of the High Energy Astrophysics Science Archive Center(HEASARC). HEASARC/LAMBDA is a service of the Astrophysics Science Division at the NASA Goddard Space Flight Center. This research project was conducted using computational resources at the Maryland Advanced Research Computing Center (MARCC).
References
- Abazajian et al. (2019) Abazajian, K., Addison, G., Adshead, P., et al. 2019, arXiv e-prints, arXiv:1907.04473. https://arxiv.org/abs/1907.04473
- Addison et al. (2016) Addison, G. E., Huang, Y., Watts, D. J., et al. 2016, ApJ, 818, 132, doi: 10.3847/0004-637X/818/2/132
- Addison et al. (2018) Addison, G. E., Watts, D. J., Bennett, C. L., et al. 2018, ApJ, 853, 119, doi: 10.3847/1538-4357/aaa1ed
- Ade et al. (2019) Ade, P., Aguirre, J., Ahmed, Z., et al. 2019, Journal of Cosmology and Astro-Particle Physics, 2019, 056, doi: 10.1088/1475-7516/2019/02/056
- Aiola et al. (2020) Aiola, S., Calabrese, E., Maurin, L., et al. 2020, J. Cosmology Astropart. Phys, 2020, 047, doi: 10.1088/1475-7516/2020/12/047
- Aubourg et al. (2015) Aubourg, É., Bailey, S., Bautista, J. E., et al. 2015, Phys. Rev. D, 92, 123516, doi: 10.1103/PhysRevD.92.123516
- Austermann et al. (2012) Austermann, J. E., Aird, K. A., Beall, J. A., et al. 2012, in Society of Photo-Optical Instrumentation Engineers (SPIE) Conference Series, Vol. 8452, Millimeter, Submillimeter, and Far-Infrared Detectors and Instrumentation for Astronomy VI, ed. W. S. Holland & J. Zmuidzinas, 84521E, doi: 10.1117/12.927286
- Bennett et al. (2013) Bennett, C. L., Larson, D., Weiland, J. L., et al. 2013, ApJS, 208, 20, doi: 10.1088/0067-0049/208/2/20
- Benson et al. (2014) Benson, B. A., Ade, P. A. R., Ahmed, Z., et al. 2014, in Society of Photo-Optical Instrumentation Engineers (SPIE) Conference Series, Vol. 9153, Proc. SPIE, 91531P, doi: 10.1117/12.2057305
- BeyondPlanck Collaboration I (2020) BeyondPlanck Collaboration I. 2020, arXiv e-prints, arXiv:2011.05609. https://arxiv.org/abs/2011.05609
- Birrer et al. (2020) Birrer, S., Shajib, A. J., Galan, A., et al. 2020, A&A, 643, A165, doi: 10.1051/0004-6361/202038861
- Blakeslee et al. (2021) Blakeslee, J. P., Jensen, J. B., Ma, C.-P., Milne, P. A., & Greene, J. E. 2021, arXiv e-prints, arXiv:2101.02221. https://arxiv.org/abs/2101.02221
- Choi et al. (2020) Choi, S. K., Hasselfield, M., Ho, S.-P. P., et al. 2020, J. Cosmology Astropart. Phys, 2020, 045, doi: 10.1088/1475-7516/2020/12/045
- Couchot et al. (2017) Couchot, F., Henrot-Versillé, S., Perdereau, O., et al. 2017, A&A, 597, A126, doi: 10.1051/0004-6361/201527740
- Di Valentino et al. (2020) Di Valentino, E., Melchiorri, A., & Silk, J. 2020, Nature Astronomy, 4, 196, doi: 10.1038/s41550-019-0906-9
- Dutcher et al. (2021) Dutcher, D., Balkenhol, L., Ade, P. A. R., et al. 2021, arXiv e-prints, arXiv:2101.01684. https://arxiv.org/abs/2101.01684
- eBOSS Collaboration (2020) eBOSS Collaboration. 2020, arXiv e-prints, arXiv:2007.08991. https://arxiv.org/abs/2007.08991
- Efstathiou & Gratton (2019) Efstathiou, G., & Gratton, S. 2019, arXiv e-prints, arXiv:1910.00483. https://arxiv.org/abs/1910.00483
- Efstathiou & Gratton (2020) —. 2020, MNRAS, 496, L91, doi: 10.1093/mnrasl/slaa093
- Fields et al. (2020) Fields, B. D., Olive, K. A., Yeh, T.-H., & Young, C. 2020, J. Cosmology Astropart. Phys, 2020, 010, doi: 10.1088/1475-7516/2020/03/010
- Freedman et al. (2019) Freedman, W. L., Madore, B. F., Hatt, D., et al. 2019, ApJ, 882, 34, doi: 10.3847/1538-4357/ab2f73
- Galli et al. (2014) Galli, S., Benabed, K., Bouchet, F., et al. 2014, Phys. Rev. D, 90, 063504, doi: 10.1103/PhysRevD.90.063504
- Gelman & Rubin (1992) Gelman, A., & Rubin, D. B. 1992, Statist. Sci., 7, 457, doi: 10.1214/ss/1177011136
- Handley (2021) Handley, W. 2021, Phys. Rev. D, 103, L041301, doi: 10.1103/PhysRevD.103.L041301
- Henderson et al. (2016) Henderson, S. W., Allison, R., Austermann, J., et al. 2016, Journal of Low Temperature Physics, 184, 772, doi: 10.1007/s10909-016-1575-z
- Henning et al. (2018) Henning, J. W., Sayre, J. T., Reichardt, C. L., et al. 2018, ApJ, 852, 97, doi: 10.3847/1538-4357/aa9ff4
- Howlett et al. (2012) Howlett, C., Lewis, A., Hall, A., & Challinor, A. 2012, J. Cosmology Astropart. Phys, 1204, 027, doi: 10.1088/1475-7516/2012/04/027
- Hunter (2007) Hunter, J. D. 2007, Computing in Science & Engineering, 9, 90, doi: 10.1109/MCSE.2007.55
- Kable et al. (2020) Kable, J. A., Addison, G. E., & Bennett, C. L. 2020, ApJ, 888, 26, doi: 10.3847/1538-4357/ab54cc
- Knox & Millea (2020) Knox, L., & Millea, M. 2020, Phys. Rev. D, 101, 043533, doi: 10.1103/PhysRevD.101.043533
- Kosowsky et al. (2002) Kosowsky, A., Milosavljevic, M., & Jimenez, R. 2002, Phys. Rev. D, 66, 063007, doi: 10.1103/PhysRevD.66.063007
- Kourkchi et al. (2020) Kourkchi, E., Tully, R. B., Eftekharzadeh, S., et al. 2020, ApJ, 902, 145, doi: 10.3847/1538-4357/abb66b
- Lewis (2013) Lewis, A. 2013, Phys. Rev. D, 87, 103529, doi: 10.1103/PhysRevD.87.103529
- Lewis (2019) —. 2019. https://arxiv.org/abs/1910.13970
- Lewis & Bridle (2002) Lewis, A., & Bridle, S. 2002, Phys. Rev. D, 66, 103511, doi: 10.1103/PhysRevD.66.103511
- Lewis et al. (2000) Lewis, A., Challinor, A., & Lasenby, A. 2000, ApJ, 538, 473, doi: 10.1086/309179
- Natale et al. (2020) Natale, U., Pagano, L., Lattanzi, M., et al. 2020, A&A, 644, A32, doi: 10.1051/0004-6361/202038508
- Planck Collaboration XI (2016) Planck Collaboration XI. 2016, A&A, 594, A11, doi: 10.1051/0004-6361/201526926
- Planck Collaboration V (2020) Planck Collaboration V. 2020, A&A, 641, A5, doi: 10.1051/0004-6361/201936386
- Planck Collaboration VI (2020) Planck Collaboration VI. 2020, A&A, 641, A6, doi: 10.1051/0004-6361/201833910
- Planck Collaboration Int. LI (2017) Planck Collaboration Int. LI. 2017, A&A, 607, A95, doi: 10.1051/0004-6361/201629504
- Planck Collaboration Int. LVII (2020) Planck Collaboration Int. LVII. 2020, A&A, 643, A42, doi: 10.1051/0004-6361/202038073
- Raveri & Hu (2019) Raveri, M., & Hu, W. 2019, Phys. Rev. D, 99, 043506, doi: 10.1103/PhysRevD.99.043506
- Riess et al. (2021) Riess, A. G., Casertano, S., Yuan, W., et al. 2021, ApJ, 908, L6, doi: 10.3847/2041-8213/abdbaf
- Schombert et al. (2020) Schombert, J., McGaugh, S., & Lelli, F. 2020, AJ, 160, 71, doi: 10.3847/1538-3881/ab9d88
- Soltis et al. (2021) Soltis, J., Casertano, S., & Riess, A. G. 2021, ApJ, 908, L5, doi: 10.3847/2041-8213/abdbad
- Story et al. (2013) Story, K. T., Reichardt, C. L., Hou, Z., et al. 2013, ApJ, 779, 86, doi: 10.1088/0004-637X/779/1/86
- Thornton et al. (2016) Thornton, R. J., Ade, P. A. R., Aiola, S., et al. 2016, ApJS, 227, 21, doi: 10.3847/1538-4365/227/2/21
- van der Walt et al. (2011) van der Walt, S., Colbert, S. C., & Varoquaux, G. 2011, Computing in Science and Engineering, 13, 22, doi: 10.1109/MCSE.2011.37
- Virtanen et al. (2020) Virtanen, P., Gommers, R., Oliphant, T. E., et al. 2020, Nature Methods, 17, 261, doi: 10.1038/s41592-019-0686-2
- Weiland et al. (2018) Weiland, J. L., Osumi, K., Addison, G. E., et al. 2018, ApJ, 863, 161, doi: 10.3847/1538-4357/aad18b
- Wong et al. (2020) Wong, K. C., Suyu, S. H., Chen, G. C. F., et al. 2020, MNRAS, 498, 1420, doi: 10.1093/mnras/stz3094