Strong coupling between scales in a multi-scalar model of urban dynamics
Abstract
Urban evolution processes occur at different scales, with intricate interactions between levels and relatively distinct type of processes. To what extent actual urban dynamics include an actual strong coupling between scales, in the sense of both top-down and bottom-up feedbacks, remains an open issue with important practical implications for the sustainable management of territories. We introduce in this paper a multi-scalar simulation model of urban growth, coupling a system of cities interaction model at the macroscopic scale with morphogenesis models for the evolution of urban form at the scale of metropolitan areas. Strong coupling between scales is achieved through an update of model parameters at each scale depending on trajectories at the other scale. The model is applied and explored on synthetic systems of cities. Simulation results show a non-trivial effect of the strong coupling. As a consequence, an optimal action on policy parameters such as containing urban sprawl is shifted. We also run a multi-objective optimization algorithm on the model, showing showing that compromise between scales are captured. Our approach opens new research directions towards more operational urban dynamics models including a strong feedback between scales.
Keywords: Urban dynamics; Systems of cities; Urban morphogenesis; Multi-scalar modeling; Strong coupling
1 Introduction
The modeling of urban growth and more generally the dynamics of urban systems is central to the design of sustainable territorial policies, through the understanding of past urbanisation processes and the anticipation of future urban trajectories. The design of sustainable future cities requires an historical knowledge of how past cities came to be and evolved [Batty, 2018]. Several models have been proposed at different scales and integrating different dimensions of urban systems, such as models of land-use change at a mesoscopic scale or systems of cities models at a macroscopic scale [Pumain and Reuillon, 2017].
At the scale of a metropolitan area, Land-use Transport Interaction models [Wegener and Fürst, 2004] are for example a widely used tool to estimate the dynamics of spatial distributions of activities (mostly residential location and economic activities) in response to an evolution of the accessibility landscape caused by new transportation infrastructures [Raimbault, 2019a]. In a similar context, cellular automata models of urban growth or land-use change study more generally land-use transitions with a high spatial resolution, and are mostly data-driven [Clarke et al., 2007]. At the smaller scale of the system of cities, macroscopic models of urban growth have focused on reproducing the distribution of city sizes, either through economic processes as e.g. [Gabaix, 1999], or from a geographical point of view focusing on interactions between cities [Favaro and Pumain, 2011].
Territorial dynamics, and more particularly urban dynamics, have according to [Pumain, 1997] an intrinsic multi-scalar nature, with successive autonomous levels of emergence from individual microscopic agents to the mesoscopic scale of the city and the macroscopic scale of the system of cities. While models at each scale with distinct ontologies are useful to answer their own questions, an explicit account of inter-scale feedbacks, both top-down and bottom-up, would allow testing policies and interventions distributed and differentiated across scales while not neglecting the interactions between scales [Wegener and Spiekermann, 2018]. Indeed, the need for sustainable territorial policies would imply the construction of multi-scalar models to take simultaneously into account issues associated to each relevant scale [Rozenblat and Pumain, 2018, Raimbault, 2019b].
Multi-scalar models of urban dynamics are however still at their beginnings. [Murcio et al., 2015] consider population flows at different spatial ranges from the urban area to the country, but does not incorporate distinct ontologies and processes for the different scales. [Batty, 2005] however suggests that a similar formalism can be applied to urban processes at different scales. Multi-level statistical models capture some information at imbricated scales [Shu et al., 2020], although they can not be used as dynamical simulation models. Similarly, multi-level cellular automata (CA) models for urban growth include factors influencing urban expansion at multiple scales [Xu and Gao, 2019]. [Cheng and Masser, 2003] propose a general framework for such approaches. [Torrens and O’Sullivan, 2001] suggest that hybrid models coupling CA with other formalisms is a crucial development in the field. [White, 2006] introduces a CA with variable grid size to account for heterogeneities across scales. [Zhu and Tian, 2020] couple an agent-based model with a CA at multiple scales. [Yu et al., 2018] embed a local CA into a regional intercity model and a macroscopic potential model. [Ford et al., 2019] couple at different scales an urban development model with a flooding risk model to forecast the future impact of extreme climate events on the London metropolitan region. [Xu et al., 2020] develop an agent-based model of urban expansion with both macro and micro agents. [Raimbault, 2019c] suggests that integrating network dynamics at the link level in a macroscopic urban system models is a way to implement a multi-scale model, as done by [Raimbault, 2020b] which explores hierarchy properties of cities and networks in this context.
In disciplines neighbour to urban modeling, methods have been developed for multi-scale models. For example in spatial epidemiology, [Banos et al., 2015] combines agent-based modeling for local diffusion dynamics with differential equations at the population scale. The NetLogo software for agent-based modeling includes a specific extension for multi-scale modeling [Hjorth et al., 2020]. Multi-scale models have also been used for the simulation of crowd dynamics [Crociani et al., 2016]. The study of traffic is also made more accurate by coupling macroscopic and microscopic models [Boulet et al., 2020]. The management of ecosystems requires integrating across actors and scales [Belem and Müller, 2013]. These non-exhaustive illustrations highlight how the integration of scales is a crucial feature and issue in the understanding of complex systems [Chavalarias et al., 2009].
This paper contributes to the open question of multi-scalar models of urban dynamics by introducing a new simulation model which integrates a strong coupling between the mesoscopic scale and the macroscopic scale. The dynamics within each scale influence the other and reciprocally in an iterative way. More precisely, the model is simple in its components as we focus on the spatial structure of processes rather than on their multi-dimensionality. Therefore, we take into account only population variables, but both at the macroscopic scale of the system of cities and at the mesoscopic scale of the metropolitan area with an urban morphogenesis model. Our contribution is novel regarding previous works in particular regarding the following points: (i) the stylised model explicitly couples distinct scales and ontologies in a strong manner, most models operating only a weak coupling between scales (i.e. no reciprocal and dynamical feedbacks); (ii) the behavior of the model is systematically studied on synthetic systems of cities using model exploration methods.
The rest of this paper is organised as follows: we first describe the model; we then develop its exploration on synthetic systems of cities, and optimization using a genetic algorithm; we finally discuss developments and implications of this work.
2 Multi-scale urban dynamics model
2.1 Rationale
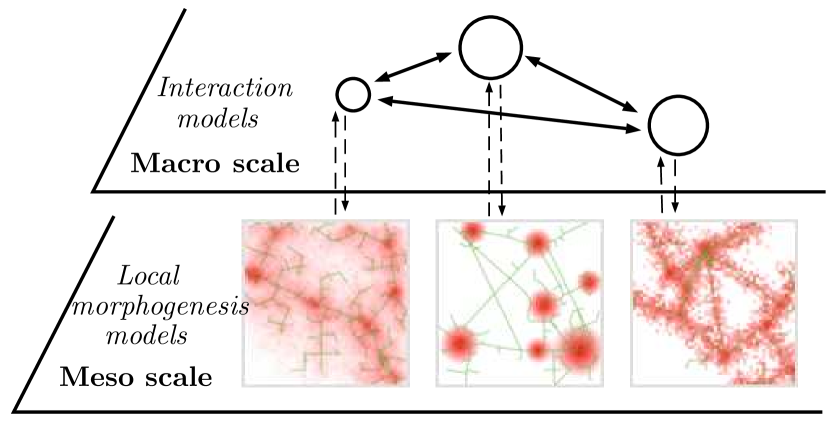
The main characteristic of our model is a strong coupling between the macroscopic scale of a system of cities with the mesoscopic scale of metropolitan areas. We consider simple urban dimensions with population variables only to describe cities, and use stylised processes. The system of cities evolves following a spatial interaction model as described by [Raimbault, 2020c], assuming that interaction flows between cities will increase their attractivity and thus their population growth rate. Population updates are not done directly following migration flows as in stochastic urban models such as in [James et al., 2018], but with the hypothesis of hidden variables (generally scaling with population) capturing for example economic dimensions, which influence population growth rate. At the mesoscopic scale, we consider the spatial distribution of population within an urban area and focus on the growth of urban form. To achieve this, the reaction-diffusion model of urban morphogenesis described by [Raimbault, 2018] allows capturing concentration forces and dispersion forces, and has been shown to reproduce a large range of existing urban forms. Furthermore, [Raimbault, 2020a] showed that this model had a good coverage of the morphological space when compared to other models of urban morphogenesis.
To couple the scales, we assume that (i) macroscopic performance of a city will influence the choices made by planers in terms of land-use, and thus parameters of the morphogenesis mode locally - empirical evidence of such links have been suggested in the literature [Joy and Vogel, 2015] and we stylise them here; (ii) urban form influences the inner workings of a city through congestion and the fostering of exchanges between agents (individuals, firms), and finally the global insertion of the city - thus spatial interaction parameters are updated as a function of local urban form. This last link is the most discutable in terms of empirical evidence and implies many other dimensions than population only. We however work on a stylised explicative model which must keep a simple structure but on which a systematic knowledge of model behavior can be developed. We show in Fig. 1 a schematic description of model structure.
2.2 Formalization
We consider urban areas, represented at the macroscopic scale by their population at time , and at the mesoscopic scale by a population grid . The model runs for a total number of time steps, and we will assume that for the sake of simplicity (the formulas can be generalized for arbitrary values of the time step, for example when running on real data with irregular time sampling).
The simulation model operates iteratively, and at each time step goes sequentially through the following steps:
- 1.
- 2.
-
3.
local urban form are evolved conditionally to a fixed population increase and following the mescoscopic parameters;
-
4.
congestions and interactions within areas are synthesised following a cost function, which is used to update the macroscopic interaction parameters (Equations 8 and LABEL:eq:eq8).
Details of each stage are described below
2.2.1 Macroscopic model for populations
Following [Raimbault, 2020c] and [Favaro and Pumain, 2011], aggregated populations variables are evolved according to
| (1) |
The gravity interaction potential between cities is given by
| (2) |
We write the population variations as
| (3) |
2.2.2 Top-down feedback
The population variations at the macroscopic scale then influence the mesoscopic parameters to capture the top-down feedback. Therefore, the parameters of [Raimbault, 2018], namely of diffusion and of aggregation are both updated. First, the mesoscopic growth rate is adjusted to the population growth uniformly over the time interval such that , where is a global model parameter controlling the temporal granularity of local population increases.
The sprawl parameter evolves according to a fixed multiplier and the relative population increase following
| (4) |
where the multiplier parameter allows testing different scenarios: a negative value corresponds to transit-oriented development while a positive value corresponds to an uncontrolled sprawl.
The aggregation parameter evolves in a similar way but as a function of accessibility increase, following the rationale that more accessible place with concentrate more activities, as
| (5) |
where the multiplier parameter allows switching between a metropolisation scenario (more aggregation) and an uniformisation scenario (less aggregation). In that context, the accessibility is computed as
| (6) |
Change in the level of sprawl () depends on the population pressure only, while aggregation depends on accessibility since it is linked to metropolisation processes.
2.2.3 Evolution of urban form at the mesoscopic scale
Mesoscopic grids population grids are evolved separately within each urban area, using the updated morphogenesis model parameters. We follow here the same exact steps described in [Raimbault, 2018], with parameters total population increase, diffusion level, aggregation level, time steps and number of diffusions. The model adds iteratively population to grid cells, by distributing it with a probability following a preferential attachment to population, and diffusing it.
In terms of implementation, small population differences in the end between macroscopic and mesoscopic levels (due to rounding in computing the number of steps) is corrected by adjusting the macroscopic increments by the effective mesoscopic increments (which are assumed to be more precise).
| Type | Parameter | Process | Range |
| Macro | Endogenous growth | ||
| Interactions weight | |||
| Interactions hierarchy | |||
| Interactions decay | |||
| Meso | Aggregation | ||
| Diffusion | |||
| Urban growth speed | |||
| Diffusion | |||
| Multiscale | Downward feedback | ||
| Downward feedback | |||
| Upward feedback | |||
| Cost of congestion |
2.2.4 Bottom-up feedback
Finally, bottom-up feedback is captured by updating the macroscopic parameters. For the sake of simplicity, only interaction decays are updated, assuming that patterns of urban form play a role in the global insertion of the city. More precisely, we compute gravity flows within the area, and aggregate their value as an economic activity with a squared negative externality interpreted as a congestion with a cost parameter , following
| (7) |
This utility is used to update the interaction decays following
| (8) |
where the multiplier parameter allows controlling for the influence of local performance on global insertion.
2.3 Parameters
The Table 1 summarizes model parameters. For clarity, we do not include parameters linked to synthetic model setup, and distinguish them by the scale to which they are attached.
2.4 Synthetic setup
The system is initialized with synthetic systems of cities. A number cities are distributed randomly into a regional urban system, as a square world of width (reference unit for the decay parameter). City populations follow a Zipf law with hierarchy parameter (may be modified in experiments), and the initial size of the largest city. Within each city, we consider initial population grids as monocentric (grid of size and center cell density population units, following an exponential kernel of width one fifth of the world). The model is simulated for 20 macroscopic time steps (order of magnitude of half a century), each representing mesoscopic time steps (parameter changed in experiments).
2.5 Indicators
Model behavior is characterized using the following indicators: at the macroscopic scale: distributions of population, accessibilities, and centralities (summarized by average, hierarchy, entropy), following [Raimbault, 2020d]. At the mesoscopic scale, urban form is captured following the indicators used by [Raimbault, 2018], i.e. Moran index, average distance between individuals, hierarchy of population distribution, and entropy of population distribution.
3 Results
3.1 Implementation
Model implementation is done under some performance constraints: mesoscopic morphogenesis models must be simulated in parallel at each macroscopic time step. On the contrary, macroscopic interactions are efficient to implement as they are based on matrices computations. The model is implemented in scala and integrated into a broader library for spatial sensitivity analysis and dynamical models for settlement systems, namely the spatialdata library [Raimbault et al., 2020]. This library in particular already includes implementations of the models used in [Raimbault, 2020c] and [Raimbault, 2018], but also of other urban interaction models such as [Favaro and Pumain, 2011]. The relative large number of parameters and output indicators imposes the use of appropriate model exploration methods to get a grasp of model behavior. Therefore, the parameter space is explored with the OpenMOLE model exploration software [Reuillon et al., 2013]. Standalone source code for the model is available on an open git repository at https://github.com/JusteRaimbault/UrbanGrowth-model, while the repository for results is at https://github.com/JusteRaimbault/UrbanGrowth. Simulation data used in this paper is available on the dataverse repository at https://doi.org/10.7910/DVN/IRHMQK.
3.2 Statistical consistency
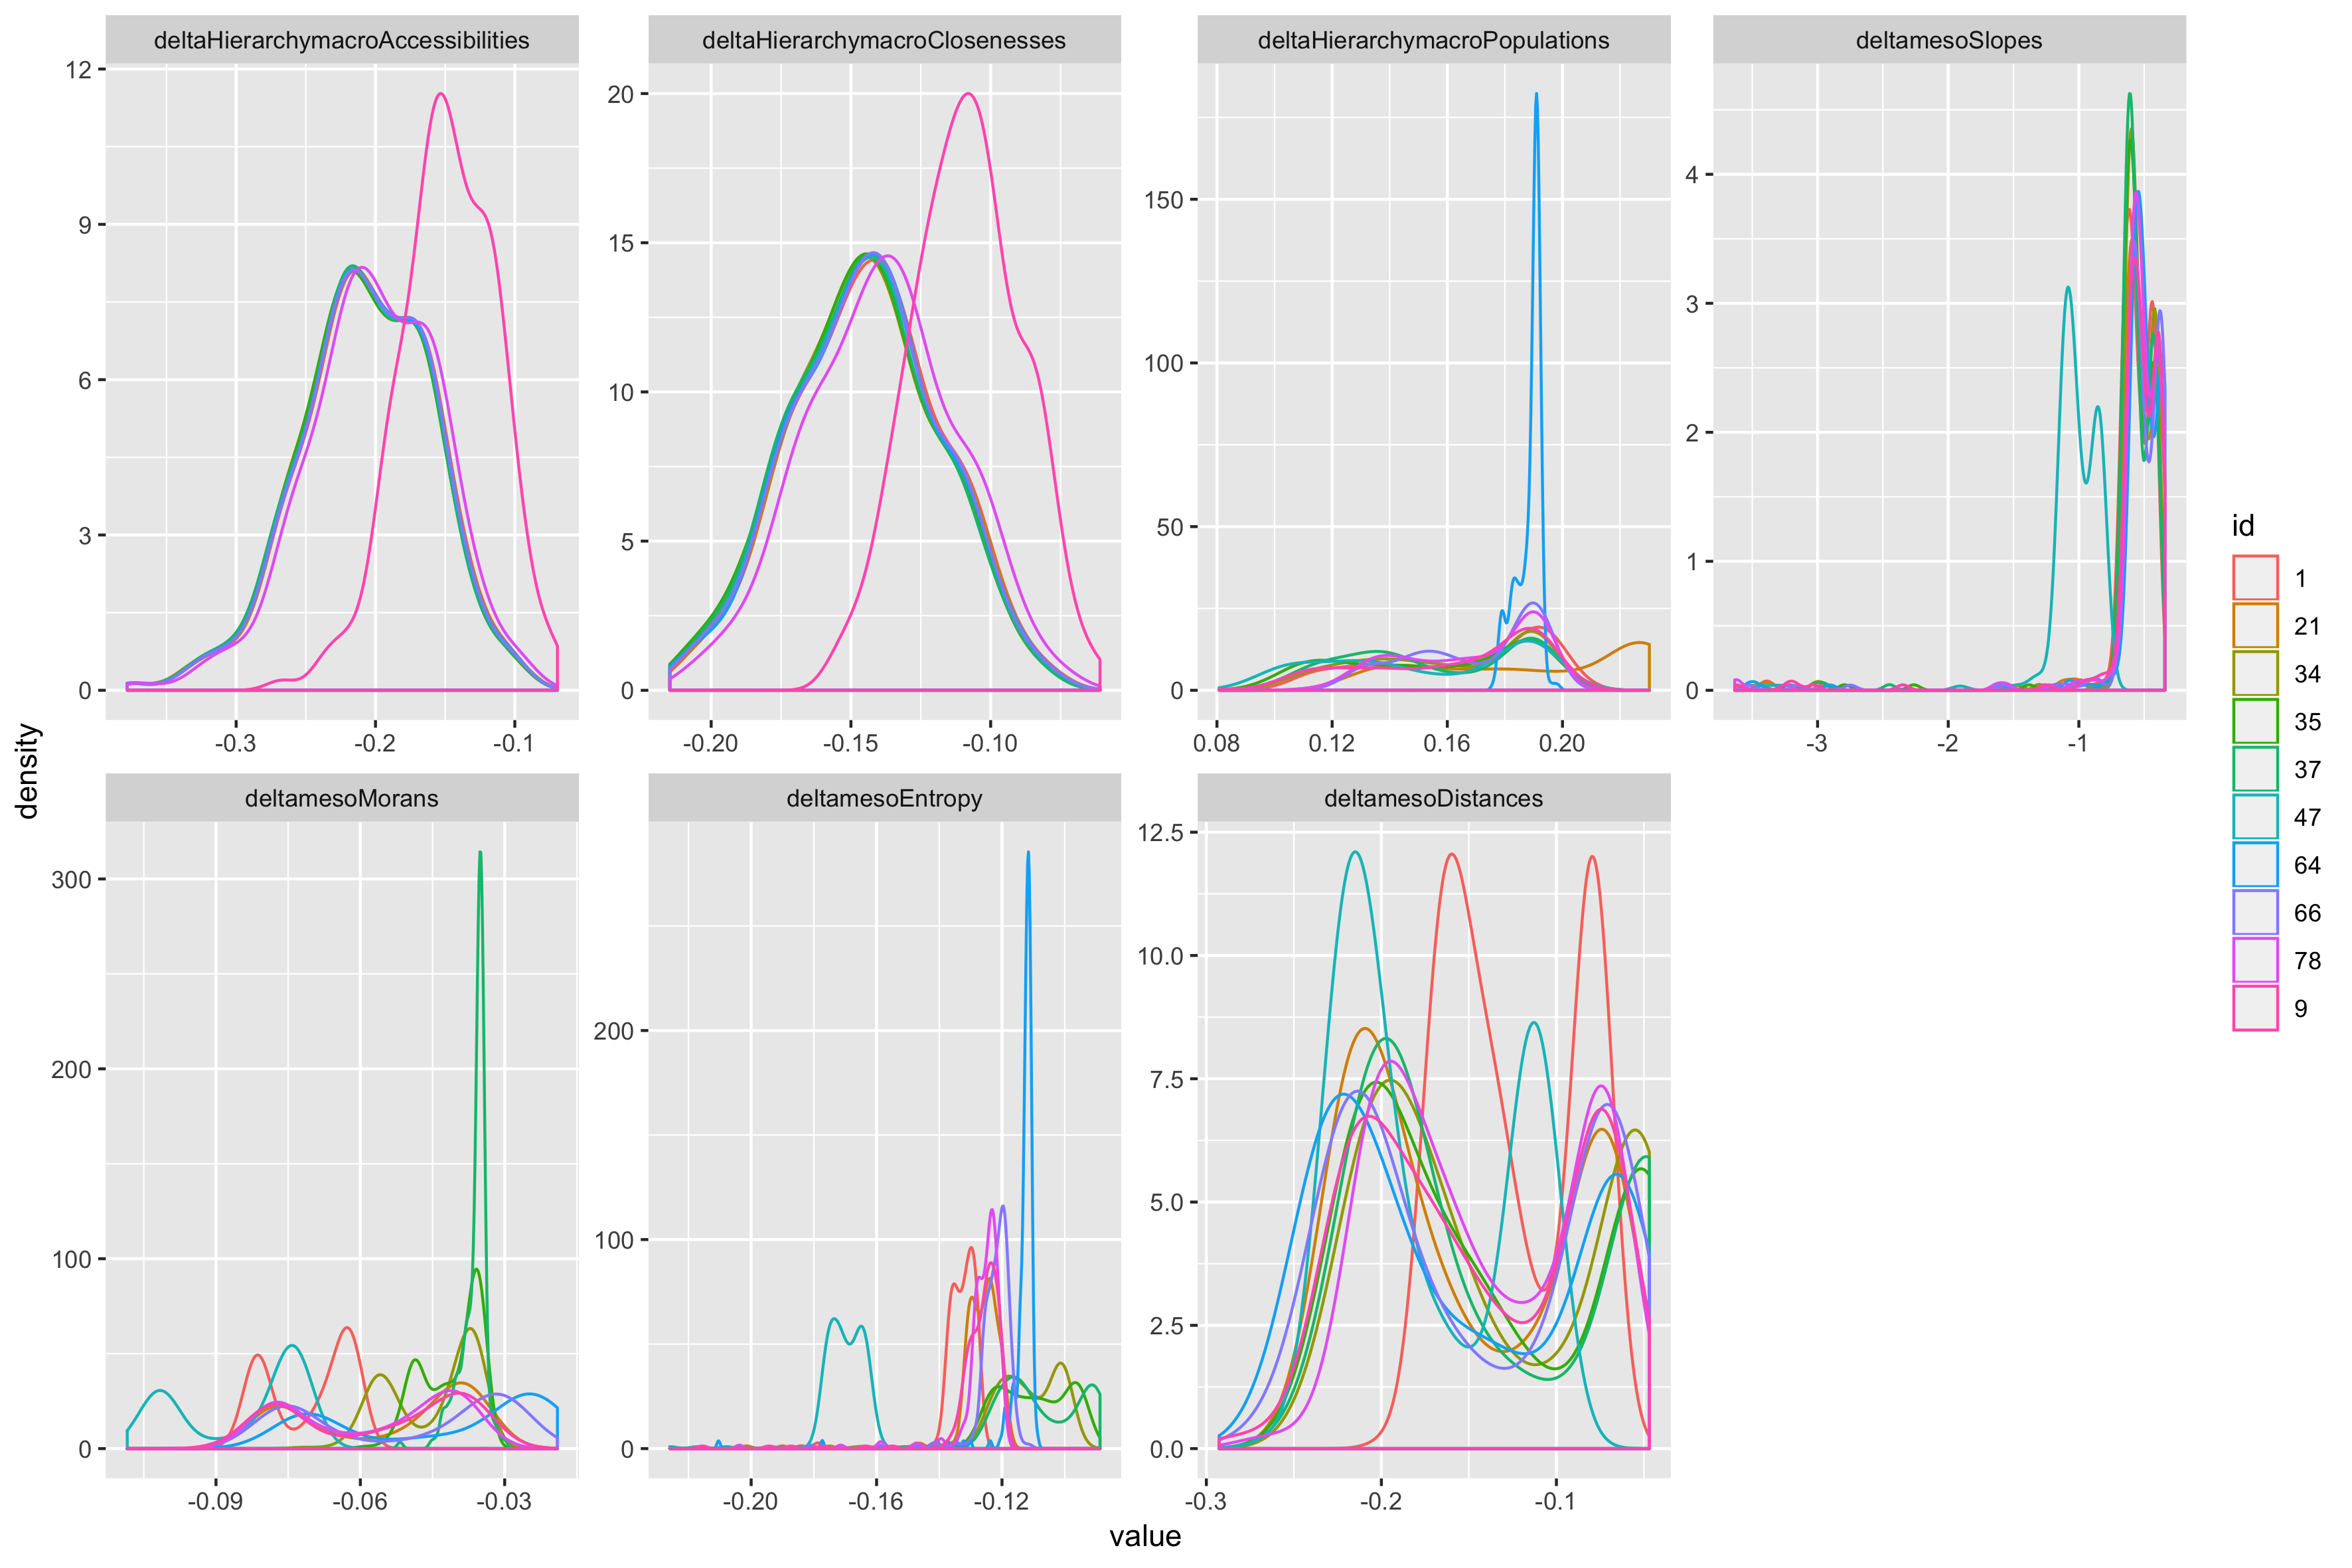
The first numerical experiment is aimed at checking the statistical consistency of model output across stochastic repetitions. We run a one-factor-at-a-time sampling on all parameters with 5 steps for each within the domain provided in Table 1, and 500 stochastic repetitions for each parameter.Obtained statistical distribution are shown in Fig. 2 for a sample of 10 parameters. Different indicators exhibit various distribution shapes, but are always unimodal and generally rather localized. This means different parameter values can be discriminated when considering summary statistics. To estimate the role of noise, we compute Sharpe ratios (rate between average and standard deviations) for each indicators and parameter values. Median values of these across parameters are always larger than 1.6, confirming a reasonable influence of noise on model outputs. We run experiments with 50 replications for each parameter value in the following.
3.3 Grid exploration
We then turn to a grid exploration of the parameter space. Results show an important role of the strong coupling between scales. This is shown for example by the variation of macroscopic indicators trajectories when switching from a “transit-oriented development” scenario (negative feedback of population growth on diffusion ) to a “sprawl” scenario (positive feedback ) as shown in Fig. 4 below.
We show in Fig. 3 that both macroscopic and mesoscopic indicators have a U-shaped behavior as a function of the bottom-up feedback parameter . In terms of macroscopic trajectories, we see that hierarchies of accessibilities, closeness centrality and population are maximal in negative value when the mechanism is deactivated, what means that the feedback process moderates the hierarchisation of the global urban system. For the urban form, this feedback also mitigates the aggregation of population.
The strong coupling of scales, in particular the interaction between bottom-up and top-down feedbacks, has a non-trivial influence on model behavior, as shown in Fig. 4 for the macroscopic hierarchy of populations. This allows investigating the influence of the macroscopic interaction decay and the mesoscopic evolution speed, under stylised scenarios for the top-down feedback. We exhibit interaction effects between and , as quantitative and qualitative behavior as a function of changes across panels. Interaction range has on the contrary no significant effect. We find that increasing decreases macroscopic hierarchy when top-down feedback is deactivated (), but a cancelling of this effect when it is activated. This may have policy implications in terms of controlling urban sprawl by acting or not on , and its influence on the overall urban system.
3.4 Impact of policy parameters
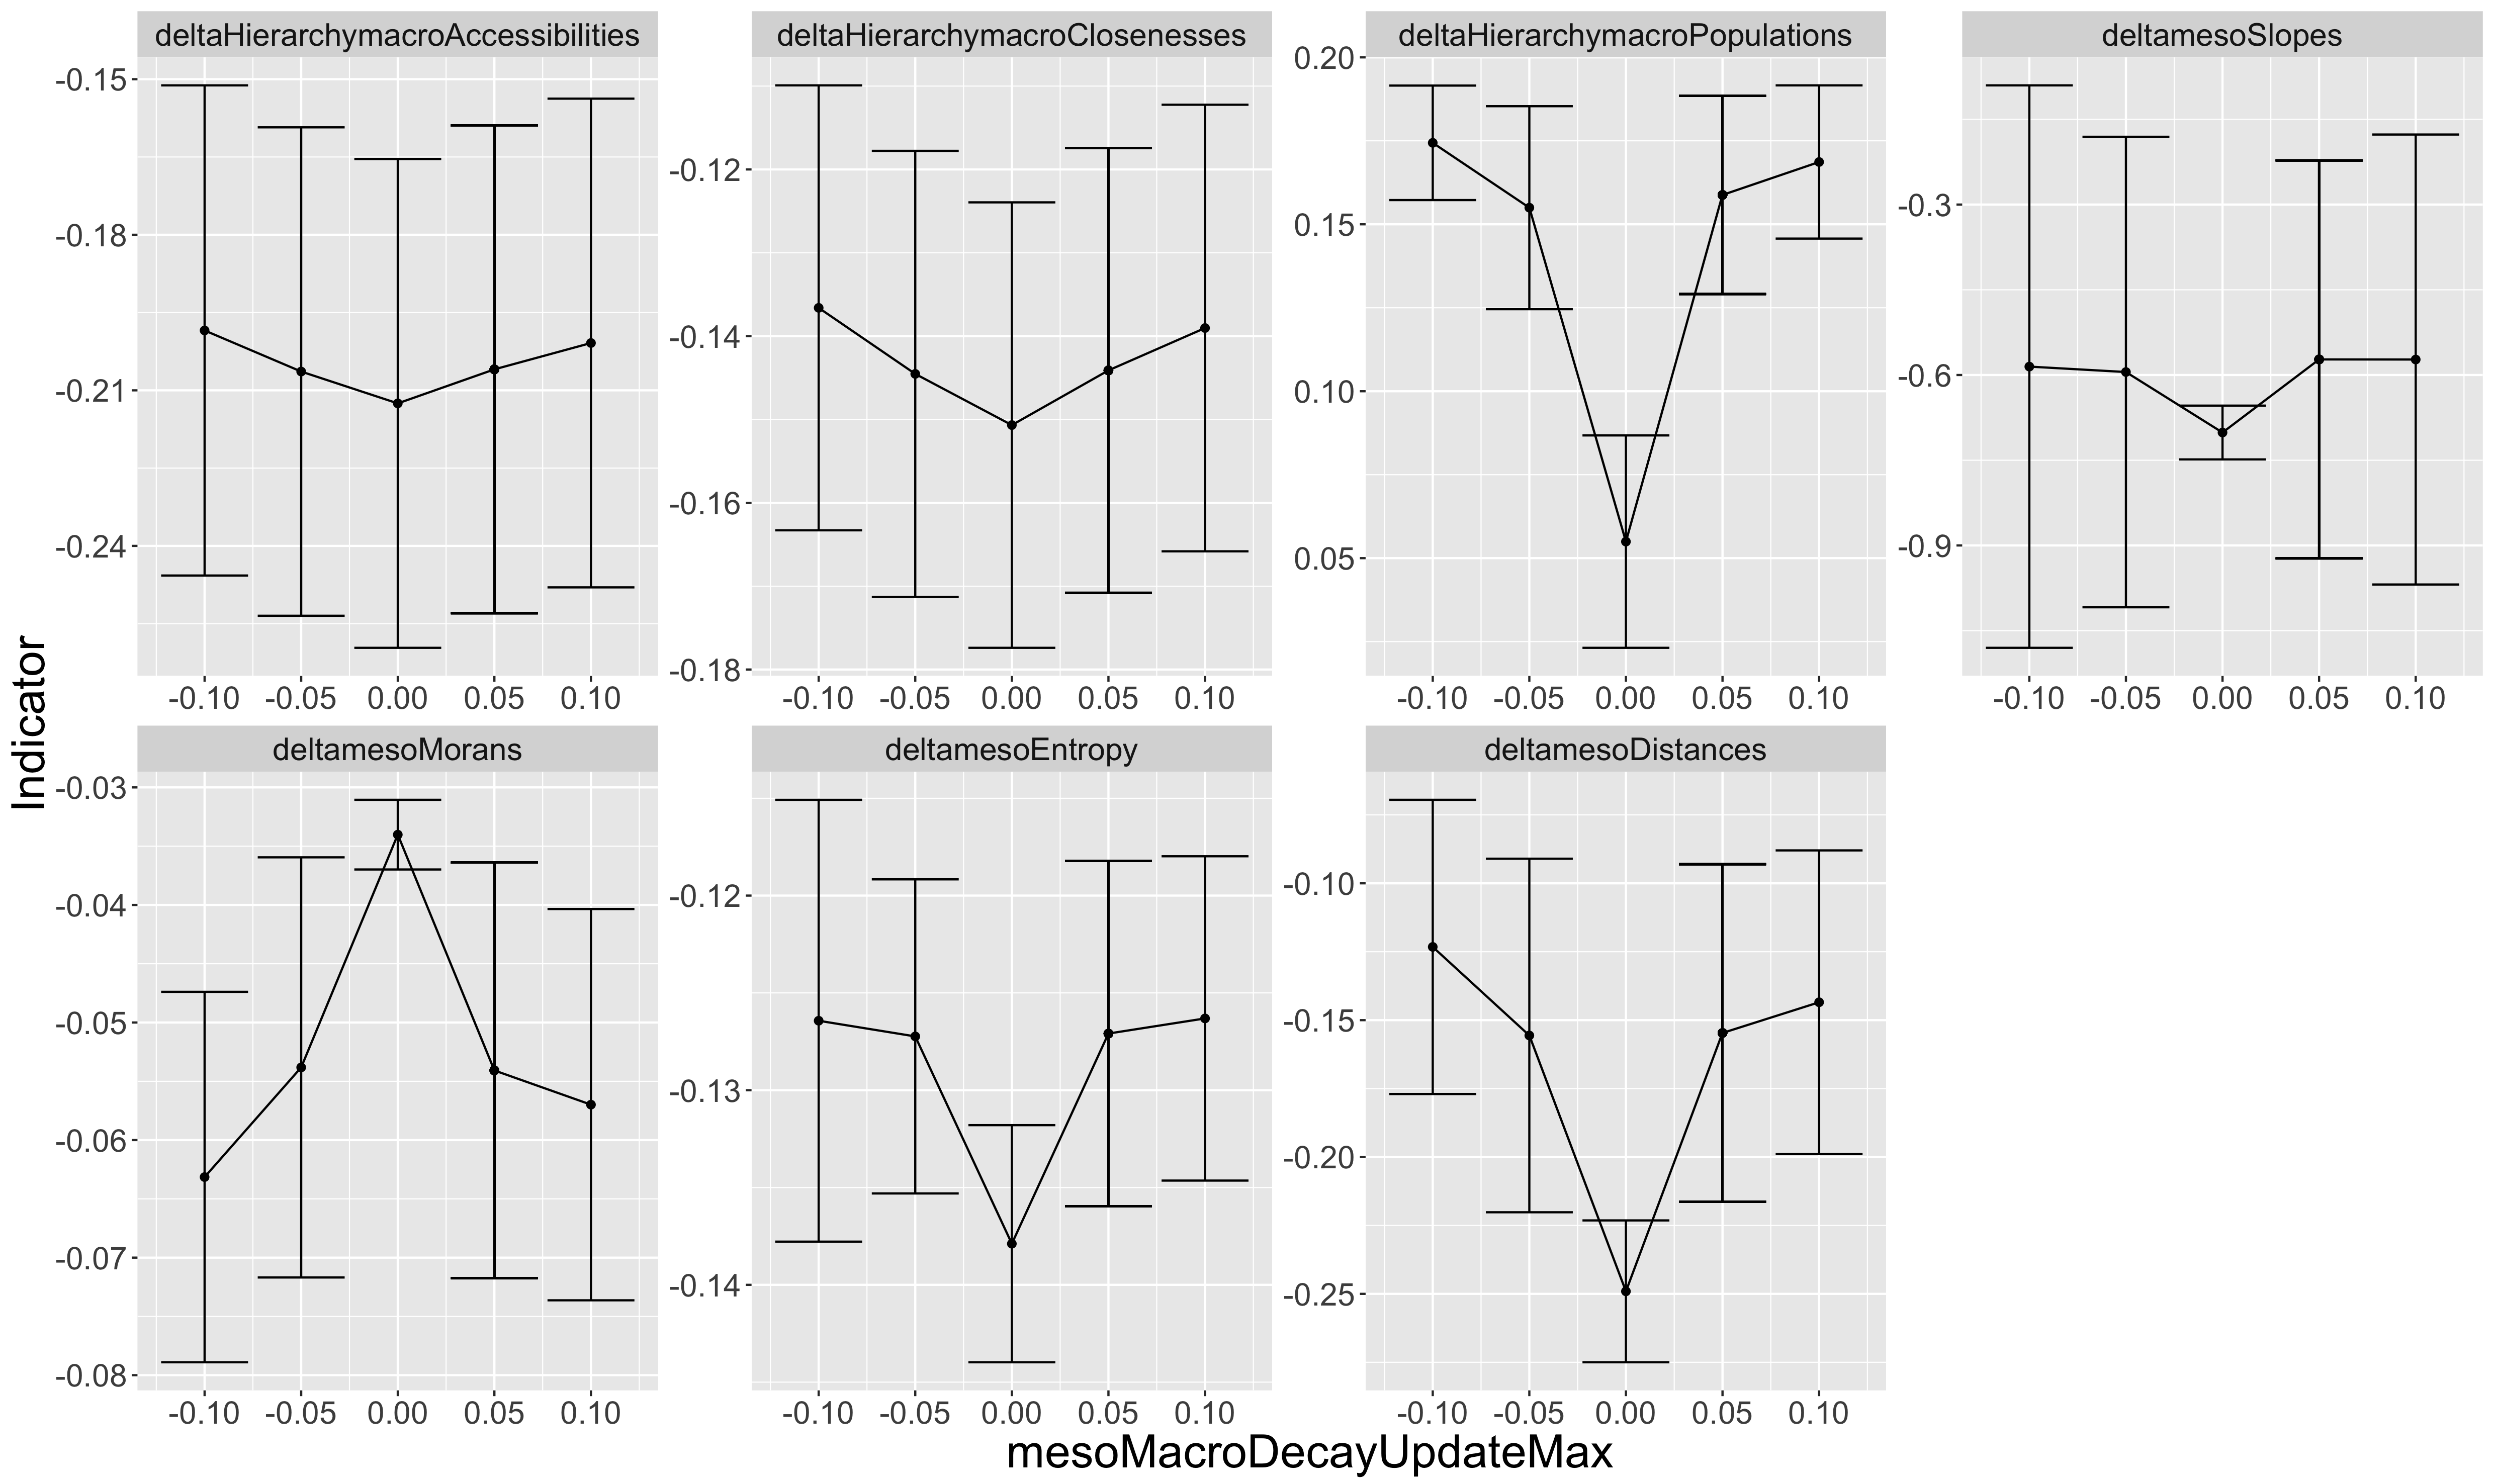
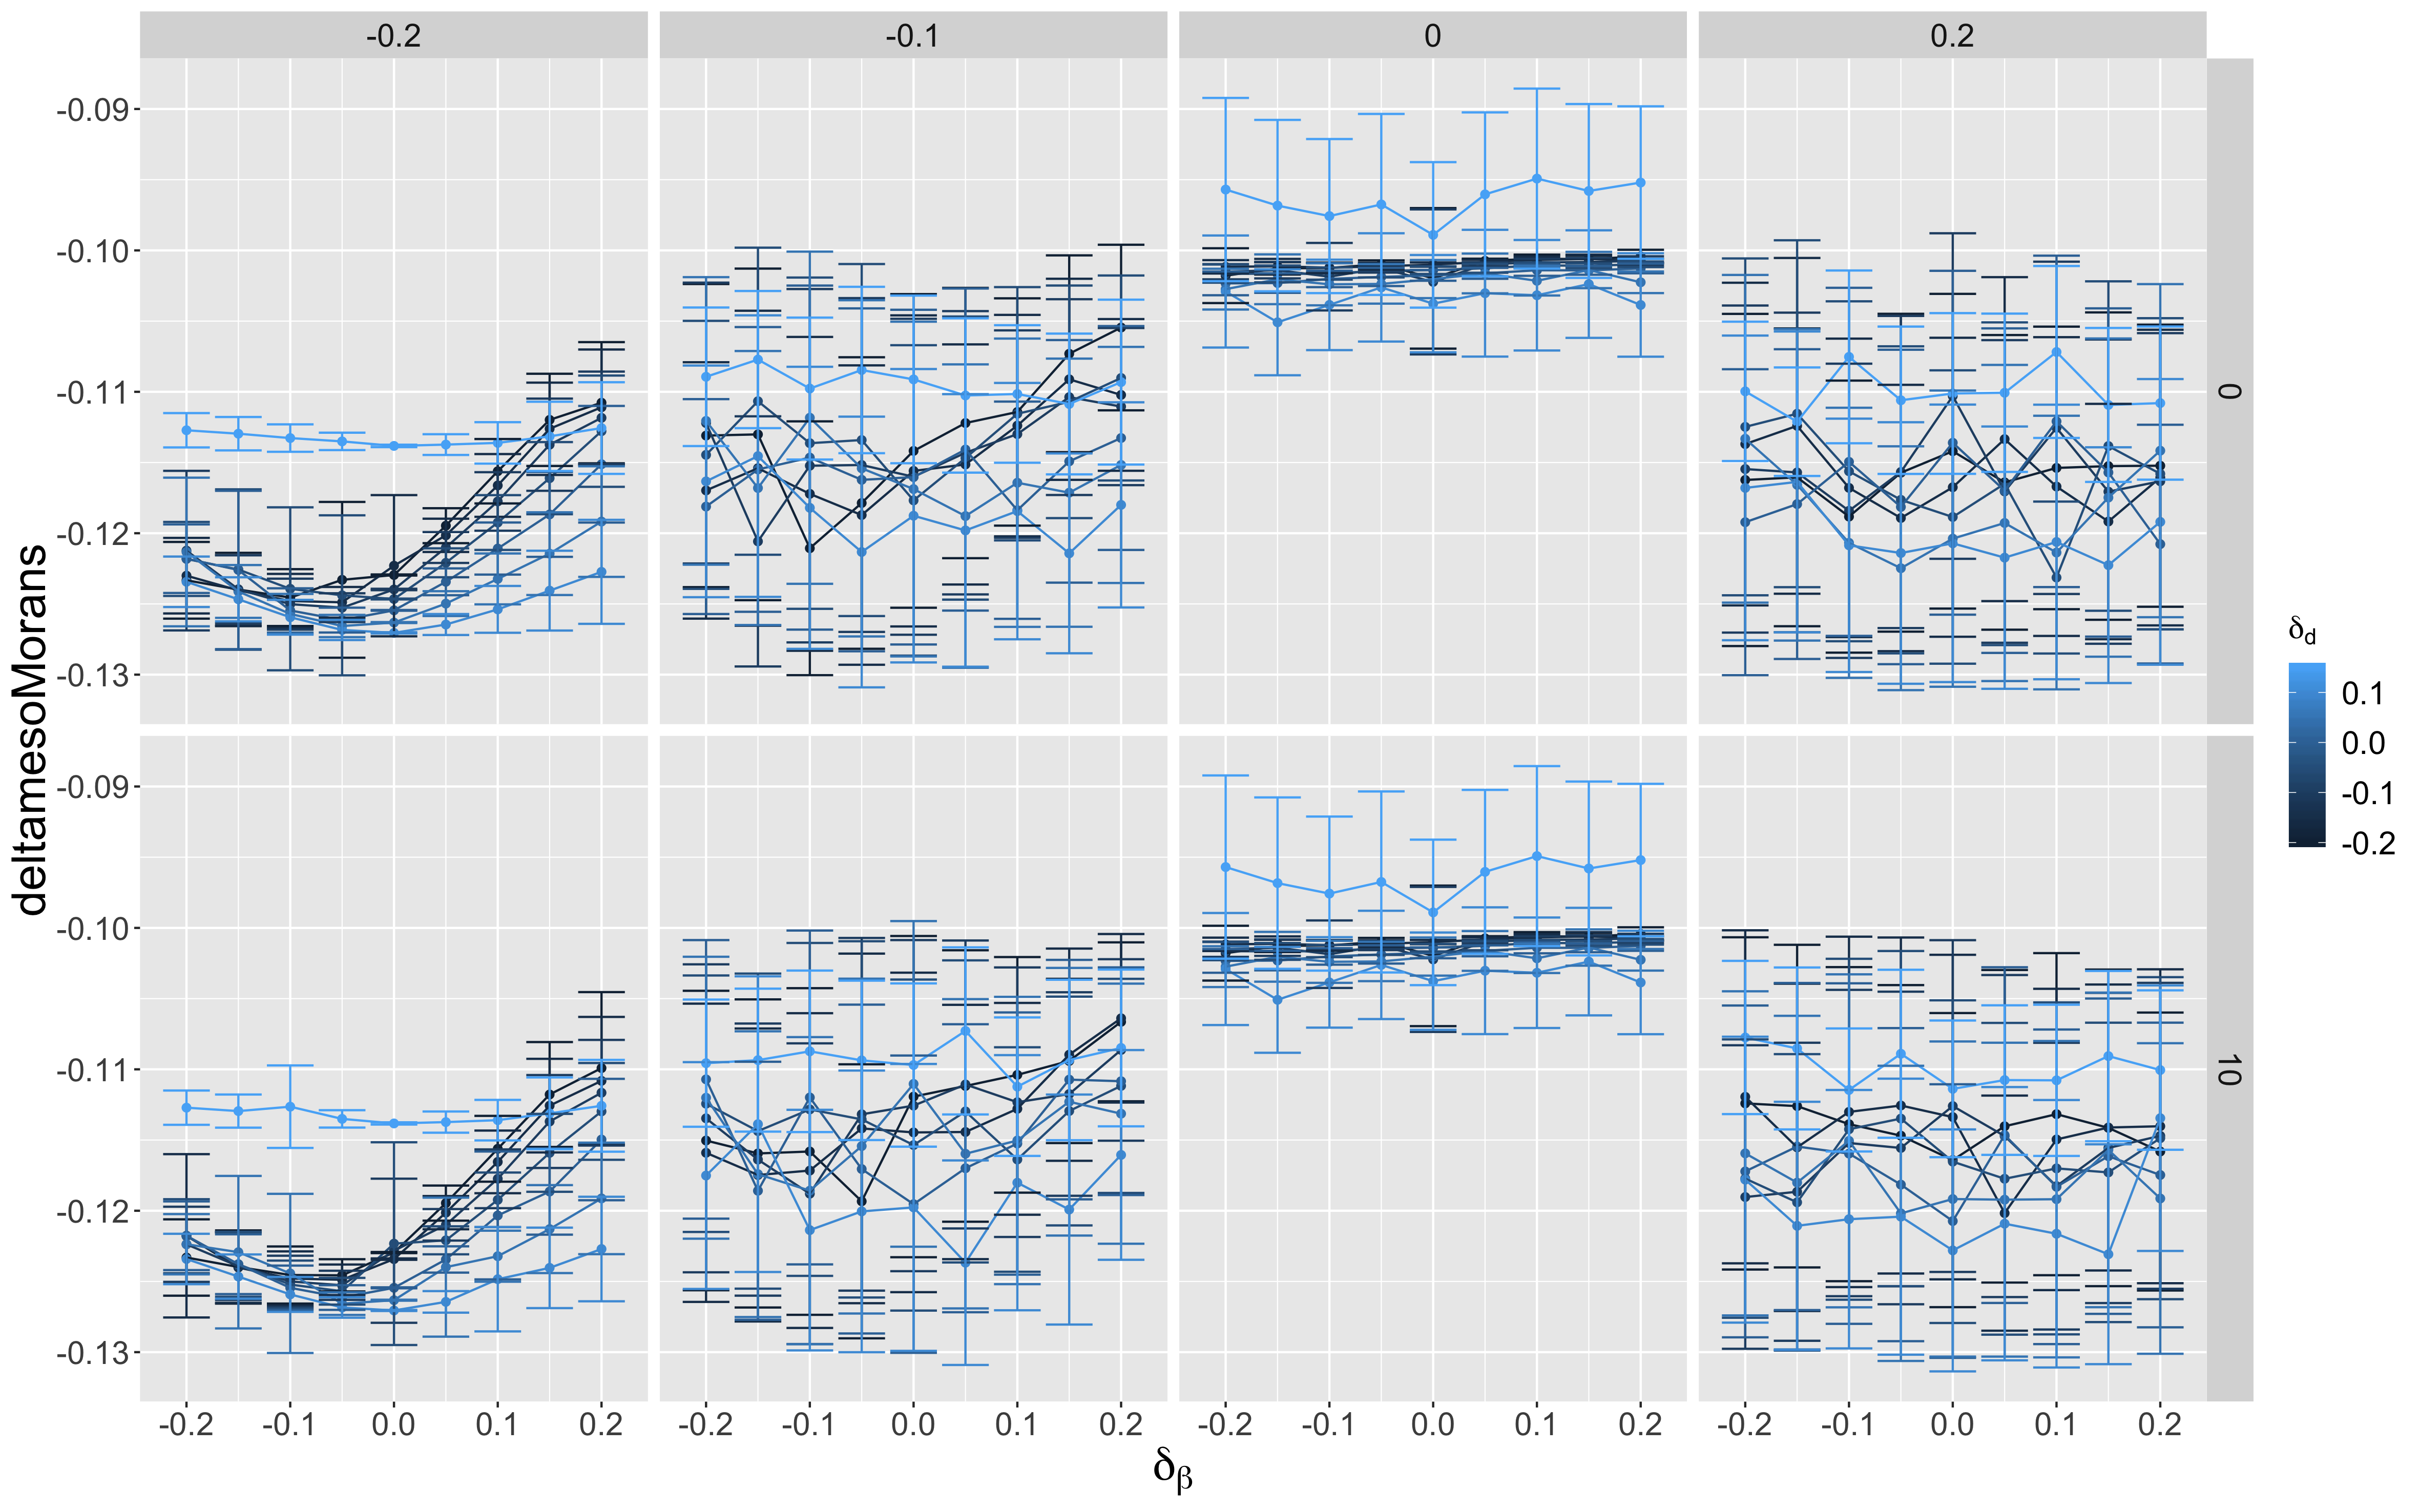
We then proceed to a targeted experiment by detailing more the grid for and . The aim is to investigate the influence of policies taken at the level of urban areas, but which can also be constrained by a higher level of governance. We show in Fig. 5 the influence of on urban form. In particular, the average variation of Moran index captures the centralisation of urban areas. This centralisation exhibits a minimal value when is low, consistent across values of . This implicates that when decentralisation policies are implemented by acting on aggregation (), the policy on urban sprawl will have an unexpected effect on centralisation. This is an illustration of complex and possibly negative interaction between policies.
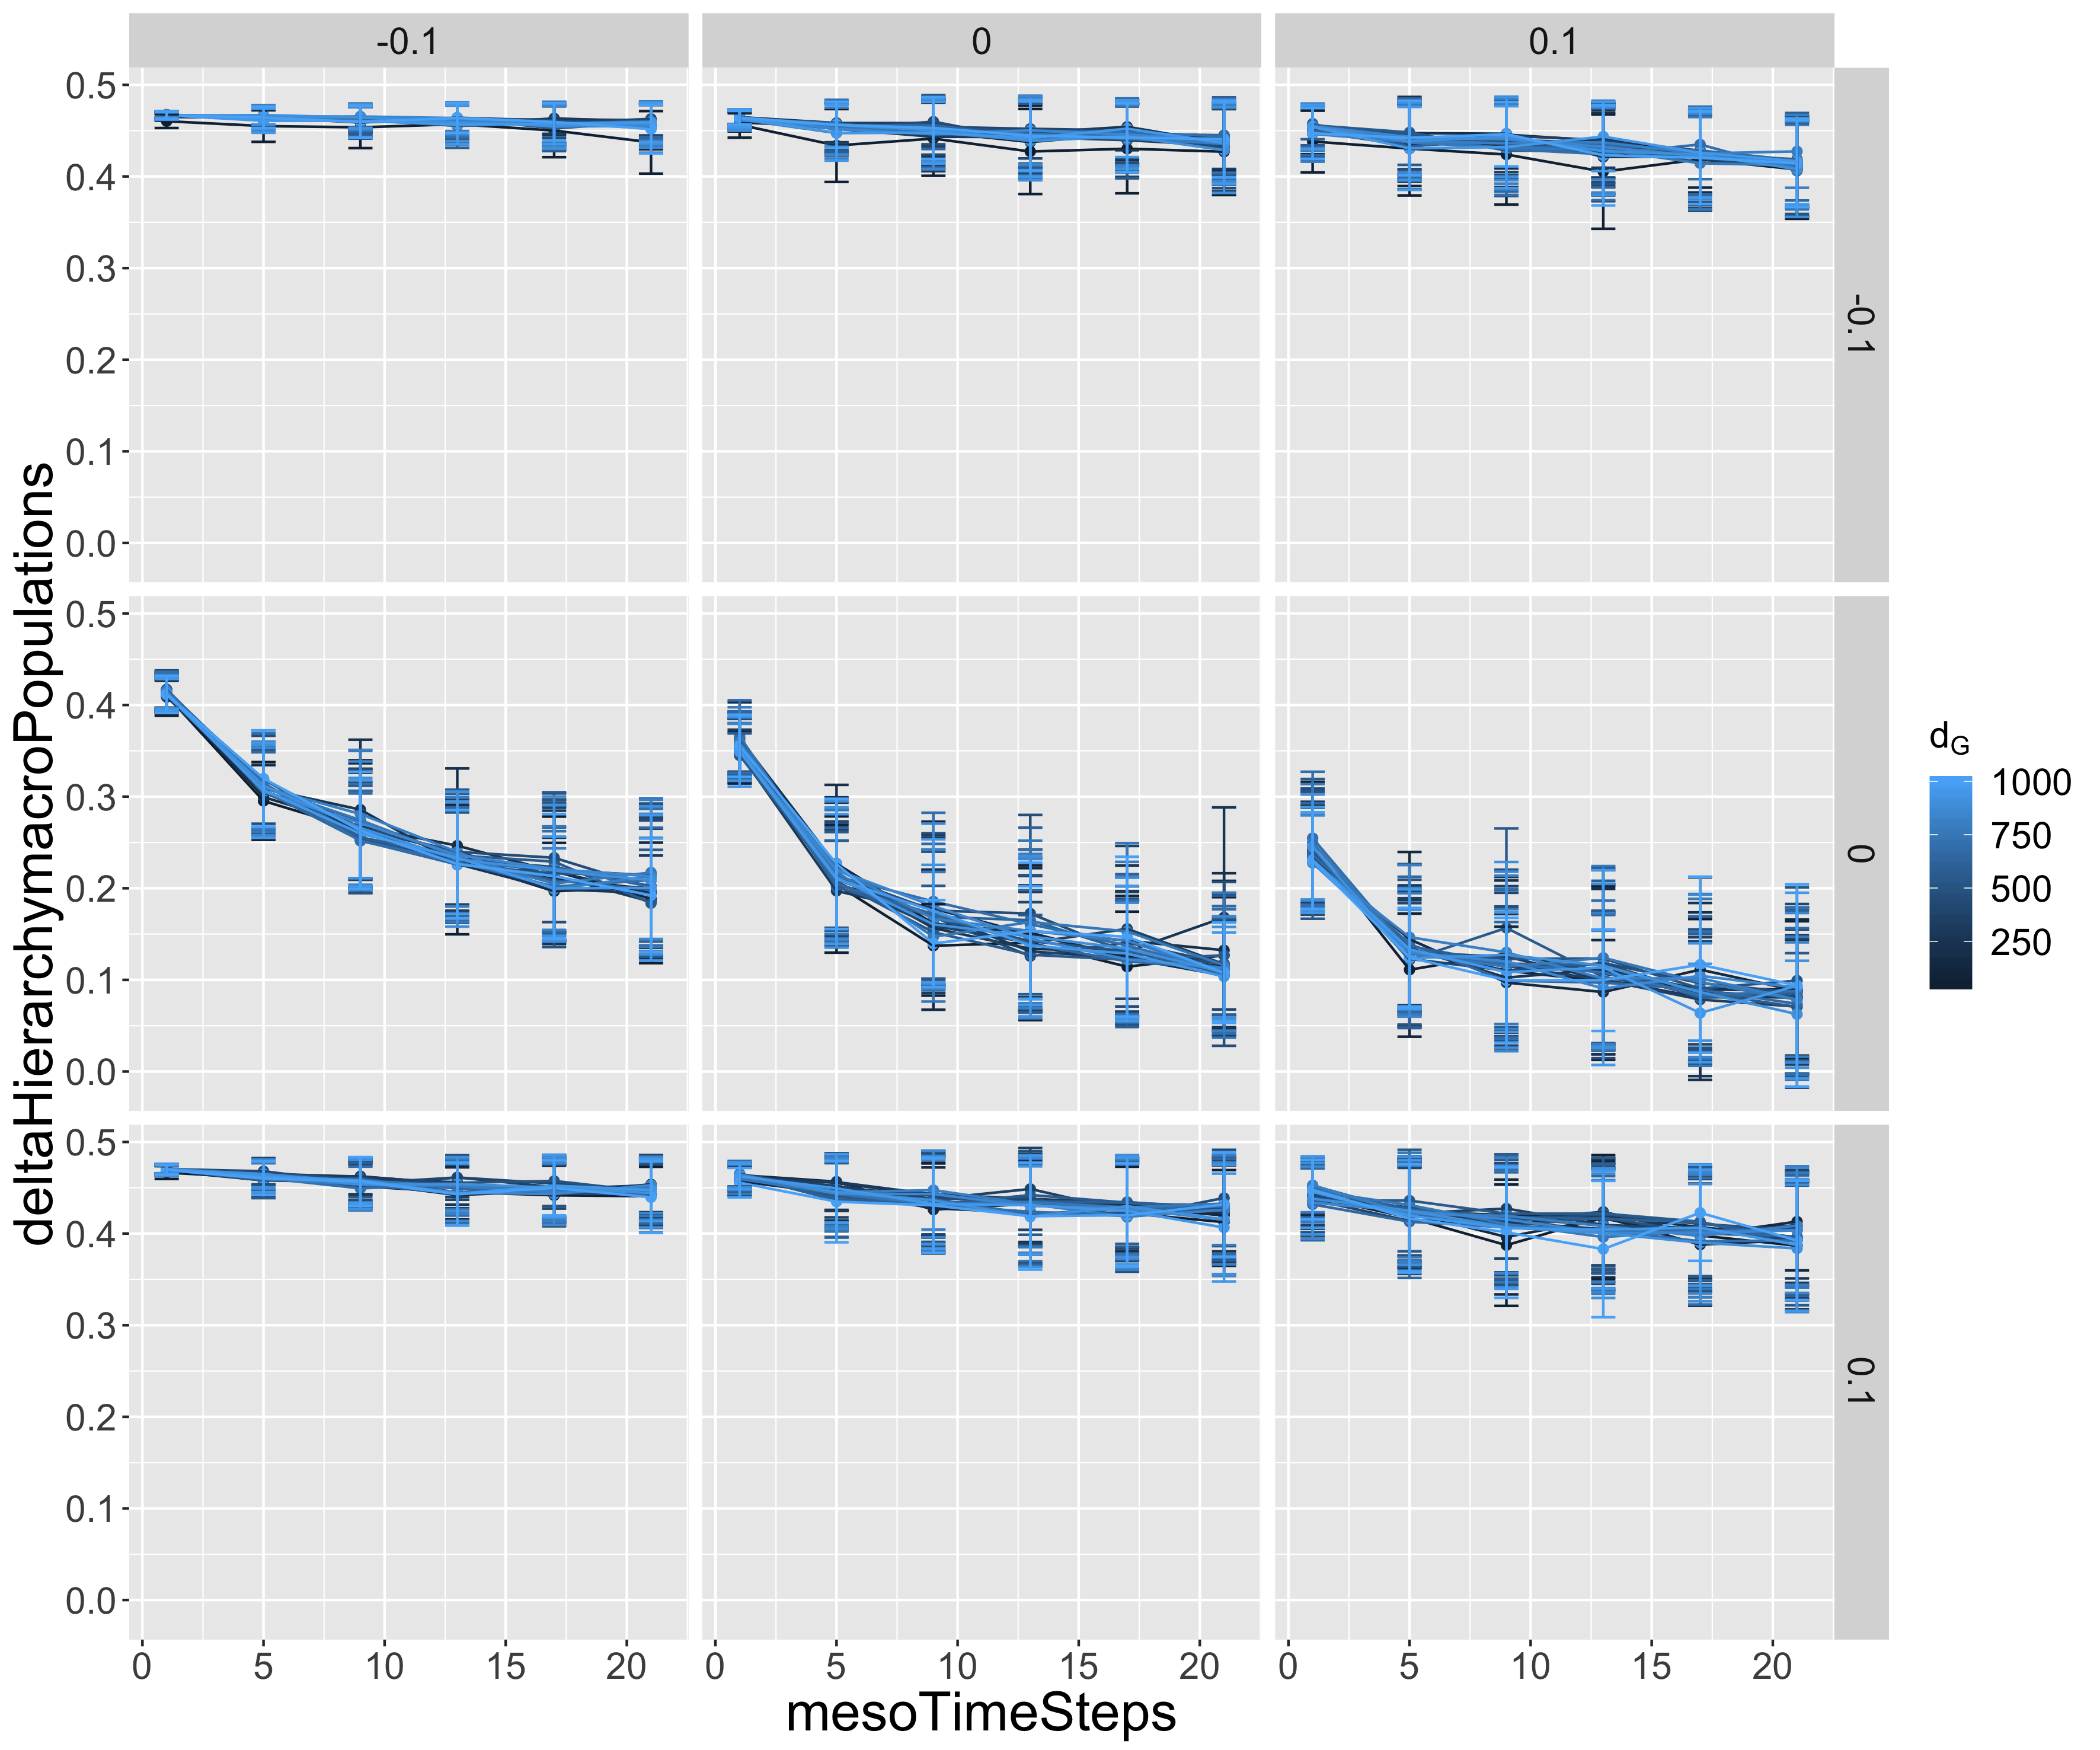
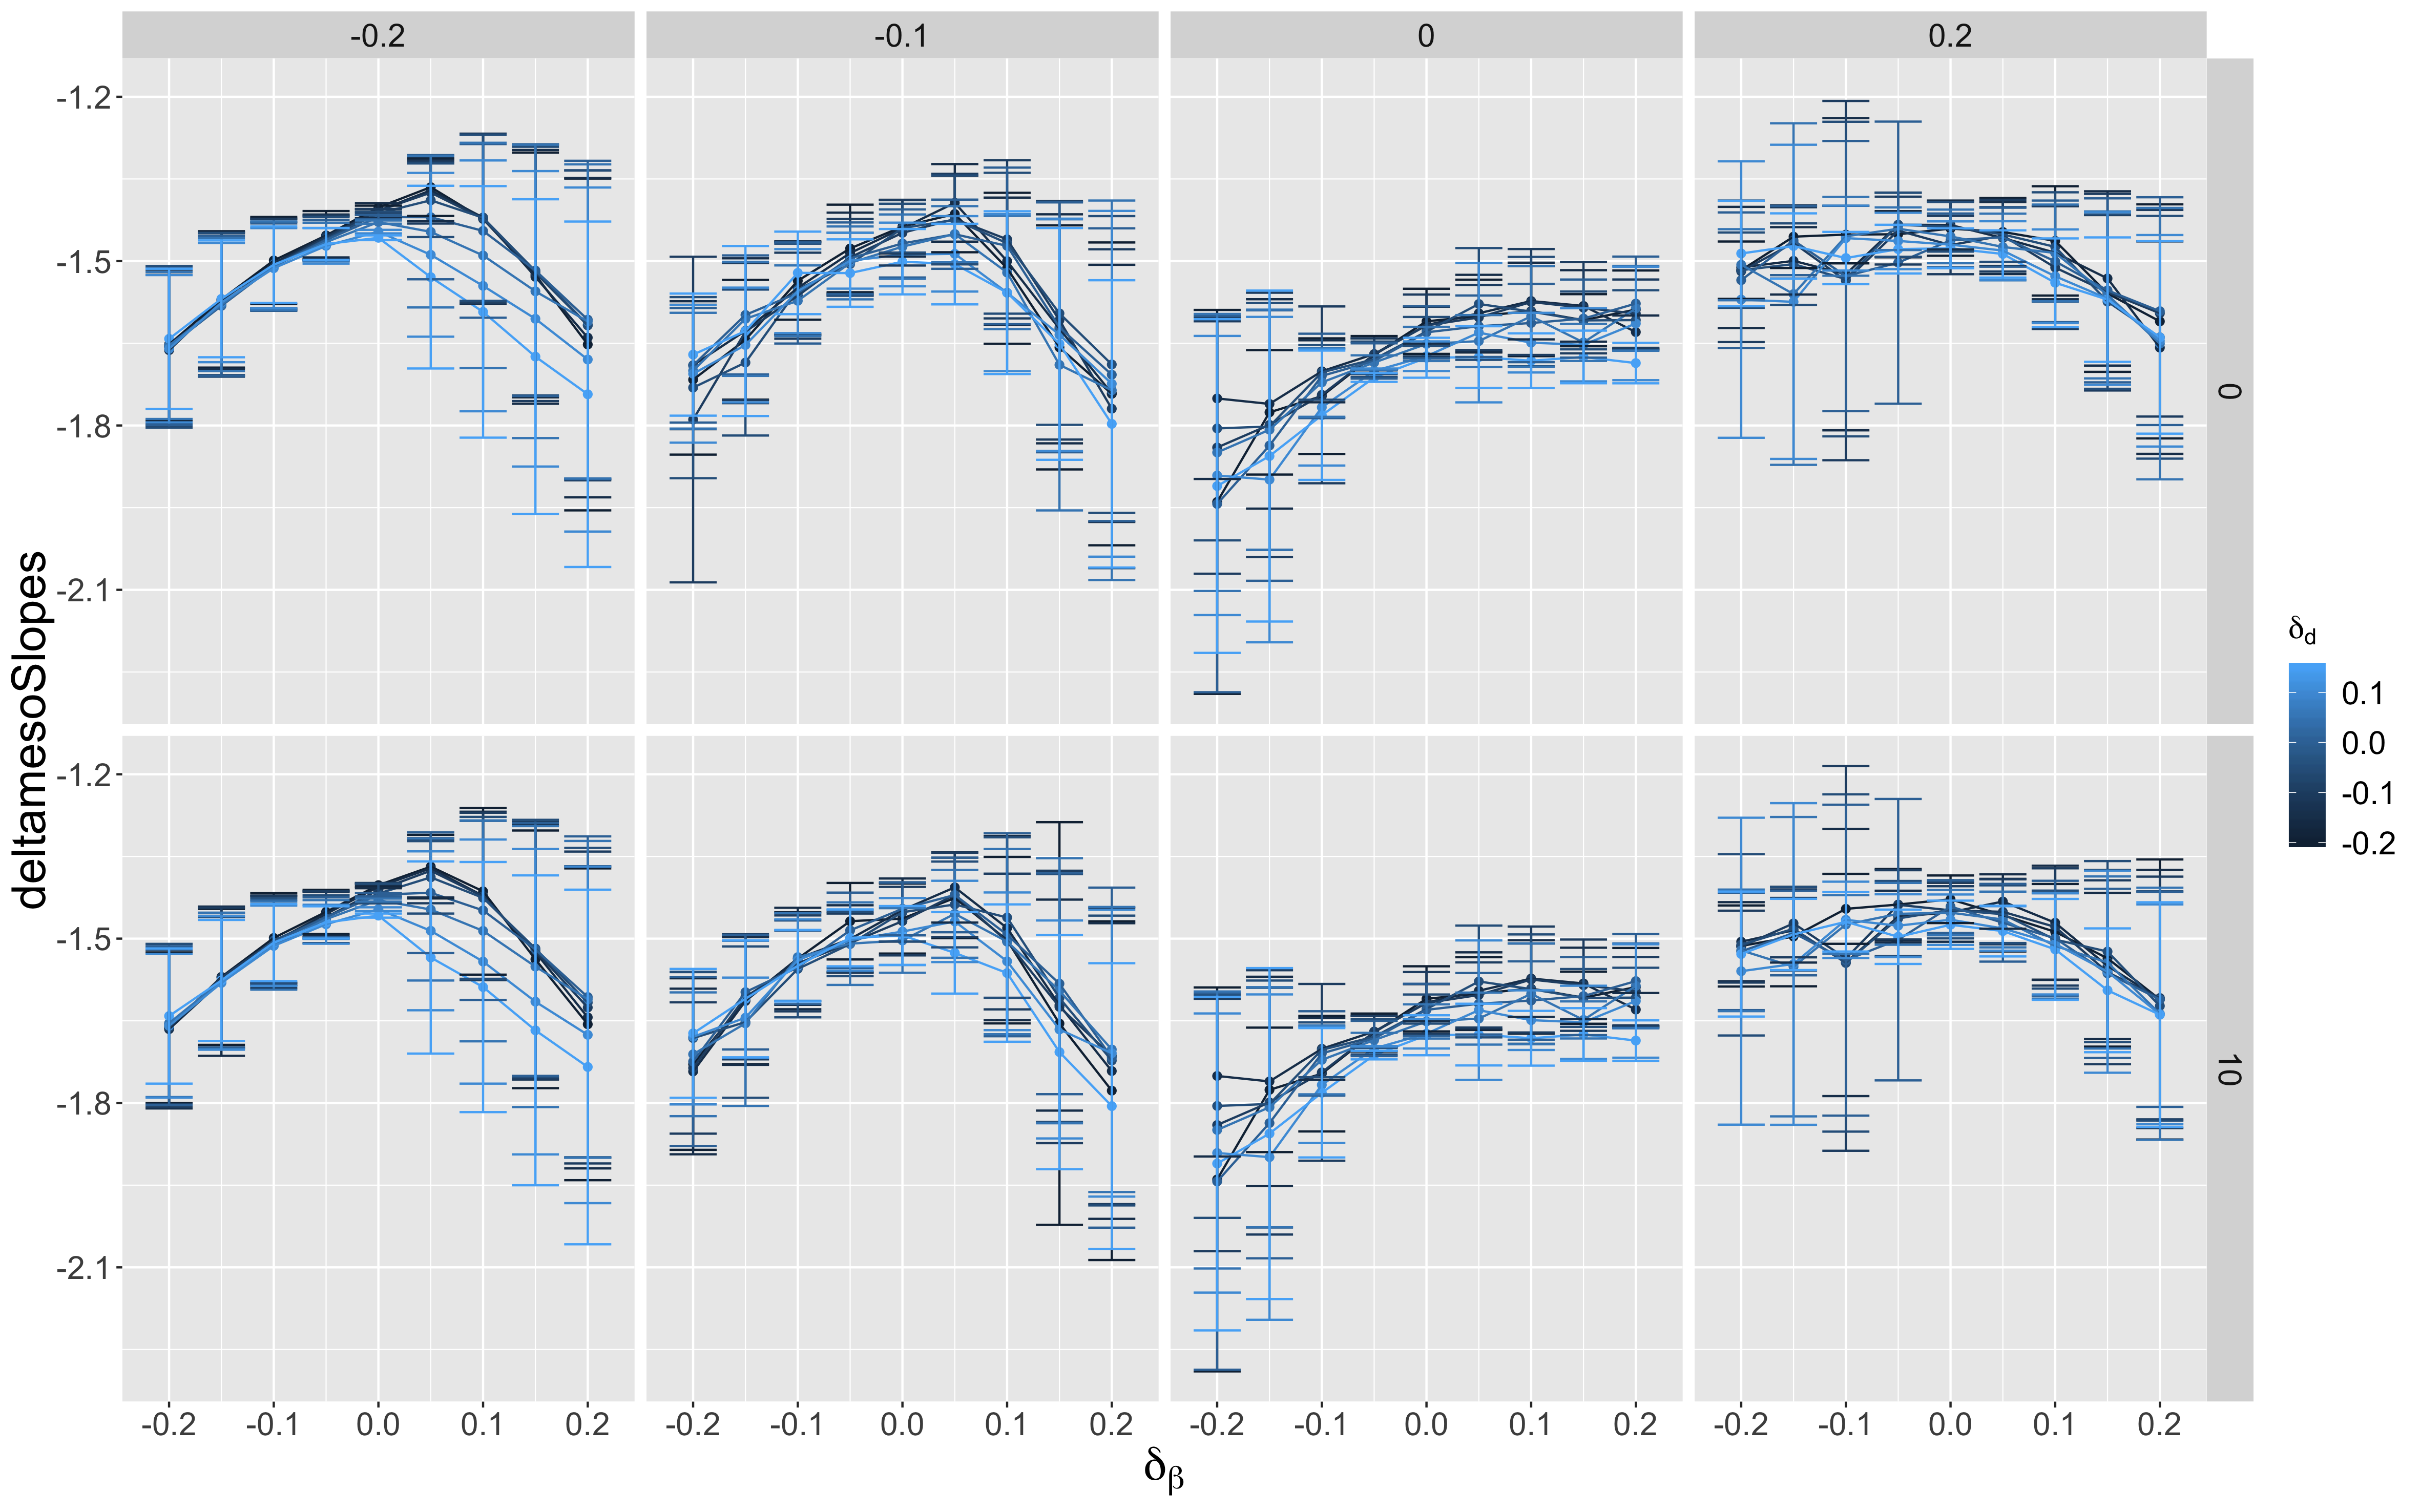
When investigating population hierarchy the mesoscopic scale, i.e. inequalities of population distribution within the urban area, we find in Fig. 6 a U-shaped behavior as a function of for negative values, but has a plateau for positive values of , showing also an interaction effect between policies. In terms of hierarchy, a maximal negative value may be wanted to limit inequalities (slopes are negative), and this optimum is reached for a slightly positive value of (left columns in Fig. 6). This means that sprawl may be needed in some configurations to optimise this objective.
3.5 Multiscale optimization
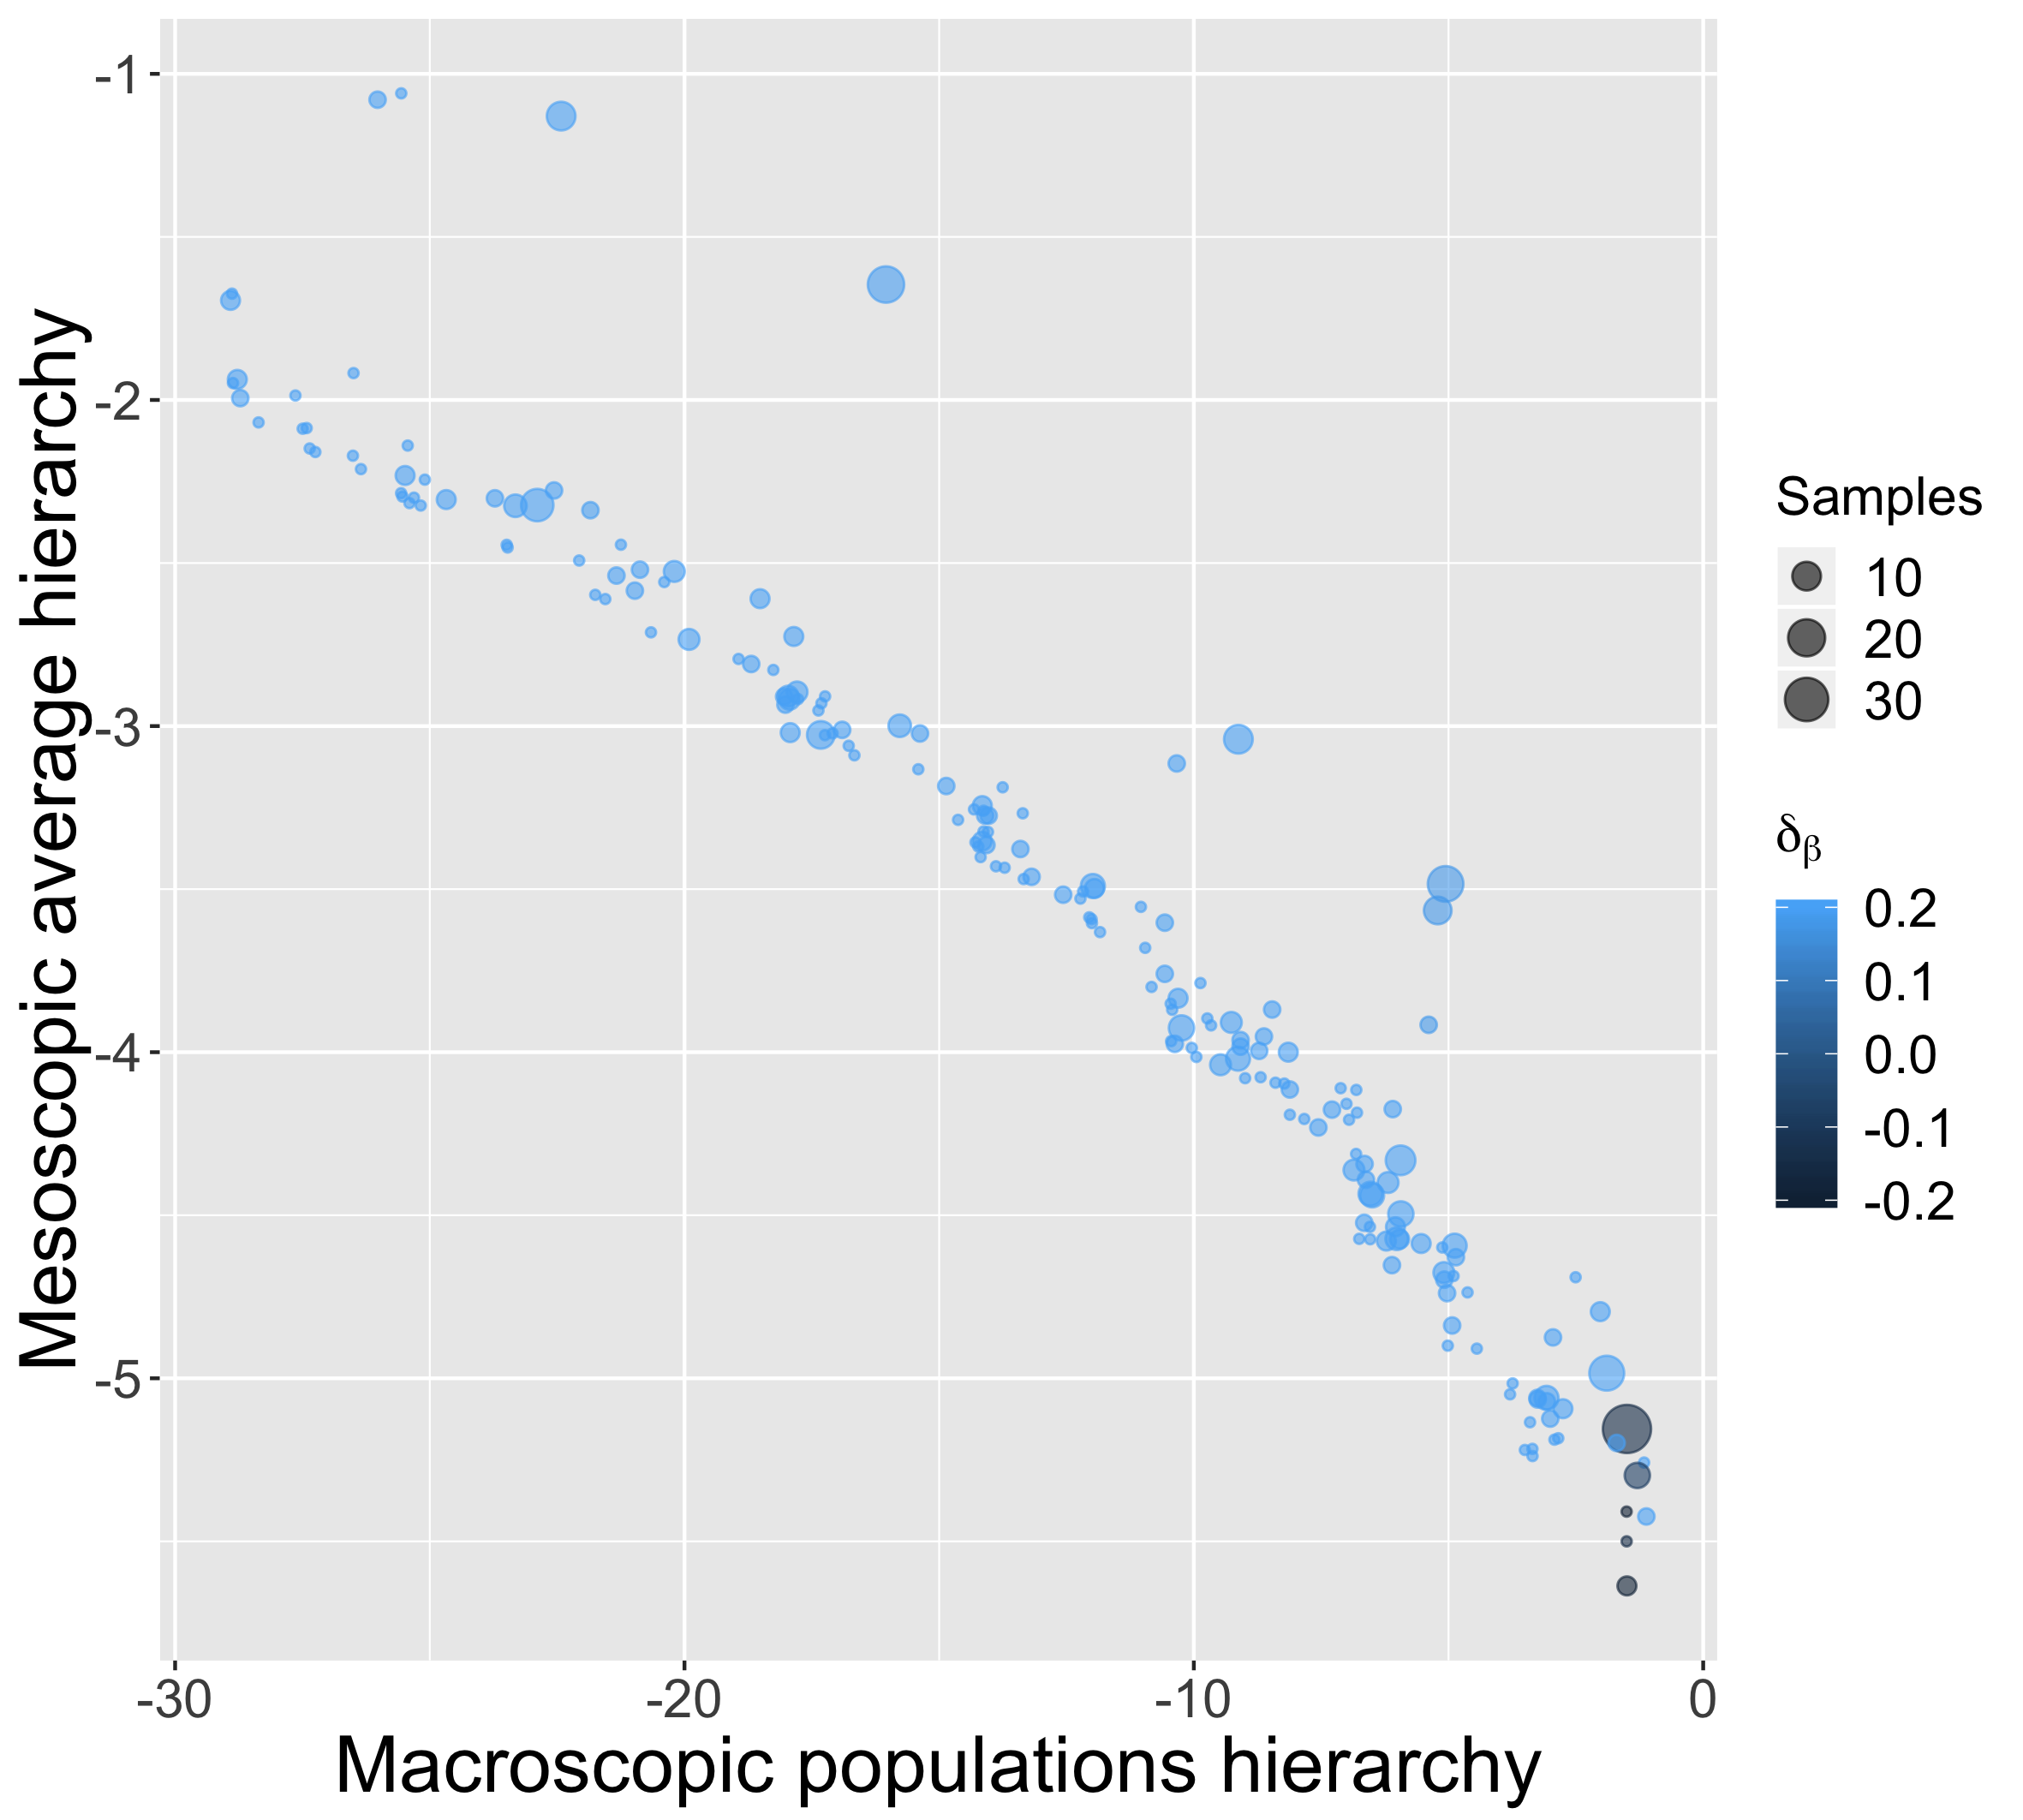
We finally turn to an optimization objective to investigate if compromises have to be made when targets are simultaneously aimed for at different scales. We therefore use a NSGA2 algorithm implemented in OpenMOLE, with a population of 200 individuals, run for 100,000 generations. Objectives are the average mesoscopic hierarchy which can be minimized for more compact and thus sustainable cities, at the macroscopic population hierarchy. Convergence is reached in terms of hypervolume and points in the Pareto front.
We show in Fig. 7 the Pareto front obtained after convergence of the algorithm. This confirms that the two objectives are indeed contradictory and that compromises between scales have to be made when trying to optimise both simultaneously. Most points correspond to policies favouring sprawl, at the exception of a small set of points with low macroscopic hierarchy values, which discourage sprawl (). Systems with the most equalities between cities within the system of cities correspond to the most hierarchical urban form, implying inequalities at the mesoscopic scales.
4 Discussion
4.1 Theoretical and practical implications
Our model effectively captures an interaction between downward and upward feedback. In that sense, it illustrates weak emergence in its proper sense [Bedau, 2002]. This suggests this view can be effectively operationalised into models of urban dynamics.
In terms of model complexity and in relation to urban complexity in itself, we show that coupling simple models (each having only three parameters) already yields a complicated and complex simulation model. It also requires additional ontologies to achieve the coupling (in our case the policy processes on one side and the congestion-performance process on the other side). Therefore, we suggest this is additional evidence for a necessity of complexity and simulation models to understand urban complexity. This implies in some way the failure of reductionist epistemologies, at least to grab the multi-scalar nature of urban systems.
Although a stylised and highly simplified model, we were already able to integrate parameters linked to policies. Indeed, governance processes are intrinsically multi-scalar [Liao and Gaudin, 2017]. Therefore, developing such models is a first step towards a progressive integration models for policy and sustainable management of territories.
4.2 Developments
This model is only a first structural sketch with very restrictive assumption, in particular regarding the downward and upward feedbacks on submodel parameters. There may be no link between urban form and global insertion, or it may be due to other processes, be expressed as an other functional form. An important stage before shifting to robust knowledge will consist in (i) reviewing and making a typology of such potential processes across scales; (ii) including most in a multi-modeling fashion to compare possible concurrent mechanisms.
Future work also implies the use of more elaborated model exploration and validation methods. For example, using the diversity search integrated in OpenMOLE [Reuillon et al., 2013] would allow unveiling the diversity of possible future urban trajectories, and possibly unexpected novel pathways towards sustainability, finding for example regimes with the strongest effect of feedback parameters on indicators related to sustainability.
Regarding an application of the model on real systems of cities, a calibration on empirical trajectories would be needed. However, such data is difficult to obtain, and some investigations should be made on the relevant calibration targets (in particular at which scale).
Our model is a first step towards multi-scalar models of urban dynamics which effectively include a strong coupling between processes at different scales. While remaining highly stylised, we showed an important role of the coupling and unveiled for example interaction effects between different types of policies. This type of approach will need in the future to be further developed, towards multi-scalar models for sustainable policy making [Rozenblat and Pumain, 2018]. This works paves the way for such more complex models.
Acknowledgments
The author acknowledges the funding of their institutions and the EPSRC project number EP/M023583/1. Results obtained in this paper were computed on the vo.complex-system.eu virtual organisation of the European Grid Infrastructure (http://www.egi.eu). We thank the European Grid Infrastructure and its supporting National Grid Initiatives (France-Grilles in particular) for providing the technical support and infrastructure.
References
- [Banos et al., 2015] Banos, A., Corson, N., Gaudou, B., Laperrière, V., and Coyrehourcq, S. R. (2015). The importance of being hybrid for spatial epidemic models: a multi-scale approach. Systems, 3(4):309–329.
- [Batty, 2005] Batty, M. (2005). Agents, cells, and cities: new representational models for simulating multiscale urban dynamics. Environment and Planning A, 37(8):1373–1394.
- [Batty, 2018] Batty, M. (2018). Inventing future cities. MIT press.
- [Bedau, 2002] Bedau, M. (2002). Downward causation and the autonomy of weak emergence. Principia: an international journal of epistemology, 6(1):5–50.
- [Belem and Müller, 2013] Belem, M. and Müller, J. P. (2013). An organizational model for multi-scale and multi-formalism simulation: Application in carbon dynamics simulation in west-african savanna. Simulation Modelling Practice and Theory, 32:83–98.
- [Boulet et al., 2020] Boulet, X., Zargayouna, M., Scemama, G., and Leurent, F. (2020). Coupling multi-agent and macroscopic simulators of traffic. In Agents and Multi-agent Systems: Technologies and Applications 2019, pages 323–332. Springer.
- [Chavalarias et al., 2009] Chavalarias, D., Bourgine, P., Perrier, E., Amblard, F., Arlabosse, F., Auger, P., Baillon, J.-B., Barreteau, O., Baudot, P., Bouchaud, E., et al. (2009). French roadmap for complex systems 2008-2009.
- [Cheng and Masser, 2003] Cheng, J. and Masser, I. (2003). Modelling urban growth patterns: a multiscale perspective. Environment and Planning A, 35(4):679–704.
- [Clarke et al., 2007] Clarke, K. C., Gazulis, N., Dietzel, C., and Goldstein, N. C. (2007). A decade of sleuthing: Lessons learned from applications of a cellular automaton land use change model. Classics in IJGIS: twenty years of the international journal of geographical information science and systems, pages 413–427.
- [Crociani et al., 2016] Crociani, L., Lämmel, G., and Vizzari, G. (2016). Multi-scale simulation for crowd management: a case study in an urban scenario. In International Conference on Autonomous Agents and Multiagent Systems, pages 147–162. Springer.
- [Favaro and Pumain, 2011] Favaro, J.-M. and Pumain, D. (2011). Gibrat revisited: An urban growth model incorporating spatial interaction and innovation cycles. Geographical Analysis, 43(3):261–286.
- [Ford et al., 2019] Ford, A., Barr, S., Dawson, R., Virgo, J., Batty, M., and Hall, J. (2019). A multi-scale urban integrated assessment framework for climate change studies: A flooding application. Computers, Environment and Urban Systems, 75:229–243.
- [Gabaix, 1999] Gabaix, X. (1999). Zipf’s law for cities: an explanation. Quarterly journal of Economics, pages 739–767.
- [Hjorth et al., 2020] Hjorth, A., Head, B., Brady, C., Wilensky, U., et al. (2020). Levelspace: A netlogo extension for multi-level agent-based modeling. Journal of Artificial Societies and Social Simulation, 23(1):1–4.
- [James et al., 2018] James, C., Azaele, S., Maritan, A., and Simini, F. (2018). Zipf’s and taylor’s laws. Physical Review E, 98(3):032408.
- [Joy and Vogel, 2015] Joy, M. and Vogel, R. K. (2015). Toronto’s governance crisis: A global city under pressure. Cities, 49:35–52.
- [Liao and Gaudin, 2017] Liao, L. and Gaudin, J.-P. (2017). L’ouverture au marché en chine (années 1980-2000) et le développement économique local: une forme de gouvernance multi-niveaux? Cybergeo: European Journal of Geography.
- [Murcio et al., 2015] Murcio, R., Morphet, R., Gershenson, C., and Batty, M. (2015). Urban transfer entropy across scales. PLoS One, 10(7):e0133780.
- [Pumain, 1997] Pumain, D. (1997). Pour une théorie évolutive des villes. Espace géographique, 26(2):119–134.
- [Pumain and Reuillon, 2017] Pumain, D. and Reuillon, R. (2017). Urban Dynamics and Simulation Models. Springer International.
- [Raimbault, 2018] Raimbault, J. (2018). Calibration of a density-based model of urban morphogenesis. PloS one, 13(9):e0203516.
- [Raimbault, 2019a] Raimbault, J. (2019a). Evolving accessibility landscapes: mutations of transportation networks in China. In Aveline-Dubach, N., editor, PATHWAYS OF SUSTAINABLE URBAN DEVELOPMENT ACROSS CHINA: THE CASES OF HANGZHOU, DATONG AND ZHUHAI, pages 89–108. Imago Editor. ebook.
- [Raimbault, 2019b] Raimbault, J. (2019b). Towards integrated urban models for sustainable policies. In Urban analytics at the interface between environment, human health and behaviour, Shanghai, China. Tongji University and The Alan Turing Institute.
- [Raimbault, 2019c] Raimbault, J. (2019c). Towards multi-scalar models for the co-evolution of transportation networks and territories. In Theo Quant 2019, Besançon, France. Université de Franche-Comté.
- [Raimbault, 2020a] Raimbault, J. (2020a). A comparison of simple models for urban morphogenesis. arXiv preprint arXiv:2008.13277.
- [Raimbault, 2020b] Raimbault, J. (2020b). Hierarchy and co-evolution processes in urban systems. arXiv preprint arXiv:2001.11989.
- [Raimbault, 2020c] Raimbault, J. (2020c). Indirect evidence of network effects in a system of cities. Environment and Planning B: Urban Analytics and City Science, 47(1):138–155.
- [Raimbault, 2020d] Raimbault, J. (2020d). Unveiling co-evolutionary patterns in systems of cities: a systematic exploration of the simpopnet model. In Theories and Models of Urbanization, pages 261–278. Springer.
- [Raimbault et al., 2020] Raimbault, J., Perret, J., and Reuillon, R. (2020). A scala library for spatial sensitivity analysis. arXiv preprint arXiv:2007.10667.
- [Reuillon et al., 2013] Reuillon, R., Leclaire, M., and Rey-Coyrehourcq, S. (2013). Openmole, a workflow engine specifically tailored for the distributed exploration of simulation models. Future Generation Computer Systems, 29(8):1981–1990.
- [Rozenblat and Pumain, 2018] Rozenblat, C. and Pumain, D. (2018). Toward a Methodology for Multi-scalar Urban System Policies, pages 385–393. Springer Singapore, Singapore.
- [Shu et al., 2020] Shu, B., Zhu, S., Qu, Y., Zhang, H., Li, X., and Carsjens, G. J. (2020). Modelling multi-regional urban growth with multilevel logistic cellular automata. Computers, Environment and Urban Systems, 80:101457.
- [Torrens and O’Sullivan, 2001] Torrens, P. M. and O’Sullivan, D. (2001). Cellular automata and urban simulation: where do we go from here?
- [Wegener and Fürst, 2004] Wegener, M. and Fürst, F. (2004). Land-use transport interaction: state of the art. Available at SSRN 1434678.
- [Wegener and Spiekermann, 2018] Wegener, M. and Spiekermann, K. (2018). Multi-level urban models: Integration across space, time and policies.
- [White, 2006] White, R. (2006). Modeling multi-scale processes in a cellular automata framework. In Complex artificial environments, pages 165–177. Springer.
- [Xu and Gao, 2019] Xu, T. and Gao, J. (2019). Directional multi-scale analysis and simulation of urban expansion in auckland, new zealand using logistic cellular automata. Computers, Environment and Urban Systems, 78:101390.
- [Xu et al., 2020] Xu, T., Gao, J., Coco, G., and Wang, S. (2020). Urban expansion in auckland, new zealand: a gis simulation via an intelligent self-adapting multiscale agent-based model. International Journal of Geographical Information Science, 34(11):2136–2159.
- [Yu et al., 2018] Yu, Y., He, J., Tang, W., and Li, C. (2018). Modeling urban collaborative growth dynamics using a multiscale simulation model for the wuhan urban agglomeration area, china. ISPRS International Journal of Geo-Information, 7(5):176.
- [Zhu and Tian, 2020] Zhu, J. and Tian, S. (2020). A dynamic urban lake area evolution model based on multilevel grid, cellular automata, and multiagent system. Complexity, 2020.