Dielectric response of BaTiO3 electronic states under AC fields via microsecond time-resolved X-ray absorption spectroscopy
Abstract
For the first time, the dielectric response of a BaTiO3 thin film under an AC electric field is investigated using microsecond time-resolved X-ray absorption spectroscopy at the Ti K-edge in order to clarify correlated contributions of each constituent atom on the electronic states. Intensities of the pre-edge peak and shoulder structure just below the main edge increase with an increase in the amplitude of the applied electric field, whereas that of the main peak decreases in an opposite manner. Based on the multiple scattering theory, the increase and decrease of the and main peaks are simulated for different Ti off-center displacements. Our results indicate that these spectral features reflect the inter- and intra-atomic hybridization of Ti 3 with O 2 and Ti 4, respectively. In contrast, the shoulder structure is not affected by changes in the Ti off-center displacement but is susceptible to the effect of the corner site Ba ions. This is the first experimental verification of electronic contribution of Ba to polarization reversal.
keywords:
Ferroelectricity , Electrical properties , Electronic structure , External electric field , X-ray absorption spectroscopy1 Introduction
Ferroelectric materials are widely used in various practical applications, including in multilayer ceramic capacitors, actuators, and memory cells, among others. However, to understand the dielectric response of these materials, it is essential to first understand the dynamic behavior of spontaneous polarization reversal under an electric field. Among ferroelectric materials, perovskite titanates (ATiO3; A=Pb, Ba, Sr, Ca) attract significant attention owing to the versatility of the functional solid solutions that are composed from them. In particular, a lack of space-inversion symmetry is a prerequisite for the occurrence of spontaneous polarization; therefore, previous related literature is primarily focused on the crystal structure. In the case of perovskite titanates, the off-center displacement of Ti ions in the TiO6 octahedra is a major cause of polarization. [1, 2, 3, 4, 5, 6] Various studies have been performed to study X-ray absorption of Ti K-edge for BaTiO3. [7, 8, 9, 10, 11]
Furthermore, it is obvious that also A-site cations significantly affect dielectric properties of ATiO3, including magnitude of polarization and Curie temperature. [12, 13, 14] Cohen was the first to theoretically demonstrate the existence of Pb 6 and O 2 hybridization in PbTiO3, [15] going beyond the hard-sphere model. This prediction was experimentally verified by Kuroiwa et al. via high-precision X-ray diffraction analysis, which revealed the electron density distribution between Pb and apical O. [16] Recently, Anspoks et al. reported the correlation effects of A-site ions in O and Ti based on the reverse Monte Carlo method applied to the extended X-ray absorption fine structure (EXAFS) data. [17]
Thus, it is quite evident that orbital hybridization between constituent atoms is closely linked to the dielectric properties of ATiO3. Hence, direct observation of the electronic states under the application of an electric field is an appropriate approach to investigate the dielectric properties of ferroelectric materials. We employed microsecond time-resolved (TR) X-ray absorption spectroscopy (XAS) because tiny changes in spectra are expected by the previous studies. [18, 19] The TR measurement is essential to exclude any undesired influences caused by a DC measurement such as Joule heating and fatigues. In this study, we selected BaTiO3 as the target material whose electronic states at the instant of polarization reversal were observed via microsecond TR-XAS measurements. XAS is an element-specific technique, which is sensitive to local bonding around absorbing atoms. Combined with the TR approach, XAS can be used for the investigation of the polarization reversal response of the atomic bonds in BaTiO3.
In particular, in this study, TR-XAS data of BaTiO3 at the Ti K-edge are used to investigate the response of the corresponding electronic states under an applied AC electric field. It was observed that intensities of the pre-edge peak and shoulder structure just below the main edge increase as the electric polarization increases, whereas that of the main peak decreases in an opposite manner. This observation indicates that in addition to Ti 3-O 2 hybridization, a correlated effect of Ba ions on Ti electronic states also contributes to polarization reversal in BaTiO3.
2 Experimental
An epitaxial BaTiO3(001) film with a thickness of 650 nm was prepared using pulsed laser deposition on a 0.5 mm thick (LaAlO3)0.3-(SrAl0.5Ta0.5O3)0.7(001) substrate along with a 100 nm thick SrRuO3(001) buffer layer, which also acted as the bottom electrode. A 50 nm thick Pt with a diameter of 100 was evaporated on the BaTiO3 film, which acted as the top electrode. Film growth was verified via X-ray diffraction as shown in Fig. 1. It was confirmed that all layers had a preferred (001) orientation normal to the surface of the film. In addition, the lattice constant, , of the BaTiO3 film calculated based on the (002) peak was 4.136 Å, which is longer than that of the standard powder ( = 4.018 Å). [12] This lattice mismatch between the BaTiO3 film and substrate induces a compressive strain. [20] The preferred orientation of -axis is also reported in thin films with SrTiO3 substrates where misfit strain is smaller than our sample. [21] This result guarantees that the influence of domain and the domain wall motion under electric fields are negligible in our case.

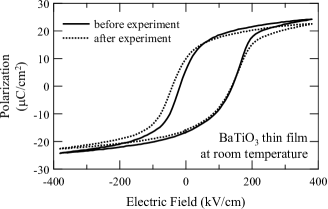
The ferroelectricity of the film was verified by measuring polarization-electric field (-) hysteresis using a ferroelectric tester (Toyo Corporation, FCE-fast) with a triangular electric field of 1 kHz; these results are shown in Fig. 2. The open loops indicate ferroelectricity of the film both before (solid) and after (dotted) TR-XAS measurements. These loops are shifted in the positive electric field direction indicating a preferred downward polarization. [22, 23] This imprint effect is due to the extrinsic interface effect, including the asymmetric properties of the top and bottom electrodes. [24] It should be noted that whereas the saturation polarization decreased, the magnitude of the negative coercive field increased after the TR-XAS measurements; these observations might be attributed to the fatigue effects caused by domain pinning and microcracking; [25] however, the dielectric properties of the sample remain even after experiments because hysteresis loop is closed as shown in Fig. 2, indicating low leakage current density. The currents at the maximum voltage before and after the TR-XAS measurements were 1.1 and 1.2 , respectively. The difference is below the experimental error, therefore it does not produce any detectable change in the TR-XAS data.
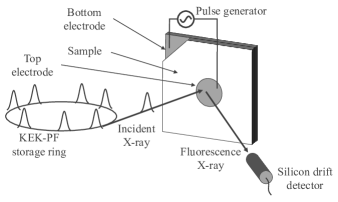
XAS experiments were performed on the beamline BL-15A1 equipment at the Photon Factory of the High Energy Research Organization (KEK-PF) using a Si (111) liquid-nitrogen cooled double-crystal monochromator. The X-ray beam was focused to 20 (H) 20 (V) at the sample, which ensured the inclusion of the entire beam on a top electrode. Ti K-edge spectra were recorded in partial fluorescence yield mode using a Si drift detector (SDD), as illustrated in the schematic diagram shown in Fig. 3. X-rays were incident on the top electrode of the film at an angle of 45∘ from the surface normal. Furthermore, the detected X-rays were converted to digital signals using a digital signal processor (DSP; Techno-AP, APU101) with the addition of a time stamp for each signal.
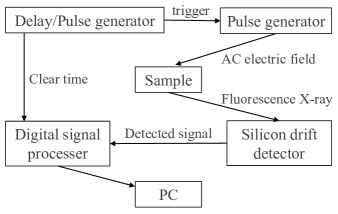
TR-XAS measurements were realized using the time-stamp information based on the step-scan method. Fig. 4 shows the block diagram of the signal processing system employed in this study. The internal time of the DSP was repeatedly reset to 0 every 3 ms using a clear pulse generated by a delayed pulse generator (SRS, DG645). In addition, the same clear pulse was also input into the wave generator as a trigger pulse to apply the electric field to the film. In particular, one cycle of the applied voltage consisted of a single triangular pulse (25 V, 1 kHz) and null voltage for 2 ms. Using this cycle, it was possible to assign a timing to the detected X-ray signals in response to the applied voltage, thereby enabling TR measurements. Several scans were summed to obtain the final Ti K-edge spectra with sufficient statistics. Because TR-XAS measurements require a long duration—e.g., 8 h for one spectral region— we focused on only three spectral features in our study, namely peak, shoulder structure, and main peak.
3 Results & Discussion
A non-TR Ti K-edge spectrum of the BaTiO3 thin film is shown in Fig. 5, along with that of standard BaTiO3 powder as a reference. The absorption profile above the sharp main peak at 4985 eV corresponds to the density of states of the unoccupied Ti 4 states, whereas small features in the pre-edge region (4965–4975 eV) represent the Ti 3 states. In the case of an octahedral symmetry, the five-fold degenerate 3 orbitals split into three-fold and two-fold degenerate states with and symmetries, respectively. A tiny hump at 4967 eV corresponds to the peak, whereas clear peaks at 4969 eV can be attributed to . The reason why peak intensity is very weak is mainly because it is forbidden in a dipole and is allowed in quadrupole approximation. In the K-edge spectra, the probability of the 1 to 3 transition is much lower than that of the dipole transition. This effect can be observed in other bulk materials. [26, 27] The intensity of the peak increases as the local distortion in the TiO6 octahedron increases, because the hybridization between the Ti-3 orbitals and O orbitals becomes more pronounced, resulting in a relatively large dipole component. It has been reported that the intensity of the peak is proportional to the mean-square displacement of a Ti ion from the center of the TiO6 octahedron. [26, 28]
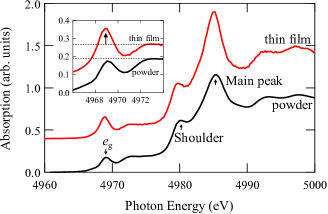
As shown in the inset of Fig. 5, the peak of the BaTiO3 thin film is larger than that of standard powder. In addition, the hump of the thin film almost flattens out. This observation can be attributed to the compressive strain resulting from the lattice mismatch between the BaTiO3 film and underlying substrate. Because the BaTiO3 film has a preferred orientation of the -axis with enhanced tetragonality, a distinct dielectric response can be expected.
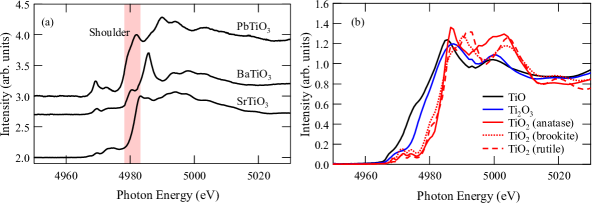
The shoulder structure at 4980 eV is a characteristic of BaTiO3. Though the electronic states responsible for this structure have not been identified yet, the shoulder structure indicates the contribution of the A-site ions in the ferroelectric perovskite ATiO3; the room-temperature spectra of commercial ATiO3 powders (A = Pb, Ba, and Sr) are shown in Fig. 6(a). XAS technique is sensitive to the symmetry and electronic states. As the electronic states differ according to the chemical composition, so do the absorption spectra. For example, the Ti-K edge spectra of TiO, Ti2O3, and TiO2 (anatase, rutile, and brookite) shown in Fig. 6(b) are different because their electronic states such as band structures are completely different.
In contrast to paraelectric SrTiO3 with the cubic symmetry for which no shoulder structure is observed in its spectra, ferroelectric BaTiO3 and PbTiO3 with the tetragonal symmetry do exhibit shoulder structures. Differences in near edge structure between BaTiO3 and PbTiO3 may be due to differences in the hybridization of Ti 4 states with the states of A-site ions (i.e., Ba 6 vs Pb 6). [29] Moreover, the intensity of these structures seems to depend on the degree of ferroelectricity; accordingly, PbTiO3 has a more prominent shoulder structure compared with BaTiO3.
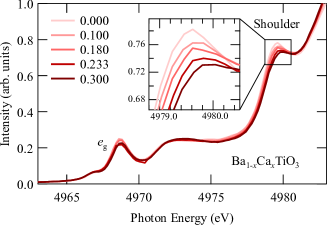
This trend can also be confirmed based on a series of Ti K-edge spectra of Ba1-xCaxTiO3 ( 0, 0.1, 0.18, 0.233, and 0.3), which are shown in Fig. 7. In particular, Ba1-xCaxTiO3 stays in the tetragonal phase within the considered range, and therefore, ferroelectricity remains stable. [30, 31] As can be seen in Fig. 7, the intensity of the shoulder structure decreases monotonically with increasing , i.e., decreasing Ba concentration. Similar results have been reported for BaTi1-xZrxO3. [32, 33] Likewise, the intensity of the shoulder structure decreases with an increase in , i.e., decrease in the Ti content. From these results, it can be concluded that the intensity of the shoulder structure in the BaTiO3 spectra reflects the electronic hybridization between Ti and Ba. This seemingly implausible claim has a theoretical background proposed by Ghosez et al. based on the Born effective charges of each constituent atom. [34]
As discussed above, because the peak and shoulder structure directly reflect the ferroelectricity of perovskite titanates, we focused on these structures as well as the main peak in our TR experiments. The time variation of the applied electric field () for one cycle is shown in Fig. 9(d); a symmetric positive-and-negative triangular field for 1 ms and a field-free duration time for 1 ms were applied in sequence. The time variation of the triangular pulse corresponds to 1 kHz, which is the same frequency as that used for the hysteresis measurements. It should be noted that the field-free region is included to prevent Joule heating as well as to provide the field-free condition. In addition, we utilized not static but AC electric field to eliminate any undesired influence from fatigue, which ensures that the relative change in a short time frame is detectable. We have not observed any measurable drift of the observed values upon time.
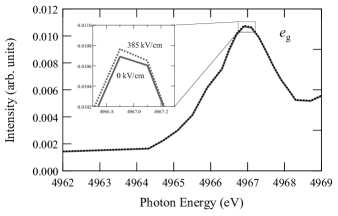
The maximum variation of spectra with electric fields is shown in Fig. 8. The increase of peak intensity is 0.6 % and the peak shifts are not observed. These tiny changes are due to a small distortion caused by electric fields. [19, 18] The unchanged Ti oxidation state before and after experiments is verified by seeing peak positions in XAS spectra. If the valence number of Ti or its local structure changes, the chemical shifts will occur as it is seen in spectra of TiO, Ti2O3, and TiO2, which are presented in Fig. 6(b). In our case, we did not observe any changes in the peak positions with and without electric fields. Then, we focus on the time variation of intensities.
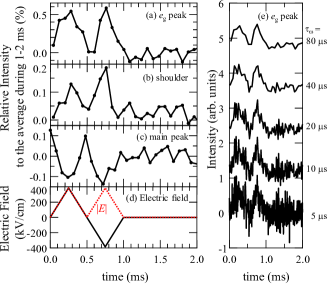
The time variation of the area-integrated intensities of the peak, shoulder structure, and main peak are presented in Fig. 9(a), (b), and (c), respectively. The integration area is set to 1 eV around the local maxima of each spectral feature, and the integrated intensity is normalized to unity by the average intensity around an applied field of 0 V for 1–2 ms. The width of the time window () for each plot is 80 . The signal to noise ratio of intensities can be estimated in the region from 1–2 ms. Intensities in this region should be constant but there is still noise left.
It is obvious that the intensities of the peak and shoulder structure are synchronized with the magnitude of the applied electric field beyond the noise level of 0.05%. Intensities of both features increase as the magnitude of the applied field increases. The interaction of X-rays with the electronic states of BaTiO3 is dependent not on the polarity of the electric polarization but on the magnitude of polarization; therefore, one-half period of the applied field was observed. This result confirms that not only the peak but also the shoulder structure is associated with the ferroelectricity of BaTiO3. In contrast, the intensity of the main peak changes in the opposite manner, i.e., its intensity decreases with increasing . A naive interpretation of this opposite trend is the broadening of the 4 electronic states because of the reduction in the coordination symmetry of the Ti ion under the applied electric field.
To better understand the time variation of the spectral features, we studied the data presented in Fig. 9(e). In particular, this figure illustrates the time variation of the -peak intensity for various . Because we detect all SDD signals using the time stamp information, it is possible to change the to any period longer than the minimum interval of the DSP-processed signals, which is typically around 0.1 and depends on the setting of the instrument. The time variation of the -peak intensity is evident at any , even though the noise level increases as the becomes smaller. In general, the response of the electronic states to the applied electric field is instantaneous; therefore, time variation of the spectral features shows the same trend regardless of .
To provide a theoretical background for the interpretation of the observed spectral features, the experimental spectra were compared with the simulated spectra obtained using the FEFF 9.6 program, which is based on the multiple scattering theory. [35] The simulation results are shown in Fig. 10, wherein the Ti off-center displacement () was varied from =0 (body-center) to 0.04 in atomic units. It was assumed that larger displacements would make the spectral changes clear. As already discussed in the literature, [26] the intensity of the peak increases with increasing , which reflects the enhanced Ti 3 -O 2 hybridization. In contrast, the intensity of the main peak decreases in an opposite manner. The simulated results suggest that not only the effect of broadening the Ti 4 states but also the compensation for the number of unoccupied states would be a plausible reason for the observed spectral features.
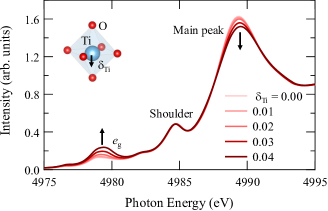
In contrast to the abovementioned two features, the shoulder structure is less sensitive to the Ti off-center displacements, which clearly indicates a different physical origin for the shoulder structure. As previously mentioned, the shoulder structure was attributed to the A-site contribution in Ti as per several experimental results. One possible explanation for the A-site contribution is the Born effective charge. The Born effective charge tensor, , of an atom can be linked to the change of polarization induced by the periodic displacement along the direction induced on the atom by an external field : , where is a unit cell volume. [34, 36] For the simplest case, if we consider a single dipole model, the Born effective charge can be expressed by a static charge by using an interatomic distance as . If changes rapidly with , the difference between and becomes large. Ghosez et al. concluded that and , the Born effective charge of Ba and Ti, respectively, along the ferroelectric polarization , are comparable to the charge transfer between Ti and apical O along the polarization direction. Therefore, it can be stated that orbital hybridization is not restricted to Ti and O but also involves Ba, or at least, that Ba also plays an important role in the formation of the valence band.
The Born effective charge makes a major contribution to the formation of the shoulder structure; the term is essential for the covalent character of the Ti-O bond. This term would be insensitive to the static Ti off-center displacement, as shown in the simulation in Fig. 10. Under the application of an AC electric field, not only Ti ions but also Ba ions are perturbed leading to the non-negligible enhancement of as compared to the static environment. The intensity of the shoulder structure increases in phase with that of the peak under the application of the AC field (Fig. 9). Thus, it can be speculated that the charge transfer from the Ti 4 state to the Ba unoccupied state, e.g. the 5 state, occurs as well as the charge transfer from the Ti 3 state to the O 2 state, as concluded from the peak. [26] The shoulder structure of the Ti K-edge spectrum of BaTiO3 provides an electronic point of view for the dynamic piezoelectric effect of BaTiO3.
Furthermore, though the A-site contribution to the ferroelectric properties of ATiO3 has been observed and studied in many previous works, the polarization response under applied AC electric fields using XAS measurements provides a new insight into this, especially in terms of energetics of electronic hybridization. In this light, Ba K-edge EXAFS would provide more advanced information on the A-site contribution to the ferroelectric property of ATiO3; therefore, another TR-XAS experimental study using BaTiO3 under applied electric fields is currently in progress.
4 Conclusions
For the first time, Ti K-edge XAS measurements for a BaTiO3 thin film were performed under the application of a triangular electric field in the TR mode. This technique enables us to detect tiny changes in spectra and observe electronic states under electric fields. Three characteristic features were studied, namely the pre-edge peak, shoulder structure, and main peak. Among these three features, the responses of the first two to the electric field were in phase, whereas that of the latter was antiphase. Using model simulations, it was confirmed that Ti off-center displacements affect the increase in the -peak intensity and decrease in the main peak intensity. However, it was observed that the shoulder structure was not influenced by the Ti off-center displacement. Nevertheless, it showed a dielectric response to the AC electric field that can be consistently explained from the perspective of the Born effective charge. Thus, the Ba contribution to the ferroelectric property of BaTiO3 via electronic hybridization is concluded experimentally using the novel TR-XAS technique. The TR-XAS technique’s utilization of the full time stamp information of the DSP is versatile for many applications; therefore, it provides a new approach for the study of the dynamical behavior of electronic states.
Acknowledgements
This research was performed under the approval of the Photon Factory Program Advisory Committee (PF-PAC; Contract Numbers 2015G580, 2017G587, and 2019G614) and was financially supported by JSPS KAKENHI Grant Numbers 18H01153, 19H02426, and 18K19126. The experiment for measuring spectra in Fig. 6(b) was performed on beamline BM26A (proposal MA 2731) at the European Synchrotron Radiation Facility (ESRF), Grenoble, France. We are grateful to Local Contact at the ESRF for providing assistance in using beamline BM26A. Institute of Solid State Physics, University of Latvia as the Center of Excellence has received funding from the European Union’s Horizon 2020 Framework Programme H2020-WIDESPREAD-01-2016-2017-TeamingPhase2 under grant agreement No. 739508, project CAMART2.
References
- Devonshire [1949] A. Devonshire, Xcvi. theory of barium titanate, The London, Edinburgh, and Dublin Philosophical Magazine and Journal of Science 40 (1949) 1040–1063. URL: https://doi.org/10.1080/14786444908561372. doi:10.1080/14786444908561372.
- Deguchi et al. [2008] M. Deguchi, N. Nakajima, K. Kawakami, N. Ishimatsu, H. Maruyama, C. Moriyoshi, Y. Kuroiwa, S. Nozawa, K. Ishiji, T. Iwazumi, Luminescence mechanism of (pr, al)-doped srtio3 fine particles investigated by x-ray absorption spectroscopy, Phys. Rev. B 78 (2008) 073103. URL: https://link.aps.org/doi/10.1103/PhysRevB.78.073103. doi:10.1103/PhysRevB.78.073103.
- Nakajima et al. [2010] N. Nakajima, M. Deguchi, H. Maruyama, K. Ishiji, Y. Tezuka, X-ray spectroscopic study on photoluminescence properties of red phosphor SrTiO3:pr3+,al, Japanese Journal of Applied Physics 49 (2010) 09ME04. URL: https://doi.org/10.1143%2Fjjap.49.09me04. doi:10.1143/jjap.49.09me04.
- Kawakami et al. [2013] S. Kawakami, N. Nakajima, T. Takigawa, M. Nakatake, H. Maruyama, Y. Tezuka, T. Iwazumi, Uv-induced change in the electronic structure of srtio3 at low temperature probed by resonant x-ray emission spectroscopy, Journal of the Physical Society of Japan 82 (2013) 053701. URL: https://doi.org/10.7566/JPSJ.82.053701. doi:10.7566/JPSJ.82.053701.
- Kawakami et al. [2015] S. Kawakami, N. Nakajima, M. Nakatake, N. Kawamura, M. Mizumaki, H. Maruyama, Mechanism of intrinsic dipole moment induction in quantum paraelectric SrTiO3, Japanese Journal of Applied Physics 54 (2015) 10NC03. URL: https://doi.org/10.7567%2Fjjap.54.10nc03. doi:10.7567/jjap.54.10nc03.
- Lu et al. [2017] C. Lu, C. Temba, N. Nakajima, S. Kawakami, N. Ishimatsu, H. Maruyama, Isotropic shrinkage of the oxygen octahedron in SrTiO3under uniaxial pressure, Journal of Physics: Condensed Matter 29 (2017) 395502. URL: https://doi.org/10.1088%2F1361-648x%2Faa7ec6. doi:10.1088/1361-648x/aa7ec6.
- Ravel and Stern [1995] B. Ravel, E. Stern, Local disorder and near edge structure in titanate perovskites, Physica B: Condensed Matter 208-209 (1995) 316 – 318. URL: http://www.sciencedirect.com/science/article/pii/092145269400686P. doi:https://doi.org/10.1016/0921-4526(94)00686-P, proceedings of the 8th International Conference on X-ray Absorption Fine Structure.
- Ravel et al. [1998] B. Ravel, E. A. Stern, R. I. Vedrinskii, V. Kraizman, Local structure and the phase transitions of batio3, Ferroelectrics 206 (1998) 407–430. URL: https://doi.org/10.1080/00150199808009173. doi:10.1080/00150199808009173.
- Bootchanont et al. [2014] A. Bootchanont, J. Jutimoosik, S. Chandarak, M. Unruan, P. Kidkhunthod, W. Klysubun, S. Rujirawat, R. Yimnirun, R. Guo, A. Bhalla, Synchrotron x-ray absorption spectroscopy study of local structure transformation behavior in perovskite ba(ti,zr)o3 system, Journal of Alloys and Compounds 616 (2014) 430–435. doi:10.1016/j.jallcom.2014.07.175.
- Phaktapha et al. [2017] P. Phaktapha, J. Jutimoosik, A. Bootchanont, P. Kidkhunthod, S. Rujirawat, R. Yimnirun, Temperature dependent local structure in batio3 single crystal, Integrated Ferroelectrics 177 (2017) 74–78. URL: https://doi.org/10.1080/10584587.2017.1285183. doi:10.1080/10584587.2017.1285183.
- Yoshiasa et al. [2018] A. Yoshiasa, G. Kitahara, T. Tobase, T. Hiratoko, H. Hongu, T. Nakatani, K.-i. Murai, Determination of feffo- and antiferroelectricity using the temperature dependence of the pre-edge features in the xanes spectra: Xanes study of tetragonal and cubic atio3 (a = sr, ba, and pb) and pbzro3, physica status solidi (b) 255 (2018) 1800050. URL: https://onlinelibrary.wiley.com/doi/abs/10.1002/pssb.201800050. doi:10.1002/pssb.201800050.
- Buttner and Maslen [1992] R. H. Buttner, E. N. Maslen, Structural parameters and electron difference density in batio3, Acta Crystallographica Section B 48 (1992) 764–769. URL: https://doi.org/10.1107/S010876819200510X. doi:10.1107/S010876819200510X.
- Mitchell et al. [2000] R. H. Mitchell, A. R. Chakhmouradian, P. M. Woodward, Crystal chemistry of perovskite-type compounds in the tausonite-loparite series, (sr1-2xnaxlax)tio3, Physics and Chemistry of Minerals 27 (2000) 583–589. URL: https://doi.org/10.1007/s002690000103. doi:10.1007/s002690000103.
- Glazer and Mabud [1978] A. M. Glazer, S. A. Mabud, Powder profile refinement of lead zirconate titanate at several temperatures. ii. pure pbtio3, Acta Crystallographica Section B 34 (1978) 1065–1070. URL: https://doi.org/10.1107/S0567740878004938. doi:10.1107/S0567740878004938.
- Cohen and Krakauer [1992] R. E. Cohen, H. Krakauer, Electronic structure studies of the differences in ferroelectric behavior of batio3 and pbtio3, Ferroelectrics 136 (1992) 65–83. URL: https://doi.org/10.1080/00150199208016067. doi:10.1080/00150199208016067.
- Kuroiwa et al. [2001] Y. Kuroiwa, S. Aoyagi, A. Sawada, J. Harada, E. Nishibori, M. Takata, M. Sakata, Evidence for pb-o covalency in tetragonal , Phys. Rev. Lett. 87 (2001) 217601. URL: https://link.aps.org/doi/10.1103/PhysRevLett.87.217601. doi:10.1103/PhysRevLett.87.217601.
- Anspoks et al. [2018] A. Anspoks, C. Marini, T. Miyanaga, B. Joseph, A. Kuzmin, J. Purans, J. Timoshenko, A. Bussmann-Holder, Local structure of a-atom in abo3 perovskites studies by rmc-exafs, Radiation Physics and Chemistry (2018). URL: http://www.sciencedirect.com/science/article/pii/S0969806X18309599.
- Moriyoshi et al. [2011] C. Moriyoshi, S. Hiramoto, H. Ohkubo, Y. Kuroiwa, H. Osawa, K. Sugimoto, S. Kimura, M. Takata, Y. Kitanaka, Y. Noguchi, M. Miyayama, Synchrotron radiation study on time-resolved tetragonal lattice strain of batio3 under electric field, Japanese Journal of Applied Physics 50 (2011) 09NE05. URL: https://doi.org/10.1143%2Fjjap.50.09ne05. doi:10.1143/jjap.50.09ne05.
- Tazaki et al. [2009] R. Tazaki, D. Fu, M. Itoh, M. Daimon, S. ya Koshihara, Lattice distortion under an electric field in BaTiO3piezoelectric single crystal, Journal of Physics: Condensed Matter 21 (2009) 215903. URL: https://doi.org/10.1088%2F0953-8984%2F21%2F21%2F215903. doi:10.1088/0953-8984/21/21/215903.
- Choi et al. [2004] K. J. Choi, M. Biegalski, Y. L. Li, A. Sharan, J. Schubert, R. Uecker, P. Reiche, Y. B. Chen, X. Q. Pan, V. Gopalan, L.-Q. Chen, D. G. Schlom, C. B. Eom, Enhancement of ferroelectricity in strained batio3 thin films, Science 306 (2004) 1005–1009. URL: https://science.sciencemag.org/content/306/5698/1005. doi:10.1126/science.1103218.
- Tyunina et al. [2019] M. Tyunina, O. Pacherova, J. Peräntie, M. Savinov, M. Jelinek, H. Jantunen, A. Dejneka, Perovskite ferroelectric tuned by thermal strain, Scientific reports 9 (2019) 3677. URL: https://doi.org/10.1038/s41598-019-40260-y. doi:10.1038/s41598-019-40260-y.
- Setter et al. [2006] N. Setter, D. Damjanovic, L. Eng, G. Fox, S. Gevorgian, S. Hong, A. Kingon, H. Kohlstedt, N. Y. Park, G. B. Stephenson, I. Stolitchnov, A. K. Taganstev, D. V. Taylor, T. Yamada, S. Streiffer, Ferroelectric thin films: Review of materials, properties, and applications, Journal of Applied Physics 100 (2006) 051606. URL: https://doi.org/10.1063/1.2336999. doi:10.1063/1.2336999.
- Shin et al. [2009] J. Shin, A. Goyal, S. Jesse, D. H. Kim, Single-crystal-like, c-axis oriented batio3 thin films with high-performance on flexible metal templates for ferroelectric applications, Applied Physics Letters 94 (2009) 252903. URL: https://doi.org/10.1063/1.3158955. doi:10.1063/1.3158955.
- Arlt and Neumann [1988] G. Arlt, H. Neumann, Internal bias in ferroelectric ceramics: Origin and time dependence, Ferroelectrics 87 (1988) 109–120. URL: https://doi.org/10.1080/00150198808201374. doi:10.1080/00150198808201374.
- Luo et al. [2012] Z. Luo, S. Pojprapai, J. Glaum, M. Hoffman, Electrical fatigue-induced cracking in lead zirconate titanate piezoelectric ceramic and its influence quantitatively analyzed by refatigue method, Journal of the American Ceramic Society 95 (2012) 2593–2600. URL: https://ceramics.onlinelibrary.wiley.com/doi/abs/10.1111/j.1551-2916.2012.05232.x. doi:10.1111/j.1551-2916.2012.05232.x.
- Vedrinskii et al. [1998] R. V. Vedrinskii, V. L. Kraizman, A. A. Novakovich, P. V. Demekhin, S. V. Urazhdin, Pre-edge fine structure of the 3d atom k x-ray absorption spectra and quantitative atomic structure determinations for ferroelectric perovskite structure crystals, Journal of Physics: Condensed Matter 10 (1998) 9561–9580. URL: https://doi.org/10.1088%2F0953-8984%2F10%2F42%2F021. doi:10.1088/0953-8984/10/42/021.
- De Groot et al. [2009] F. De Groot, G. Vankó, P. Glatzel, The 1s x-ray absorption pre-edge structures in transition metal oxides, Journal of physics. Condensed matter : an Institute of Physics journal 21 (2009) 104207. doi:10.1088/0953-8984/21/10/104207.
- Anspoks et al. [2014] A. Anspoks, D. Bocharov, J. Purans, F. Rocca, A. Sarakovskis, V. Trepakov, A. Dejneka, M. Itoh, Local structure studies of SrTi16o3and SrTi18o3, Physica Scripta 89 (2014) 044002. URL: https://doi.org/10.1088%2F0031-8949%2F89%2F04%2F044002. doi:10.1088/0031-8949/89/04/044002.
- Blanchard and Grosvenor [2018] P. Blanchard, A. Grosvenor, Investigating the local structure of b -site cations in (1- x )batio 3 – x bisco 3 and (1- x )pbtio 3 – x bisco 3 using x-ray absorption spectroscopy, Solid State Sciences 79 (2018). doi:10.1016/j.solidstatesciences.2018.02.018.
- Fu et al. [2010] D. Fu, M. Itoh, S. Koshihara, Invariant lattice strain and polarization in batio3-catio3 ferroelectric alloys, Journal of Physics: Condensed Matter 22 (2010) 052204. URL: https://doi.org/10.1088%2F0953-8984%2F22%2F5%2F052204. doi:10.1088/0953-8984/22/5/052204.
- Fu et al. [2008] D. Fu, M. Itoh, S.-y. Koshihara, T. Kosugi, S. Tsuneyuki, Anomalous phase diagram of ferroelectric (ba,ca)tio3 single crystals with giant electromechanical response, Phys. Rev. Lett. 100 (2008) 227601. URL: https://link.aps.org/doi/10.1103/PhysRevLett.100.227601. doi:10.1103/PhysRevLett.100.227601.
- Levin et al. [2011] I. Levin, E. Cockayne, V. Krayzman, J. C. Woicik, S. Lee, C. A. Randall, Local structure of ba(ti,zr)o3 perovskite-like solid solutions and its relation to the band-gap behavior, Phys. Rev. B 83 (2011) 094122. URL: https://link.aps.org/doi/10.1103/PhysRevB.83.094122. doi:10.1103/PhysRevB.83.094122.
- Bootchanont et al. [2013] A. Bootchanont, J. Jutimoosik, S. Chandarak, M. Unruan, S. Rujirawat, R. Yimnirun, R. Guo, A. Bhalla, Investigation of local structure in batio3-bazro3 system by synchrotron x-ray absorption spectroscopy, Ceramics International 39 (2013) S579 – S582. URL: http://www.sciencedirect.com/science/article/pii/S0272884212011029. doi:https://doi.org/10.1016/j.ceramint.2012.10.139, the 8th Asian Meeting on Electroceramics (AMEC-8).
- Ghosez et al. [1995] P. Ghosez, X. Gonze, P. Lambin, J.-P. Michenaud, Born effective charges of barium titanate: Band-by-band decomposition and sensitivity to structural features, Phys. Rev. B 51 (1995) 6765–6768. URL: https://link.aps.org/doi/10.1103/PhysRevB.51.6765. doi:10.1103/PhysRevB.51.6765.
- Rehr et al. [2010] J. J. Rehr, J. J. Kas, F. D. Vila, M. P. Prange, K. Jorissen, Parameter-free calculations of x-ray spectra with feff9, Phys. Chem. Chem. Phys. 12 (2010) 5503–5513. URL: http://dx.doi.org/10.1039/B926434E. doi:10.1039/B926434E.
- Tulip [2004] P. R. Tulip, Dielectric and lattice dynamical properties of molecular crystals via density functional perturbation theory: implementation within a first principles code, Ph. d thesis, Durham University, 2004.