Strongly lensed cluster substructures are not in tension with CDM
Abstract
Strong gravitational lensing observations can test structure formation models by constraining the masses and concentrations of subhaloes in massive galaxy clusters. Recent work has concluded that cluster subhaloes are more abundant and/or concentrated than predicted by CDM simulations; this finding has been interpreted as arising from unidentified issues with simulations or an incorrect understanding of the nature of dark matter. We test these hypotheses by comparing observed subhalo masses and maximum circular velocities to predictions from the high resolution Hydrangea galaxy cluster simulation suite, which is based on the successful EAGLE galaxy formation model. The simulated subhalo mass distribution and mass– relation agrees well with observations, due to the presence of baryons during tidal stripping. Similar agreement is found for the lower-resolution Illustris-TNG300 simulation. In combination, our results suggest that the abundance and concentration of cluster substructures are not in tension with CDM, but may provide useful constraints for the refinement of baryon physics models in simulations.
keywords:
galaxies: clusters: general – methods: numerical – dark matter1 Introduction
In a Cold Dark Matter (CDM) universe, structures from dwarf galaxies to massive galaxy clusters have formed hierarchically, through mergers and accretion of smaller structures (Blumenthal et al., 1984). There is a plethora of observational evidence for this general picture, including the ubiquity of stellar haloes and tidal streams within galaxies (e.g. Helmi 2008; Shipp et al. 2018) and – perhaps most directly – the existence of satellite galaxies and their associated dark matter “subhaloes” that have not yet merged (completely) with their host halo (e.g. Yang et al. 2007; Grillo et al. 2015).
Massive substructures near the centre of massive galaxy clusters represent a particularly attractive quantitative test of CDM: their gravitational potential combined with that of their host cluster gives rise to strong lensing distortions of background galaxies, from which their mass distribution can be reconstructed in an, in principle, direct and unbiased way (e.g. Kneib & Natarajan 2011). The lens models derived from these observations typically prefer a larger number of massive cluster substructures than predicted by CDM -body simulations (e.g. Grillo et al. 2015).
While this could be interpreted as a failure of the CDM paradigm, a more trivial solution is that the presence of baryons modifies the properties of subhaloes in ways not captured by -body simulations. Feedback from star formation or active galactic nuclei, for example, may expel gas from galaxies and thus lower their central concentration, while gas condensation and star formation have the opposite effect (e.g. Duffy et al. 2010; Despali & Vegetti 2017). A meaningful test of the CDM paradigm therefore requires comparisons to hydrodynamical simulations that self-consistently include these baryonic processes. Unlike their numerically well-converged -body analogues (e.g. Wang et al. 2020), the development and refinement of such simulations is still an ongoing effort (see e.g. Vogelsberger et al. 2020), and their considerably higher computational cost typically restricts hydrodynamic simulations of galaxy clusters to much lower resolution than equivalent -body calculations (e.g. Gao et al. 2012; Cui et al. 2018).
In a recent study, Meneghetti et al. (2020, hereafter M20) compared substructure detections in a sample of eleven intermediate-redshift () clusters to a suite of cosmological hydrodynamic simulations (Planelles et al., 2014) and still found significant tensions: the observed clusters produce an order of magnitude more strong lensing events than simulated clusters, and the inferred maximum circular velocity of cluster subhaloes – a proxy for their concentration – is several times larger than predicted. In view of the modelling uncertainties and limited resolution of such simulations, the interpretation of this discrepancy requires comparisons to additional simulations with different resolution and modelling approaches. M20 include some comparisons of this nature, none of which fully resolve the tension: they therefore interpret their findings as evidence of either a so-far unappreciated failure of cosmological simulations, or the need to consider alternatives to CDM (see e.g. Yang & Yu 2021).
We extend this approach by comparing their observations to galaxy clusters from the state-of-the-art cosmological hydrodynamical Hydrangea/C-EAGLE simulation suite. They achieve a mass resolution 100 times higher than the Planelles et al. (2014) simulations used by M20, and the underlying EAGLE baryon physics model (Schaye et al., 2015) has been shown to reproduce a wide variety of observations on galaxy and cluster scales (see e.g. Schaye et al. 2015; McAlpine et al. 2016; Bahé et al. 2017, and references therein). As such, they represent the arguably best tool to confront the observations of M20 with expectations from the CDM model.
The remainder of this letter is structured as follows. In Section 2, we summarize the key aspects of the simulations and of the observational analysis of M20. We compare the two in Section 3; surprisingly, we find good agreement. In Section 4, we test the importance of baryon physics for our results, before summarising our results in Section 5.
2 Overview of observations and simulations
2.1 Strong lensing observations
M20 characterize the substructure population in 11 massive galaxy clusters in the redshift range (median ) from the Hubble Frontier Fields (Lotz et al., 2017) and CLASH (Postman et al., 2012) surveys. Hubble Space Telescope lensing observations from these surveys, combined with spectroscopic data from the ESO Very Large Telescope for a subset of clusters (Treu et al., 2015; Caminha et al., 2016), were modelled with the Lenstool code (Jullo et al., 2007). For their main “reference” sample of three clusters, on which we focus here, this model consists of a combination of cluster-scale and galaxy-scale dual pseudo-isothermal elliptical (dPIE) mass distributions; the latter are centred on the locations of galaxies and their two free parameters are constrained by power-law scaling relations with the galaxy luminosity that themselves incorporate measurements of stellar kinematics (Bergamini et al., 2019). Subhalo masses are then obtained from integrating each dPIE profile, while their maximum circular velocities (where is Newton’s constant, and the mass contained within radius ) are directly related to the dPIE parameter by . For further details, the reader is referred to M20.
2.2 The Hydrangea simulations
2.2.1 Simulation overview
The Hydrangea simulations (Bahé et al., 2017; Barnes et al., 2017) are a suite of 24 simulated massive galaxy clusters ( at ) and their large-scale surroundings111 is the mass within a radius from the cluster centre of potential, within which the mean density equals 200 times the critical density of the Universe at that redshift; and denote the corresponding values at an overdensity corresponding to a collapsed spherical top-hat perturbation (Bryan & Norman, 1998). For consistency with M20, we mostly use the latter definition in this work.. They are part of the C-EAGLE project of zoom-in cluster simulations with a variant of the EAGLE simulation code (Schaye et al., 2015) and have a mass resolution of 1.8 for baryons and 9.7 for dark matter, respectively; the gravitational softening is 700 pc at . The simulation code is based on the anarchy variant of Smoothed Particle Hydrodynamics (Schaller et al., 2015b) and incudes sub-grid models for the same astrophysical processes as the simulations of Planelles et al. (2014), but often implemented in substantially different ways: element-by-element radiative cooling and photoheating (Wiersma et al., 2009a), reionization (Wiersma et al., 2009b), star formation (Schaye & Dalla Vecchia, 2008, with the metallicity-dependent star formation threshold of Schaye 2004), mass and metal enrichment from stellar outflows (Wiersma et al., 2009b), energy feedback from star formation in stochastic thermal form (Dalla Vecchia & Schaye, 2012), and for the seeding, growth, and energy feedback from supermassive black holes (Rosas-Guevara et al., 2015; Schaye et al., 2015). The implementation of these models is described in detail by Schaye et al. (2015) and Bahé et al. (2017).
One key aspect of the EAGLE model – and together with the higher resolution the main difference from the Planelles et al. (2014) simulations analysed by M20 – is that sub-grid model parameters that are not well-constrained by observations (specifically, the scaling of energy feedback from star formation with local properties and the coupling efficiency of AGN feedback) were calibrated against the stellar mass function, galaxy sizes, and black hole masses of field galaxies in the local Universe (Crain et al., 2015). No cluster-scale observations were considered in the calibration process; as a consequence, some properties of the cluster haloes are in tension with observations, in particular the total gas fractions (Barnes et al., 2017) and iron abundance (Pearce et al., 2020) of the intra-cluster medium, and the stellar masses of the central cluster galaxies (Bahé et al., 2017). The stellar mass function of satellite galaxies, on the other hand, matches observations closely both at (Bahé et al., 2017) and (Ahad et al., 2020).
2.2.2 Subhalo identification
Subhaloes are found in the simulation outputs with the subfind algorithm (Dolag et al., 2009, see also Springel et al. 2001), which identifies gravitationally self-bound particles within locally overdense regions of friends-of-friends haloes. This algorithm has a known tendency to miss some particles that are physically part of a subhalo, and hence underestimate their true mass, in the central regions of rich clusters (e.g. Muldrew et al. 2011; Behroozi et al. 2013). To avoid this, we use the re-computed “Cantor” subhalo catalogue as described in Bahé et al. (in prep.): in brief, this method is based on the subfind catalogues, but also considers particles that belonged to the progenitor of a subhalo in previous snapshots. Bahé et al. (in prep.) show that, in contrast to subfind, this approach leads to an almost perfect separation between subhaloes and the smooth cluster halo; subhalo masses are therefore systematically higher than in subfind by factors of 1.25–10 (highest for the most massive subhaloes and closest to the cluster centre), but maximum circular velocities () typically differ by only a few per cent.
A caveat is that the subhalo properties from Cantor (and also subfind) are based on physical considerations, rather than mimicking the observational procedure. With our primary aim being to test the presence of a large, fundamental offset between the simulations and observations, we neglect the impact of this difference here and instead compare simulations and observations at face value.
3 The accuracy of simulated cluster substructures
3.1 Predicted subhalo mass functions
We begin by comparing the (cumulative) subhalo mass function predicted by Hydrangea to the lensing observations in Fig. 1. From the simulation snapshots at redshift , we select 9 clusters with whose centre is at least 8 co-moving Mpc away from any low-resolution boundary particles. In each cluster, we then select subhaloes with mass , projected distance (in the simulation xy plane) from the cluster centre of potential of , and with a maximum offset of along the direction. Finally, we exclude a small number of subhaloes very close to the cluster centres () that are in the process of merging with the BCG and would not be detected as separate galaxies in observations. Our total sample contains 726 subhaloes.
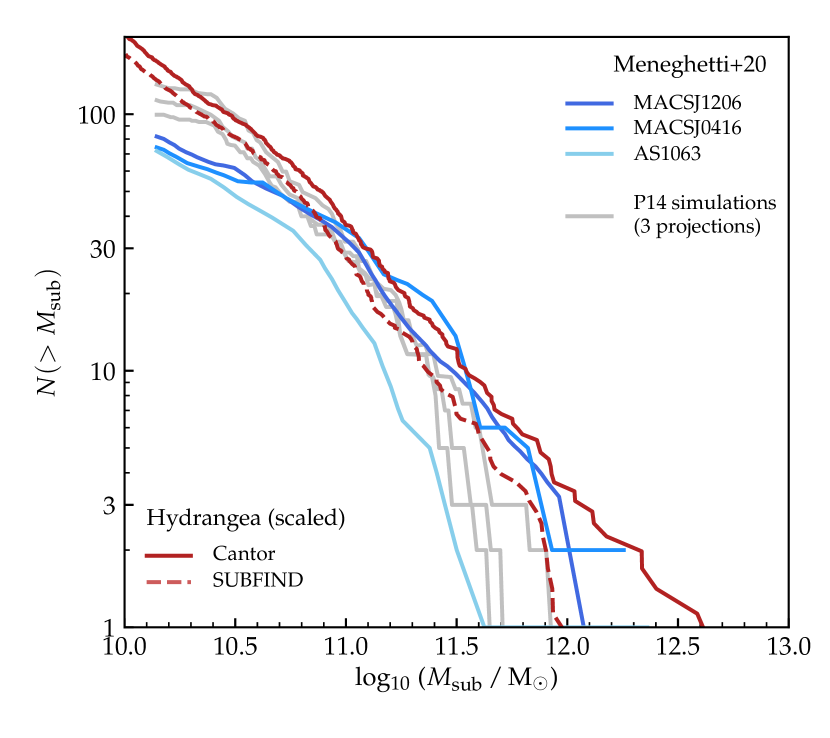
The mean of these 9 Hydrangea clusters is , which is noticeably lower than the three ‘reference’ clusters analysed by M20: adopting masses of (Biviano et al., 2013), (Balestra et al., 2016), and (Sartoris et al., 2020) for MACSJ1206, MACSJ0416, and AS1063, respectively, gives a mean of . To account for this difference in halo mass, we scale the Hydrangea mass function222We have verified that all our results are qualitatively unchanged, and remain quantitatively consistent, when analysing only the most massive Hydrangea cluster ( at ). by a factor of 2.54.
The result, using subhalo masses from Cantor, is shown as the solid red line in Fig. 1: the cumulative mass function is an almost straight power-law with an index close to 1, which agrees well with the observed distribution from M20 (blue lines) down to . At lower masses, the observations show a noticeable flattening, plausibly due to detection incompleteness. The Hydrangea prediction also agrees reasonably well with the simulations of Planelles et al. (2014) as shown by M20 (grey lines), although these, like the observations, show a flattening at the low-mass end.
Not surprisingly, using the subhalo masses from subfind instead of Cantor (red dashed line in Fig. 1) leads to a somewhat lower mass function, but only by a factor . Neither of these methods matches the observational mass measurement in detail, but the relatively small difference between them indicates that the masses are not overly sensitive to subhalo finder details.
3.2 Subhalo maximum circular velocities
As M20 have shown, broad agreement in the cumulative subhalo mass function is also achieved by the Planelles et al. (2014) simulations. The strong difference in lensing signal instead stems from a discrepancy in the subhalo concentration, parameterised as the maximum circular velocity (but see also Robertson 2021 for the influence of resolution on the predicted lensing signal). We test the Hydrangea suite on this metric in Fig. 2, using the same subhalo selection as above. We distinguish between subhaloes that are physically close to the cluster centre (3D distance , filled circles) and those that only appear close in projection (open circles); both should however be compared together to the observed relation. The (combined) running median in 0.25 dex bins in is shown as a red line with its 1 uncertainty from boostrapping indicated by the light red shaded region333We emphasize that this accounts only for the statistical uncertainty due to the limited Hydrangea sample size, not for the systematic error due to differences in the calculation of and w.r.t. M20.. As an indication of the sensitivity to subhalo definition, we also show the corresponding median trend using the subfind properties as a purple dash-dotted line.
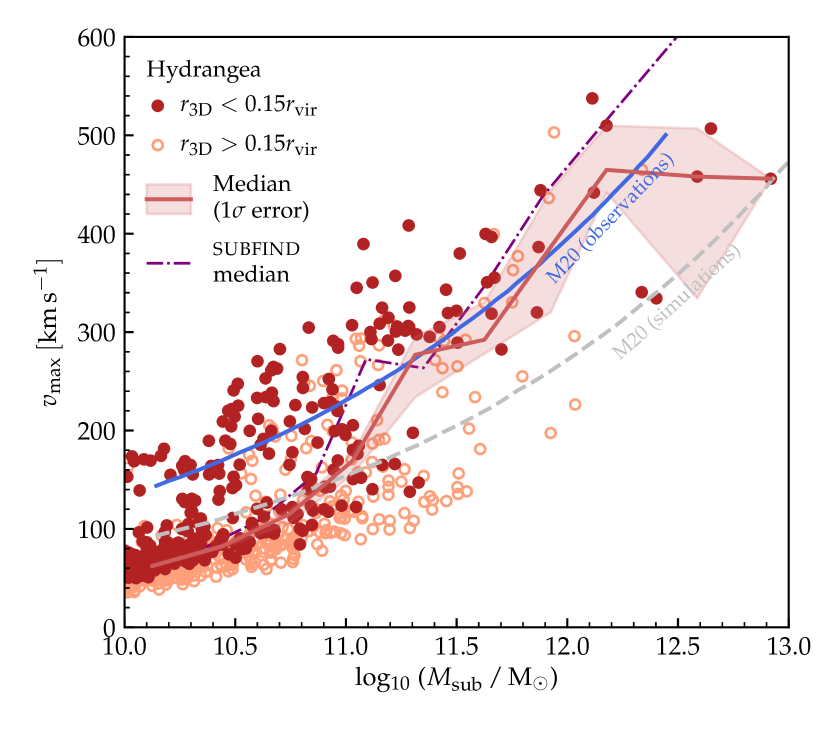
The distribution of Hydrangea cluster subhaloes in the – plane is clearly bimodal: a lower sequence dominates at – where we however caution that resolution effects may be non-negligible (Schaye et al., 2015) – and roughly follows the trend from the Planelles et al. (2014) simulations. The upper branch with 2–3 times higher is more prominent at higher masses and follows the M20 observational relation remarkably well, as does the overall median at : if anything, these subhaloes have a slightly higher than measured444We note, however, that the observational relation is most strongly constrained by low-mass subhaloes (M20; Meneghetti, priv. comm.).. The high- branch is noticeably over-abundant in physically central subhaloes, which are also clustered closer to the top end within the branch555M20 also show a – relation from Hydrangea, which falls well below their observations (their fig. S10). The strong variation with cluster-centric radius resolves this apparent discrepancy: their relation is based on all galaxies within (including those at large ), which are biased to larger radii than the galaxies probed in their observations.. We will return to this point below.
4 The role of baryon physics models
Compared to the Planelles et al. (2014) simulations shown in M20, the Hydrangea suite differs in both resolution and the modelling of baryon physics. To gain insight into the origin of the higher predicted by Hydrangea, we now test the role of the latter, by comparing the Hydrangea predictions first to an analogous suite of gravity-only runs and then to the Illustris-TNG300 simulation.
4.1 The effect of baryons
To examine the impact of baryons on the properties of cluster subhaloes, we show in Fig. 3 the – relation predicted by the DM-only analogue of the Hydrangea simulation suite (i.e. evolving the same initial conditions with gravity only). These are shown as brown filled (orange open) diamonds for subhaloes within (outside) a 3D radius of 0.15 from the cluster centre. For reference, the prediction from the hydrodynamical simulation, including baryons, is shown as filled circles. We here use the properties from the subfind catalogue for both simulation suites, because the Cantor re-processing (see Section 2.2.2) has not yet been completed for the dark-matter only simulations.
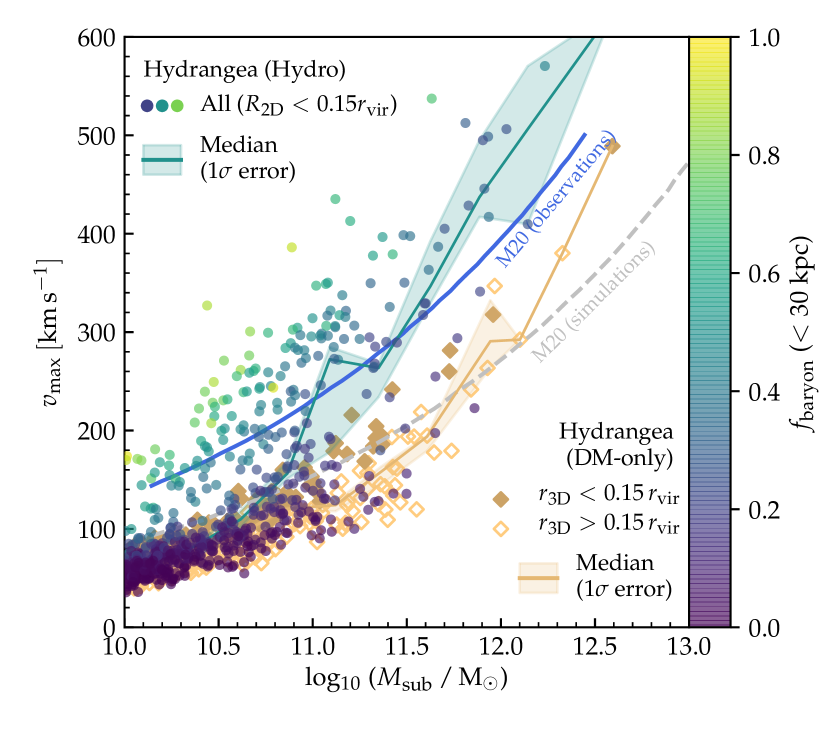
It is evident that the – relation is offset to higher velocities by the inclusion of baryons. This difference is clearest at the massive end () – where the DM-only simulations predict a relation 50 per cent below that inferred observationally by M20, with noticeably less difference between those subhaloes within and outside of 0.15 – but even at 10, only the hydrodynamic simulations exhibit a tail of subhaloes extending to km/s.
A complementary diagnostic for the role of baryons in the – relation is the baryon mass fraction of subhaloes in the hydrodynamical simulation, as indicated by the colour of the filled circles in Fig. 3. While isolated galaxies are dominated by dark matter except possibly in the central few kpc (see e.g. fig. 6 of Schaller et al. 2015a), many of the cluster subhaloes reach baryon fractions 50 per cent within 30 kpc, with a clear correlation between and . As shown by Armitage et al. (2019), these high baryon fractions are the result of preferential stripping of dark matter from galaxies, while their stellar mass remains largely intact (see also Bahé et al. 2019 and Joshi et al. 2019). The compact, high subhaloes predicted by Hydrangea are therefore most likely the result of their well-resolved, centrally concentrated stellar components being able to withstand tidal stripping in a realistic way666Consistent with this interpretation, Fig. 3 shows that subhaloes in the hydrodynamic simulations tend to be more massive than in the DM-only runs. The dominant difference is however that in : subhaloes with in the hydrodynamic simulations, for example, have on average a 32 per cent higher but 78 per cent higher than their particle-matched subhaloes in the DM-only runs..
4.2 Comparison to Illustris-TNG300
We have shown that Hydrangea is an example of a CDM simulation that predicts subhaloes with as high as inferred from strong lensing observations, but the key role of baryons leaves the possibility that this is merely a fortuitous coincidence. To test this, we have repeated our analysis with the highest-resolution Illustris-TNG300 simulation (Marinacci et al., 2018; Naiman et al., 2018; Nelson et al., 2018; Pillepich et al., 2018; Springel et al., 2018), the only other simulation that models massive galaxy clusters at comparable resolution (a factor of six higher baryon mass than Hydrangea). Illustris-TNG300 contains sub-grid models for the same astrophysical processes as Hydrangea, but implemented in (mostly) different ways; in addition it is based on the fundamentally different hydrodynamics code arepo (Springel, 2010) that also includes magnetic fields (Pakmor & Springel, 2013).
From the publicly available data (Nelson et al., 2019), we obtain and of subhaloes in 9 clusters with at redshift (snapshot 71), a total of 342 within (projected in the simulation xy plane). These are compared to Hydrangea – directly form subfind in both cases – in Fig. 4, again distinguishing subhaloes within and outside of a 3D radius of 0.15 from the cluster centre (filled and open symbols, respectively) with combined medians and their 1 uncertainties shown by the correspondingly coloured solid lines and shaded bands.
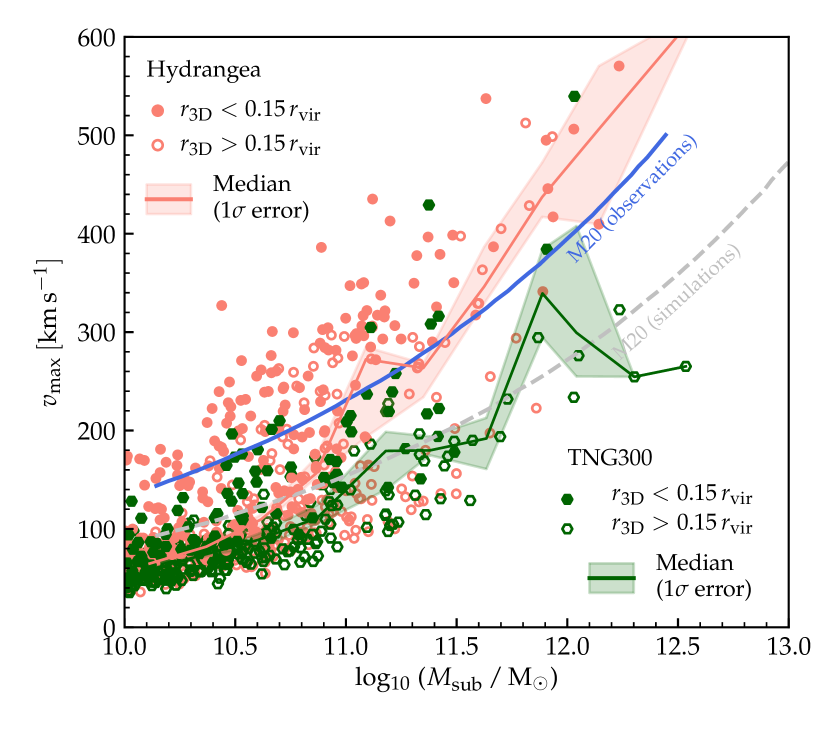
In general, the TNG300 subhaloes (dark green) show a bias towards lower values at fixed compared to Hydrangea (light red), although this is far from uniform. At the lowest subhalo masses we probe (), the “main sequence” of subhaloes agrees remarkably well between both simulations ( km/s), while subhaloes with outside of 0.15 (open symbols) have of almost a factor of 2 lower than their Hydrangea counterparts. One possible explanation is that these “outer” subhaloes tend to lie at larger 3D radii in TNG300 (median ) than in Hydrangea (0.33 ). We note in particular, though, that the central massive subhaloes (filled dark green circles in the right half of the plot) agree well with their Hydrangea analogues: both predict similar high for subhaloes near the centre of massive clusters.
5 Summary and conclusions
Motivated by results in the recent literature (Meneghetti et al., 2020, M20) that massive galaxy clusters contain more concentrated substructures than predicted by CDM simulations, we have compared these observations to massive galaxy clusters with at in the Hydrangea simulation suite (Bahé et al., 2017; Barnes et al., 2017). We find the following:
-
1.
The subhalo mass function in the (projected) centre of galaxy clusters is realistically predicted by simulations (Fig. 1).
-
2.
Simulated subhaloes show a factor 2 scatter in maximum circular velocity at fixed mass, with a general trend that agrees well with the observational inference (Fig. 2) .
-
3.
At fixed mass, subhaloes in simulations with baryons have up to two times higher than predicted by gravity-only simulations; the offset is larger for subhaloes with a higher baryon fraction. This strongly suggests that dense stellar cores that can resist tidal stripping are key in explaining the observed strong lensing signals (Fig. 3).
-
4.
The Illustris-TNG300 simulation predicts similarly high for central cluster subhaloes as Hydrangea (Fig. 4). The ability to form subhaloes consistent with strong lensing data is therefore a common success of modern, high-resolution cosmological hydrodynamic simulations.
In conclusion, the Hydrangea simulations demonstrate that the observed abundance and concentration of cluster substructures are compatible with CDM predictions, with no evidence of a fundamental tension. Instead, the impact of baryons on cluster substructures – also recently highlighted by Haggar et al. (2021) – suggests that strong lensing events in clusters can provide attractive calibration constraints for future simulations.
Acknowledgements
I thank the anonymous referee for helpful comments that improved the presentation of results, Andrew Robertson and Joop Schaye for helpful discussions, and Massimo Meneghetti for helpful comments on an earlier version of this manuscript.
YMB gratefully acknowledges funding from the Netherlands Organization for Scientific Research (NWO) through Veni grant number 639.041.751. The Hydrangea simulations were in part performed on the German federal maximum performance computer “HazelHen” at HLRS Stuttgart, under project GCS-HYDA / ID 44067, through the Gauss Center for Supercomputing project “Hydrangea”. This work used the DiRAC@Durham facility managed by the Institute for Computational Cosmology on behalf of the STFC DiRAC HPC Facility (www.dirac.ac.uk). The equipment was funded by BEIS capital funding via STFC capital grants ST/K00042X/1, ST/P002293/1, ST/R002371/1 and ST/S002502/1, Durham University and STFC operations grant ST/R000832/1. DiRAC is part of the National e-Infrastructure.
Data Availability
The Hydrangea simulation data are available from the author, ahead of their impending public release. IllustrisTNG-300 data are publicly available at www.tng-project.org (Nelson et al., 2019). All plot data are available at https://home.strw.leidenuniv.nl/~bahe/papers.html.
References
- Ahad et al. (2020) Ahad L. S., Bahé Y. M., Hoekstra H., van der Burg R. F. J., Muzzin A., 2020, arXiv e-prints, p. arXiv:2010.16195
- Armitage et al. (2019) Armitage T. J., Kay S. T., Barnes D. J., Bahé Y. M., Dalla Vecchia C., 2019, MNRAS, 482, 3308
- Bahé et al. (2017) Bahé Y. M., et al., 2017, MNRAS, 470, 4186
- Bahé et al. (2019) Bahé Y. M., et al., 2019, MNRAS, 485, 2287
- Balestra et al. (2016) Balestra I., et al., 2016, ApJS, 224, 33
- Barnes et al. (2017) Barnes D. J., et al., 2017, MNRAS, 471, 1088
- Behroozi et al. (2013) Behroozi P. S., Wechsler R. H., Wu H.-Y., 2013, ApJ, 762, 109
- Bergamini et al. (2019) Bergamini P., et al., 2019, A&A, 631, A130
- Biviano et al. (2013) Biviano A., et al., 2013, A&A, 558, A1
- Blumenthal et al. (1984) Blumenthal G. R., Faber S. M., Primack J. R., Rees M. J., 1984, Nature, 311, 517
- Bryan & Norman (1998) Bryan G. L., Norman M. L., 1998, ApJ, 495, 80
- Caminha et al. (2016) Caminha G. B., et al., 2016, A&A, 587, A80
- Crain et al. (2015) Crain R. A., et al., 2015, MNRAS, 450, 1937
- Cui et al. (2018) Cui W., et al., 2018, MNRAS, 480, 2898
- Dalla Vecchia & Schaye (2012) Dalla Vecchia C., Schaye J., 2012, MNRAS, 426, 140
- Despali & Vegetti (2017) Despali G., Vegetti S., 2017, MNRAS, 469, 1997
- Dolag et al. (2009) Dolag K., Borgani S., Murante G., Springel V., 2009, MNRAS, 399, 497
- Duffy et al. (2010) Duffy A. R., Schaye J., Kay S. T., Dalla Vecchia C., Battye R. A., Booth C. M., 2010, MNRAS, 405, 2161
- Gao et al. (2012) Gao L., Navarro J. F., Frenk C. S., Jenkins A., Springel V., White S. D. M., 2012, MNRAS, 425, 2169
- Grillo et al. (2015) Grillo C., et al., 2015, ApJ, 800, 38
- Haggar et al. (2021) Haggar R., Pearce F. R., Gray M. E., Knebe A., Yepes G., 2021, MNRAS,
- Helmi (2008) Helmi A., 2008, A&ARv, 15, 145
- Joshi et al. (2019) Joshi G. D., Parker L. C., Wadsley J., Keller B. W., 2019, MNRAS, 483, 235
- Jullo et al. (2007) Jullo E., Kneib J. P., Limousin M., Elíasdóttir Á., Marshall P. J., Verdugo T., 2007, New Journal of Physics, 9, 447
- Kneib & Natarajan (2011) Kneib J.-P., Natarajan P., 2011, A&ARv, 19, 47
- Lotz et al. (2017) Lotz J. M., et al., 2017, ApJ, 837, 97
- Marinacci et al. (2018) Marinacci F., et al., 2018, MNRAS, 480, 5113
- McAlpine et al. (2016) McAlpine S., et al., 2016, Astronomy and Computing, 15, 72
- Meneghetti et al. (2020) Meneghetti M., et al., 2020, Science, 369, 1347
- Muldrew et al. (2011) Muldrew S. I., Pearce F. R., Power C., 2011, MNRAS, 410, 2617
- Naiman et al. (2018) Naiman J. P., et al., 2018, MNRAS, 477, 1206
- Nelson et al. (2018) Nelson D., et al., 2018, MNRAS, 475, 624
- Nelson et al. (2019) Nelson D., et al., 2019, Computational Astrophysics and Cosmology, 6, 2
- Pakmor & Springel (2013) Pakmor R., Springel V., 2013, MNRAS, 432, 176
- Pearce et al. (2020) Pearce F. A., Kay S. T., Barnes D. J., Bahe Y. M., Bower R. G., 2020, arXiv e-prints, p. arXiv:2005.12391
- Pillepich et al. (2018) Pillepich A., et al., 2018, MNRAS, 475, 648
- Planelles et al. (2014) Planelles S., Borgani S., Fabjan D., Killedar M., Murante G., Granato G. L., Ragone-Figueroa C., Dolag K., 2014, MNRAS, 438, 195
- Postman et al. (2012) Postman M., et al., 2012, ApJS, 199, 25
- Robertson (2021) Robertson A., 2021, arXiv e-prints, p. arXiv:2101.12067
- Rosas-Guevara et al. (2015) Rosas-Guevara Y. M., et al., 2015, MNRAS, 454, 1038
- Sartoris et al. (2020) Sartoris B., et al., 2020, A&A, 637, A34
- Schaller et al. (2015a) Schaller M., et al., 2015a, MNRAS, 451, 1247
- Schaller et al. (2015b) Schaller M., Dalla Vecchia C., Schaye J., Bower R. G., Theuns T., Crain R. A., Furlong M., McCarthy I. G., 2015b, MNRAS, 454, 2277
- Schaye (2004) Schaye J., 2004, ApJ, 609, 667
- Schaye & Dalla Vecchia (2008) Schaye J., Dalla Vecchia C., 2008, MNRAS, 383, 1210
- Schaye et al. (2015) Schaye J., et al., 2015, MNRAS, 446, 521
- Shipp et al. (2018) Shipp N., et al., 2018, ApJ, 862, 114
- Springel (2010) Springel V., 2010, MNRAS, 401, 791
- Springel et al. (2001) Springel V., White S. D. M., Tormen G., Kauffmann G., 2001, MNRAS, 328, 726
- Springel et al. (2018) Springel V., et al., 2018, MNRAS, 475, 676
- Treu et al. (2015) Treu T., et al., 2015, ApJ, 812, 114
- Vogelsberger et al. (2020) Vogelsberger M., Marinacci F., Torrey P., Puchwein E., 2020, Nature Reviews Physics, 2, 42
- Wang et al. (2020) Wang J., Bose S., Frenk C. S., Gao L., Jenkins A., Springel V., White S. D. M., 2020, Nature, 585, 39
- Wiersma et al. (2009a) Wiersma R. P. C., Schaye J., Smith B. D., 2009a, MNRAS, 393, 99
- Wiersma et al. (2009b) Wiersma R. P. C., Schaye J., Theuns T., Dalla Vecchia C., Tornatore L., 2009b, MNRAS, 399, 574
- Yang & Yu (2021) Yang D., Yu H.-B., 2021, arXiv e-prints, p. arXiv:2102.02375
- Yang et al. (2007) Yang X., Mo H. J., van den Bosch F. C., Pasquali A., Li C., Barden M., 2007, ApJ, 671, 153