Eye: Program Visualizer for CS2
Abstract.
In recent years, programming has witnessed a shift towards using standard libraries as a black box. However, there has not been a synchronous development of tools that can help demonstrate the working of such libraries in general programs, which poses an impediment to improved learning outcomes and makes debugging exasperating. In this paper, we present a tool Eye , which is an interactive visual interpreter that provides an intuitive representation of code execution and commonly used data structures in the C++ STL library. Eye provides a comprehensive overview at each stage during run time including the execution stack and the state of data structures. The modular implementation allows for extension to other languages and modification of the graphics as desired.
Eye opens up a gateway for CS2 students to more easily understand myriads of programs that are available on online programming websites, lowering the barrier towards self-learning of coding. It expands the scope of visualizing data structures from standard algorithms to general cases, benefiting both teachers as well as programmers who face issues in debugging. The interpreting nature of Eye also provides space for a visualizer that can describe the execution and not only the current state. We also conduct experiments to evaluate the efficacy of Eye for debugging and comprehending a completely new code. Our findings show that it becomes faster and less frustrating to debug certain problems using this tool, and also makes understanding a new code a much more pleasant experience.
1. Introduction
With the increasing popularity of Computer Science (CS), the number of students interested in a formal CS education is ever-growing and thus is growing the need for CS instructors to move from a standard write-on-board teaching style to a more productive methodology. The advent of CoViD-19 and social distancing has globally amplified this demand by disadvantaging the conventional methods. Instructors now need to both effectively teach over video conference and empower students to continue learning on their own without direct support from the instructor or the TAs. Satisfying this demand requires access to tools that can facilitate self-learning and allow students to further expand their skill set by making use of existing programming resources (such as online programming websites). Appropriate tools that would help understand standard libraries and the relevant algorithms would go a long way in furthering this goal.
In this paper, we restrict ourselves to the education of students who satisfy the following criteria: (i) Have sufficient introductory programming knowledge (‘CS1’ curriculum equivalent), (ii) Learning data structures and algorithms (‘CS2’ curriculum equivalent), and (iii) Practicing programming problems to hone programming skills. We refer to these students as beginners in the paper. We now enumerate the specific difficulties that challenge these beginners:
 \DescriptionThe main screen of Eye. It shows how the current display looks and positions elements.
-
(1)
The primary challenge they face is understanding the working of the well-known data structures and learning the different algorithms that manipulate them. While there are standard algorithms that demonstrate the usage of such structures, there is no tool that visualizes data structures in an arbitrary program. Henceforth, we refer to this problem as learning.
-
(2)
The second challenge they face is that while practicing programming problems, much to their dismay, an inordinate amount of their time is spent debugging, which is a very frustrating process (Perscheid et al., 2017; Perkins et al., 1986). In fact, it is considered by many as the most difficult part of learning programming (Lahtinen et al., 2005). Compile-time or run time errors have some helpful message or stack trace which can be used intelligently to simplify debugging (Hristova et al., 2003; Cosman et al., 2020), but errors that cause the program to give wrong results without obstructing it are much harder to find and fix. This problem is accentuated for bugs resulting from an incorrect understanding or usage of standard libraries and their algorithms. We call these bugs logical bugs and we refer to this problem as logical debugging.
-
(3)
Moreover, the beginners would inevitably be unable to solve some problems, engendering a need for explanatory solutions. Most of the time, these solutions do not exist and the most readily, sometimes the only, available option is to find the working code of the problem setter (or someone else) and understand it. This is markedly more pronounced for problems on online programming websites. Here they face their third challenge - understanding a completely new code. We refer to this problem as code comprehension. Notably, most of these problems require the usage of standard data structures, whose solutions are written by other peers in varying programming styles.
Our contributions toward mitigation of these problems are:
-
(1)
We introduce Eye, an interactive pedagogical tool that visualizes a program’s execution as it runs. It demonstrates properties and usage of data structures in a general environment, thereby helping in learning, logical debugging, and code comprehension.
-
(2)
We present two experiments, along with their methodology and results, which analyze the efficacy of Eye for logical debugging and code comprehension. The first experiment measures the benefit of using Eye in debugging programs of which the subjects have some high-level knowledge, including the algorithm, the role of variables, and the loop invariants. The second experiment measures the benefit of using Eye in understanding a program on a high-level (such as time complexity, loop invariants, and role of data structures) given the problem statement and the program.
We now specify some important properties and reason that they are essential for widespread adoption of any visualization tool. All these properties are satisfied by Eye.
-
P1
Completeness: It should support CS2-equivalent courses by visualizing data structures classes (such as C++ STL). This is required for covering the CS curriculum of beginners.
-
P2
Flexibility: It should provide flexibility to change the display (beyond CSS based changes) so that the instructor can modify it without much trouble. This is needed because instructors would want to focus on different aspects of the program in different lectures and would require changes like zooming in on a data structure, adding animations, or using some external display library of their choice. We believe that the lack of this flexibility can drastically decrease adoption among different universities. Allowing these changes but with considerable modifications can also scare away instructors (Sorva et al., 2013a).
-
P3
Awareness: It should allow the addition of ‘program-aware’ features, including but not limited to explanatory text and variable scoping. This is needed because these features can significantly improve the understanding of the program. Tools that are dependent on execution trace cannot demonstrate such features.
-
P4
Accessibility: It should be able to run and display the visual elements in a web browser. This is for ensuring that every user can use it from anywhere without any hassle of installation or compatibility.
-
P5
Modularity: It should support multiple languages or be modular enough to support new languages with minimal back-end changes. This ensures that the tool is customizable for different universities and instructors and requires that the language-specific part be separate from the remaining implementation.
- P6
We show how Eye satisfies these properties in Sections 4 and 3. In Section 5, we present our results concerning the effect of Eye on debugging and code comprehension. We then conclude in Section 6.
2. Related Work
2.1. Learning
The concept of using visualizations to avoid the drawbacks of on-the-board teaching (see (Orsega et al., 2012)) and improve the understanding of algorithms is not new. Studies have shown that the amount of time students spend on interactive visualization tools correlates with their performance (Guo, 2013; Levy et al., 2003). Therefore, Eye, as a visual tool, has much potential for improving learning.
In the past few decades, a large number of program visualization tools have been created. Sorva (Sorva, 2012) and Sorva et al. (Sorva et al., 2013a) give an overview of many such tools. However, when scrutinized closely, many of these lack our required properties. We give a comparison with some of the prominent program visualization tools in Table 1. We note that Jsvee (Table 1) provides only limited flexibility, which is also discussed in Section 4.
| Tools | P1 | P2 | P3 | P4 | P5 | P6 |
|---|---|---|---|---|---|---|
| Jeliot 3 (Ben-Ari et al., 2011) | ✗ | ✗ | ✗ | ✗ | ✗ | ✓ |
| jGRASP (Hendrix et al., 2004) | ✓ | ✗ | ✗ | ✗ | ✗ | ✗ |
| Jsvee (Sirkia, 2016) | ✗ | ✓ | ✓ | ✓ | ✓ | ✓ |
| Python Tutor (Guo, 2013) | ✗ | ✗ | ✗ | ✓ | ✓ | ✓ |
| UUhistle (Sorva and Sirkiä, 2010) | ✗ | ✗ | ✓ | ✗ | ✗ | ✓ |
| ViLLE (Rajala et al., 2007) | ✗ | ✗ | ✓ | ✗ | ✓ | ✓ |
| Eye | ✓ | ✓ | ✓ | ✓ | ✓ | ✓ |
2.2. Logical Debugging
Ahmadzadeh et al. (Ahmadzadeh et al., 2005) have shown that debugging requires skills distinct from general programming skills. Yet, these skills are not explicitly taught by the instructors and the students have to learn debugging techniques on their own (Michaeli and Romeike, 2019). The industry debuggers do not help either as they are meant for professionals and tend to be too difficult to use and understand by beginners. Furthermore, most do not show the internals of a library. As a result, they might not catch an incorrect update to a data structure until the program’s end. We seek to cover this gap with our tool. In fact, we believe that Eye can be a crucial stepping stone for beginners aiming to use industry debuggers.
The general opinion in relevant literature is that the use of a tool for debugging is indeed beneficial. Sorva et al. (Sorva et al., 2013c) comment on how such tools should be used and integrated with the conventional teaching methods for better results. Lewis and Gregg (Lewis and Gregg, 2016) discuss that introducing such tools earlier than later is even more beneficial. One criticism of debugging tools is that they can help find a bug but cannot help correct it. However, Fitzgerald et al. (Fitzgerald et al., 2008) report that beginners face the most difficulty finding the bug and that once found, fixing it does not take much effort.
We do not expect Eye to be a panacea, but these results are prompting enough to expect that it can help in debugging. To our surprise, a literary survey to find a paper mentioning the effectiveness of such a tool for debugging purposes yielded no result. Therefore to validate Eye’s potential, we devised and conducted our own experiment (see Section 5).
2.3. Code Comprehension
This problem has been studied under the domain of algorithm visualization (AV), which is different from program visualization (PV). The goal of AV is to visually aid the learning of an algorithm and not visualize a general program (Diehl, 2005). JSAV (Karavirta and Shaffer, 2015) is one such prominent AV library for data structures. Our code comprehension problem differs from this by focusing on Eye, a PV tool.
This problem has also been studied indirectly in the debugging literature with the motivation of analyzing difficulties in debugging someone else’s code and Mccauley et al. (Mccauley et al., 2008) discuss this in their comprehensive literary survey on debugging. Gould (Gould, 1975) argue that students first spend time understanding the given code and only then start finding bugs. This separation has been further corroborated by other studies (Gould and Drongowski, 1974; Ahmadzadeh et al., 2005). Moreover, Katz and Anderson (Katz and Anderson, 1987) provide strong evidence that the skills needed to understand the system are not necessarily connected to the skills needed to locate the error. We have discussed the latter in the previous subsection. Regarding the former, we could not find a result showcasing the efficacy of a program visualization tool for code comprehension, let alone with data structure libraries. Therefore, we devise and conduct our own experiment (see Section 5).
3. Design Overview

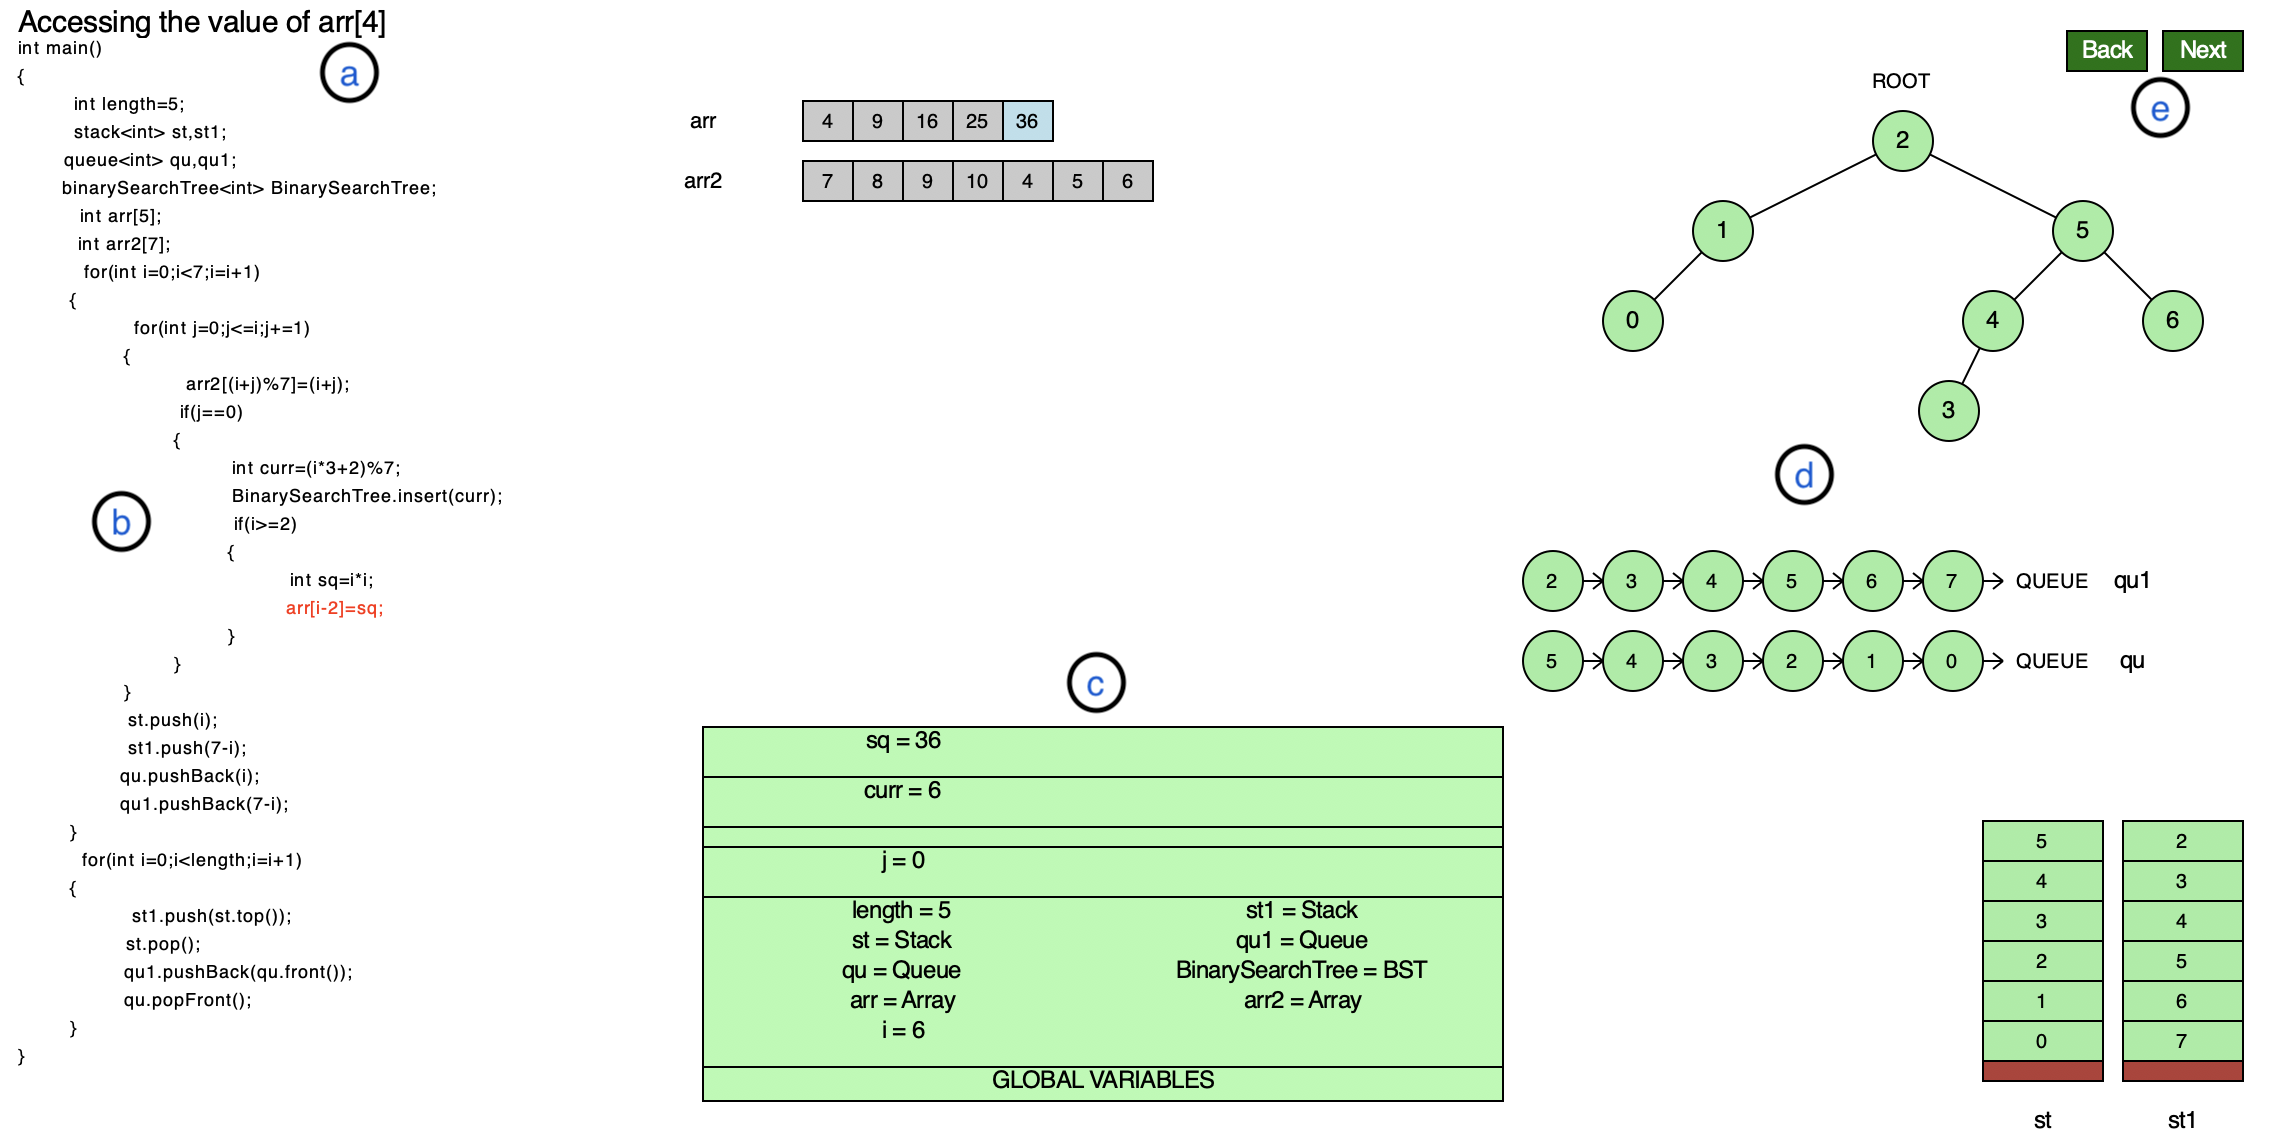
The basic design features of Eye such as code highlighting, explanatory line, array highlighting, execution stack with scoping, differently colored execution stack for a function call.
The visualization of various data structures such as stack, queue, and hash tables.
In this section, we describe the functionality provided by our tool, including the essential elements that are common with different tools and some additional features which we believe are integral for our purpose. Figure 1 shows the window with some fundamental elements on the canvas. The tool currently supports C++ with STL, but thanks to the modular design (see Section 4), it can be easily extended to support other languages like Java and Python. We now enumerate some of the basic elements common among other tools and detail how we supplement them to make them more descriptive.
-
•
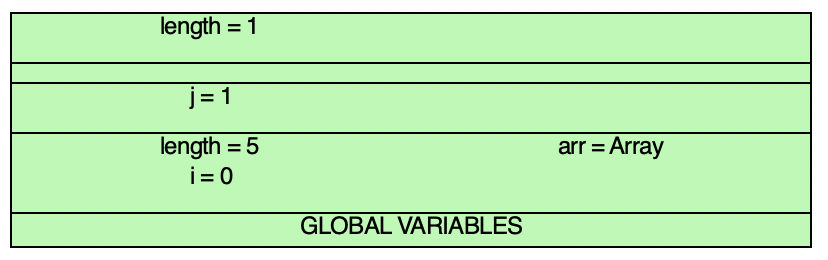
An execution stack that shows all the variables and their current values. For clarity, data structures are shown outside the stack. We divide the stack into different sections to represent different scopes, as shown in Figure 2(c). Showing variables with different scopes in different sections of the stack elucidates the concept of scoping and expedites the detection of bugs due to variable shadowing. Surprisingly, this simple feature was missing from other tools we studied.
-
•
A new execution stack as soon as a new function starts executing. To make understanding easier, we color the currently active frame with a different color, as shown in Figure 2(d).
-
•
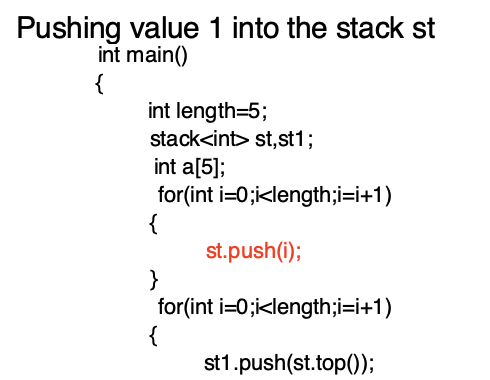
Besides displaying the source code with the current line highlighted, we provide an explanatory line summarizing the operation being executed (Figure 2(a)). It allows faster debugging by avoiding having to look at the syntactically dense code and reading the explanation instead for checking the correctness .
Now we enumerate some advanced design features of our tool.
-
•
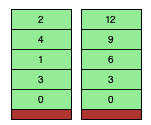
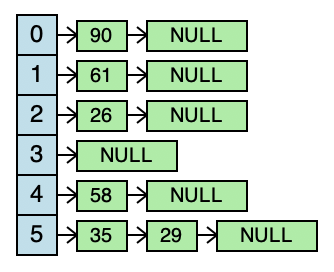
Multiple data structures (STL constructs in C++) such as vector (array), map (binary search tree), stack, queue, deque, and unorderedmap (hash table) are supported (Figure 3(c)). This lets beginners better grasp the working of these data structures and verify their state while debugging.
-
•
Every access to these data structures is highlighted (including arrays, as shown in Figures 2(b) and 1). This speeds up the debugging process as students can skip the code or explanation and directly verify if all accesses (and assignments) are occurring as expected. For example, indexing errors, which are quite common among beginners, become noticeable due to this feature. It also helps in code comprehension where the student can quickly see which value was read from or written onto a data structure.
-
•
We carry this highlighting feature further to visually explain what happens internally in each data structure on a function call. For example, when an element is inserted or deleted in a binary search tree (Figure 4(d)). With this feature, we expect appreciable improvement in understanding when learning these data structures’ working for the first time.
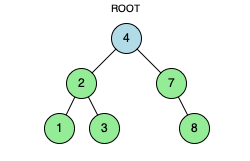
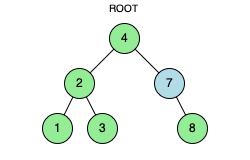
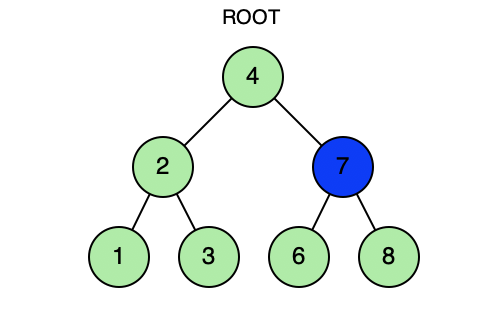
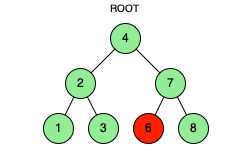
The coloring scheme used for explaining internal working of binary search tree. Different colors are used for reading, modifying and deleting.
4. Implementation Overview
A flowchart which shows the implementation scheme for Eye.
In this section, we give an overview of the implementation and show how Eye satisfies all the requirements that we assert are necessary for receiving wholesale traction.
The implementation is divided into three completely independent modules.
At a high-level, the role of these modules is summarized in Figure 5.
Before delving into these modules, we introduce the intermediate representations shown in the figure.
Canonical Code Representation (CCR): It represents the source code in a format that is language independent.
It covers all the basic programming constructs usually taught in CS2, including data structures.
The primary benefit of introducing this representation is that adding support for different languages requires changes only in module 1, hence ensuring property P5 (Modularity).
The obvious choice for such a representation is an abstract syntax tree (AST).
Canonical Graphics Representation (CGR): It is a representation of the information that module 3 needs to create the graphics.
The reason for creating this intermediate stage is to ensure property P2 (Flexibility).
Tools such as Jsvee (Sirkia, 2016) visualize the program parallelly with its execution.
This causes their visualization and execution semantics to get coupled, making it difficult to change the graphics.
Although it is possible to keep the coupling relaxed, it is natural to expect that an instructor would not be willing to understand the library’s working to manipulate the visualization.
Another advantage is that an intermediate representation allows peeking into future frames to decide the display. For instance, if a data structure is not used in the next 50 frames, the instructor may reasonably wish to hide it for some frames.
CGR is created in the standard JSON format and includes, among other things, variables and the state of data structures.
It may appear similar to an execution trace, but our framework allows us to include significantly more information like the scope of variables and array accesses such as in Figure 2(b).
Module 1: It converts the source code to an abstract syntax tree and is implemented in python.
We avoid using any external compiler as a black box because they impose extraneous restrictions and are usually daunting to modify for future developments.
The lexical analysis and parsing of the code were done using rply library (Gaynor, 2019).
The AST is made up of pre-defined python classes for every programming construct. Support for various C++ STL data structure libraries was added, ensuring property P1 (Completeness).
Module 2: It converts the AST into a JSON object and is also implemented in python.
Every class in the AST implements an ‘exec’ function which emulates its execution and generates the information required in CGR, including program-aware features, hence ensuring property P3 (Awareness).
To interpret and display data structures, we define custom classes with member functions which also create additional execution information.
For example, ‘insert’ in a binary search tree can display each step of the algorithm if required, as shown in Figure 4(d).
Enthusiastic instructors can modify these behaviors too, gaining more flexibility.
Currently, the whole CGR JSON object is returned in the end.
We can optionally pass it after every few line executions to reduce display latency in case of long execution times or infinite loops.
Module 3: It converts the CGR into an actual visual display.
It is implemented using HTML5, CSS, and JavaScript and can run on supported web browsers, ensuring property P4 (Accessibility).
Buttons are present to go to the next or previous frame, ensuring property P6 (Interactivity).
Visualization can also be produced locally via graphics.py, a basic graphic library of python (Zelle, 2010).
The current graphics can easily be further modified since our modular implementation allows the users great flexibility for this purpose.
They can pick colors, add animations, and even use external libraries to help them build appealing graphics.
5. Experimental Results
We design two experiments to measure the efficacy of Eye in debugging and code comprehension. We try to answer the following research questions (RQ) via our experiments:
RQ1(a): Does using Eye for debugging data structures based programs accelerate the debugging process?
RQ1(b): Does using Eye for debugging data structures based programs reduce frustration usually seen in debugging process?
RQ2(a): Does using Eye for understanding a new code improve the code comprehension in a fixed amount of time?
RQ2(b): Does using Eye for understanding a new code lead to better productivity in terms of time?
We contacted around 60 senior computer science undergraduates from our university, out of which 20 agreed to participate. Before proceeding with the experiments, they were given a small demonstration and were asked to familiarize themselves with the tool. The subjects ran the tool locally and not on the browser. Each subject participated in two experiments for answering RQ1(a) and RQ2(a), and an anonymous survey to answer RQ1(b) and RQ2(b).
Due to social distancing, the experiments were conducted online using video conferencing software. On average, each subject took around one hour to complete the experiment. All the experiment material, including videos of some subjects taking the experiment, can be produced upon request.
5.1. Experiment 1
We conducted the experiment as follows:
-
(1)
Subjects were given two problem statements (Prob1 and Prob2) with buggy implementations of their solutions. The problems were based on data structures like stack and queue, and involved algorithms taught as part of CS2 curriculum (and hence were known to subjects). There was exactly one logical bug in both the implementations, and the subjects were asked to fix them. The time taken by the subjects to debug each program was recorded.
-
(2)
The experiment was counterbalanced with respect to tool usage. Half of the subjects did Prob1 with Eye and Prob2 without (Group 1), and the other half did the opposite (Group 2). Subjects were assigned to these groups randomly. The problems were always given in the same order. Subjects using Eye were disallowed to edit or even see the code in any other application to ensure that they use Eye to debug.
-
(3)
In a few cases, subjects could not debug the problem and gave up. The time for such subjects was then set to a default value larger than the time taken by any successful subject.
-
(4)
Running the tool locally required a library installation that three people refused to do. Such subjects were allowed to debug both problems without Eye. To somewhat offset the increase in number of without Eye measurements, one subject was asked to solve both the problems with Eye.
Group 1 had an average debug time of 1071.25 seconds for Prob1 and 1022.90 seconds for Prob2 while Group 2 had an average debug time of 778.75 seconds for Prob1 and 518.6 seconds for Prob2. Due to random allocation, Group 1 had subjects with better debugging skills than Group 2 on average which is ratified by the average times of two groups - Group 1 took far more time that Group 2 for each of the questions. To account for biases introduced by difference in debugging skills, we calculate the percentage of total debug time the subjects spent on the Prob1 (or equivalently Prob2). We consider these percentages to be random variables and test against the null hypothesis that the variables have the same mean for the two groups. We had to eliminate the four subjects who did not have alternating tool usage for the two problems. The average values for this measure is shown in Table 2. The -value for our data is . These results show that Eye improves debug time.
5.2. Experiment 2
We conducted the experiment as follows:
-
(1)
Subjects were divided into two equal-sized groups, randomly and independent of the previous experiment. One group used Eye for the experiment while the other had no restrictions.
-
(2)
Both the groups were given a problem statement and a correct implementation of its solution. The solution was based on the deque data structure of C++ STL and involved an algorithm new to the subjects.
-
(3)
The subjects were first given 6 minutes to see the visualization (or go through the code) and try to understand how the algorithm is working. They were then given a link to a Google form which contained various questions. They were given 10 minutes to answer the quiz and were allowed to go back to the visualizer or the code during the quiz.
We use the quiz score as a proxy for understanding. Our null hypothesis for RQ2(a) was that there would be no considerable difference in the scores of the two groups. We report the average percentage score for each group in Table 2. Although the group with Eye performed better, the difference was not statistically significant (). Nonetheless, given the biases against Eye (Section 5.4) and the subjects’ overwhelmingly positive opinion (Section 5.3), we can reasonably expect that consistent use of Eye will show positive results. On a hopeful note, Levy et al. (Levy et al., 2003) have shown that performance improvements do manifest when the students become conversant with a tool.
5.3. Anonymous Survey
After the subjects had completed both the experiments, we asked them to fill an anonymous survey which contained two questions corresponding to RQ1(b) and RQ2(b). The subjects were advised that this survey is for estimating the benefits of the tool so they should not bias their answer based on their particular experience in the experiment. The questions and their responses were as follows:
-
Q1(b)
Question: Assuming same time spent on debugging with Eye and without Eye, how much do you think debugging with Eye can help in reducing frustration?
Options: Ranging from 0% to 100%.
Response: Eye reduces frustration by on average.
Conclusion: A visualizer for libraries makes debugging remarkably less frustrating, thereby holding on a student’s interest in programming for a longer time and raising enthusiasm for self-learning. -
Q2(b)
Question: Assuming a time bound on your practice sessions and assuming you only want to understand someone else’s submission of every problem you practice, how much can Eye improve your productivity (number of problems solved)?
Options: Ranging from same to double productivity.
Response: Eye can increase the number of problems solved by a factor of roughly on average.
Conclusion: It demonstrates that students consider Eye useful for code comprehension in that it allows faster understanding of someone else’s code, greatly improving the utility of online programming websites.
| Exp1 (Avg % time) | Exp2 (Avg % score) | ||
|---|---|---|---|
| Prob1 | Prob2 | ||
| Without Eye | 58.3 | 51.4 | 59.2 |
| With Eye | 48.6 | 41.7 | 60.6 |
| -value | 0.0578 | 0.446 | |
5.4. Experimental Biases
-
•
Subjects were disallowed to use regular debugging techniques with Eye. This potentially hampered their ability and added a bias against Eye.
-
•
Informal discussion with subjects after the experiment confirmed our suspicion of familiarity bias against Eye. Many students primarily focused on the code (Figure 2(a)). Features like access highlighting (Figure 2(b)) were intended to reduce dependence on code-reading but were largely ignored.
6. Conclusion
Data Structure libraries are widely used in schools, universities and industries for programming. Visualization for such libraries is the need of the hour. In this paper, we presented a tool Eye, that offered a visual display of inner working of such libraries, thereby helping in learning, debugging and code comprehension. The efficacy of the tool was also tested through an assessment that showed encouraging results with the positive responses to the survey reinforcing its utility in practice. Its design and functionality satisfy the properties that are required for widespread traction.
We believe that Eye will be extremely useful in universities and online courses for teaching purposes, and tweaks can be easily made to suit each course’s requirements. We plan to do a formal study to evaluate its efficacy in teaching when schools reopen and classes start. In addition, extensive deployment on online programming websites can be done through integration with their IDEs (Integrated Development Environment) which requires a change in the display module. Visualizations for more data structures and libraries in languages like Python and Java will lead to a greater adoption and expand its use cases to students learning other programming languages as well.
References
- (1)
- Ahmadzadeh et al. (2005) Marzieh Ahmadzadeh, Dave Elliman, and Colin Higgins. 2005. An Analysis of Patterns of Debugging among Novice Computer Science Students. SIGCSE Bull. 37, 3 (June 2005), 84–88. https://doi.org/10.1145/1151954.1067472
- Ben-Ari et al. (2011) Mordechai Ben-Ari, Roman Bednarik, Ronit Levy, Gil Ebel, Andrés Moreno, Niko Myller, and Erkki Sutinen. 2011. A decade of research and development on program animation: The Jeliot experience. J. Vis. Lang. Comput. 22 (10 2011), 375–384. https://doi.org/10.1016/j.jvlc.2011.04.004
- Cosman et al. (2020) Benjamin Cosman, Madeline Endres, Georgios Sakkas, Leon Medvinsky, Yao-Yuan Yang, Ranjit Jhala, Kamalika Chaudhuri, and Westley Weimer. 2020. PABLO: Helping Novices Debug Python Code Through Data-Driven Fault Localization. In Proceedings of the 51st ACM Technical Symposium on Computer Science Education (Portland, OR, USA) (SIGCSE ’20). Association for Computing Machinery, New York, NY, USA, 1047–1053. https://doi.org/10.1145/3328778.3366860
- Diehl (2005) Stephan Diehl. 2005. Software visualization. In 27th International Conference on Software Engineering (ICSE 2005), 15-21 May 2005, St. Louis, Missouri, USA, Gruia-Catalin Roman, William G. Griswold, and Bashar Nuseibeh (Eds.). Association for Computing Machinery, New York, NY, USA, 718–719. https://doi.org/10.1145/1062455.1062634
- Fitzgerald et al. (2008) Sue Fitzgerald, Gary Lewandowski, Renée McCauley, Laurie Murphy, Beth Simon, Lynda Thomas, and Carol Zander. 2008. Debugging: finding, fixing and flailing, a multi-institutional study of novice debuggers. Computer Science Education 18, 2 (2008), 93–116. https://doi.org/10.1080/08993400802114508 arXiv:https://doi.org/10.1080/08993400802114508
- Gaynor (2019) Alex Gaynor. 2019. RPLY. https://pypi.org/project/rply/
- Gould (1975) J. A. Gould. 1975. Some Psychological Evidence on How People Debug Computer Programs. Int. J. Man Mach. Stud. 7 (1975), 151–170.
- Gould and Drongowski (1974) John D. Gould and Paul Drongowski. 1974. An Exploratory Study of Computer Program Debugging. Human Factors 16, 3 (1974), 258–277. https://doi.org/10.1177/001872087401600308 arXiv:https://doi.org/10.1177/001872087401600308
- Guo (2013) Philip J. Guo. 2013. Online Python Tutor: Embeddable Web-Based Program Visualization for Cs Education. In Proceeding of the 44th ACM Technical Symposium on Computer Science Education (Denver, Colorado, USA) (SIGCSE ’13). Association for Computing Machinery, New York, NY, USA, 579–584. https://doi.org/10.1145/2445196.2445368
- Hendrix et al. (2004) T. Dean Hendrix, James H. Cross, and Larry A. Barowski. 2004. An Extensible Framework for Providing Dynamic Data Structure Visualizations in a Lightweight IDE. SIGCSE Bull. 36, 1 (March 2004), 387–391. https://doi.org/10.1145/1028174.971433
- Hristova et al. (2003) Maria Hristova, Ananya Misra, Megan Rutter, and Rebecca Mercuri. 2003. Identifying and Correcting Java Programming Errors for Introductory Computer Science Students. SIGCSE Bull. 35, 1 (Jan. 2003), 153–156. https://doi.org/10.1145/792548.611956
- Karavirta and Shaffer (2015) Ville Karavirta and Clifford Shaffer. 2015. Creating Engaging Online Learning Material with the JSAV JavaScript Algorithm Visualization Library. IEEE Transactions on Learning Technologies 9 (10 2015), 1–1. https://doi.org/10.1109/TLT.2015.2490673
- Katz and Anderson (1987) Irvin R. Katz and John R. Anderson. 1987. Debugging: An Analysis of Bug-Location Strategies. Human–Computer Interaction 3, 4 (1987), 351–399. https://doi.org/10.1207/s15327051hci0304_2 arXiv:https://www.tandfonline.com/doi/pdf/10.1207/s15327051hci0304_2
- Lahtinen et al. (2005) Essi Lahtinen, Kirsti Ala-Mutka, and Hannu-Matti Järvinen. 2005. A Study of the Difficulties of Novice Programmers. In Proceedings of the 10th Annual SIGCSE Conference on Innovation and Technology in Computer Science Education (Caparica, Portugal) (ITiCSE ’05). Association for Computing Machinery, New York, NY, USA, 14–18. https://doi.org/10.1145/1067445.1067453
- Levy et al. (2003) Ronit Ben-Bassat Levy, Mordechai Ben-Ari, and Pekka A. Uronen. 2003. The Jeliot 2000 Program Animation System. Comput. Educ. 40, 1 (Jan. 2003), 1–15. https://doi.org/10.1016/S0360-1315(02)00076-3
- Lewis and Gregg (2016) Colleen M. Lewis and Chris Gregg. 2016. How Do You Teach Debugging? Resources and Strategies for Better Student Debugging (Abstract Only). In Proceedings of the 47th ACM Technical Symposium on Computing Science Education (Memphis, Tennessee, USA) (SIGCSE ’16). Association for Computing Machinery, New York, NY, USA, 706. https://doi.org/10.1145/2839509.2850473
- Mccauley et al. (2008) Renée Mccauley, Sue Fitzgerald, Gary Lewandowski, Laurie Murphy, Beth Simon, Lynda Thomas, and Carol Zander. 2008. Debugging: A review of the literature from an educational perspective. Computer Science Education 18 (06 2008). https://doi.org/10.1080/08993400802114581
- Michaeli and Romeike (2019) Tilman Michaeli and Ralf Romeike. 2019. Current Status and Perspectives of Debugging in the K12 Classroom: A Qualitative Study. In 2019 IEEE Global Engineering Education Conference (EDUCON). IEEE, New York, NY, USA, 1030–1038. https://doi.org/10.1109/EDUCON.2019.8725282
- Orsega et al. (2012) Michael C. Orsega, Bradley T. Vander Zanden, and Christopher H. Skinner. 2012. Experiments with Algorithm Visualization Tool Development. In Proceedings of the 43rd ACM Technical Symposium on Computer Science Education (Raleigh, North Carolina, USA) (SIGCSE ’12). Association for Computing Machinery, New York, NY, USA, 559–564. https://doi.org/10.1145/2157136.2157296
- Perkins et al. (1986) D. N. Perkins, Chris Hancock, Renee Hobbs, Fay Martin, and Rebecca Simmons. 1986. Conditions of Learning in Novice Programmers. Journal of Educational Computing Research 2, 1 (1986), 37–55. https://doi.org/10.2190/GUJT-JCBJ-Q6QU-Q9PL arXiv:https://doi.org/10.2190/GUJT-JCBJ-Q6QU-Q9PL
- Perscheid et al. (2017) Michael Perscheid, Benjamin Siegmund, Marcel Taeumel, and Robert Hirschfeld. 2017. Studying the Advancement in Debugging Practice of Professional Software Developers. Software Quality Journal 25, 1 (March 2017), 83–110. https://doi.org/10.1007/s11219-015-9294-2
- Rajala et al. (2007) Teemu Rajala, Mikko-Jussi Laakso, Erkki Kaila, and Tapio Salakoski. 2007. VILLE: A Language-Independent Program Visualization Tool. In Proceedings of the Seventh Baltic Sea Conference on Computing Education Research - Volume 88 (Koli National Park, Finland) (Koli Calling ’07). Australian Computer Society, Inc., AUS, 151–159.
- Sirkia (2016) Teemu Sirkia. 2016. Jsvee & Kelmu: Creating and Tailoring Program Animations for Computing Education. In 2016 IEEE Working Conference on Software Visualization (VISSOFT) (Raleigh, NC, USA). IEEE, New York, NY, USA, 36–45. https://doi.org/10.1109/VISSOFT.2016.24
- Sorva (2012) Juha Sorva. 2012. Visual program simulation in introductory programming education; Visuaalinen ohjelmasimulaatio ohjelmoinnin alkeisopetuksessa. G4 Monografiaväitöskirja. Aalto University. http://urn.fi/URN:ISBN:978-952-60-4626-6
- Sorva et al. (2013a) Juha Sorva, Ville Karavirta, and Lauri Malmi. 2013a. A Review of Generic Program Visualization Systems for Introductory Programming Education. ACM Trans. Comput. Educ. 13, 4, Article 15 (Nov. 2013), 64 pages. https://doi.org/10.1145/2490822
- Sorva et al. (2013b) Juha Sorva, Jan Lönnberg, and Lauri Malmi. 2013b. Students’ ways of experiencing visual program simulation. Computer Science Education 23, 3 (2013), 207–238. https://doi.org/10.1080/08993408.2013.807962 arXiv:https://doi.org/10.1080/08993408.2013.807962
- Sorva et al. (2013c) Juha Sorva, Jan Lönnberg, and Lauri Malmi. 2013c. Students’ ways of experiencing visual program simulation. Computer Science Education 23, 3 (2013), 207–238. https://doi.org/10.1080/08993408.2013.807962 arXiv:https://doi.org/10.1080/08993408.2013.807962
- Sorva and Sirkiä (2010) Juha Sorva and Teemu Sirkiä. 2010. UUhistle: A Software Tool for Visual Program Simulation. In Proceedings of the 10th Koli Calling International Conference on Computing Education Research (Koli, Finland) (Koli Calling ’10). Association for Computing Machinery, New York, NY, USA, 49–54. https://doi.org/10.1145/1930464.1930471
- Tanenbaum (2007) Andrew S. Tanenbaum. 2007. Modern Operating Systems (3rd ed.). Prentice Hall Press, USA.
- Zelle (2010) John Zelle. 2010. Python Programming: An Introduction to Computer Science 2nd Edition. Franklin, Beedle & Associates Inc., USA.