Influence of interaction softness in phase separation of active particles
Abstract
Using a minimal model of active Brownian discs, we study the effect of a crucial parameter, namely the softness of the inter-particle repulsion, on motility-induced phase separation. We show that an increase in particle softness reduces the ability of the system to phase-separate and the system exhibit a delayed transition. After phase separation, the system state properties can be explained by a single relevant lengthscale, the effective inter-particle distance. We estimate this lengthscale analytically and use it to rescale the state properties at dense phase for systems with different interaction softness. Using this lengthscale, we provide a scaling relation for the time taken to phase separate which shows a high sensitivity to the interaction softness.
I Introduction
The last two decades witnessed a growing interest in the study of active matter Ramaswamy (2010); Vicsek and Zafeiris (2012); Marchetti et al. (2013), a system microscopically composed of a collection of motile entities that drive the system out-of-equilibrium. The collective behaviour of such active systems has been studied using particle-based numerical models where individual active agents self-propel along a body-fixed polarity vector. The large-scale collective behaviour crucially depends on the mutual interaction. One well-studied class of models involves interaction between the particles via a pairwise potential, affecting only their positions. For such a system, the interplay between activity and repulsion leads to phase separation, forming a dense phase and a dilute phase. This is commonly known as motility induced phase separation (MIPS) Fily and Marchetti (2012); Redner et al. (2013); Buttinoni et al. (2013); van der Linden et al. (2019); Wysocki et al. (2014); Cates and Tailleur (2015). Unlike equilibrium phase transition, MIPS occurs in the absence of any attractive interaction Cates and Tailleur (2015); Digregorio et al. (2018); Caporusso et al. (2020); Stenhammar et al. (2013a); Levis et al. (2017); Klamser et al. (2018); Paliwal and Dijkstra (2020); Mandal et al. (2019a); Caprini et al. (2020); Das and Chelakkot (2020); Das et al. (2020); Lee (2013); Fily et al. (2014); Elgeti and Gompper (2013); Shi et al. (2020); Su et al. (2021); Stenhammar et al. (2013b, 2014).
While the physical principles governing MIPS has been extensively studied before Bialké et al. (2013); Stenhammar et al. (2013b); Farage et al. (2015), a crucial question that remains is how sensitive are they to the softness or deformability of the microscopic entities. The dependence of two-phase coexistence on interaction softness has been observed in passive systems Kapfer and Krauth (2015). To model active colloidal particles that are practically non-overlapping, the Weeks-Chandler-Anderson (WCA) form has been used extensively Weeks et al. (1971). Recent studies have also explored the hard particle limit by reducing the overlap beyond WCA and characterized the complete phase behavior Digregorio et al. (2018). Another interesting limit is to study how an increase in the mutual overlap between the particles affect the collective properties of the system. This limit is relevant from the perspective of microscopic biological entities, such as cells in tissues. Since they are deformable objects, hard potentials may not be a proper representation of the interaction between them. Furthermore, the mechanical properties of the individual entities may vary during the course of development Guo et al. (2017) which can affect their collective properties. To understand how such a variation in the interaction affects the structural, dynamic, and phase properties, we use a minimal model of active Brownian particles and study their collective behaviour by systematically varying the interaction softness. We show that the change in phase behaviour with varying softness can be rescaled by an intrinsic lengthscale, which is the effective inter-particle distance. In the following sections, we discuss the model and the numerical techniques, followed by the results and a discussion of the results.
II Model
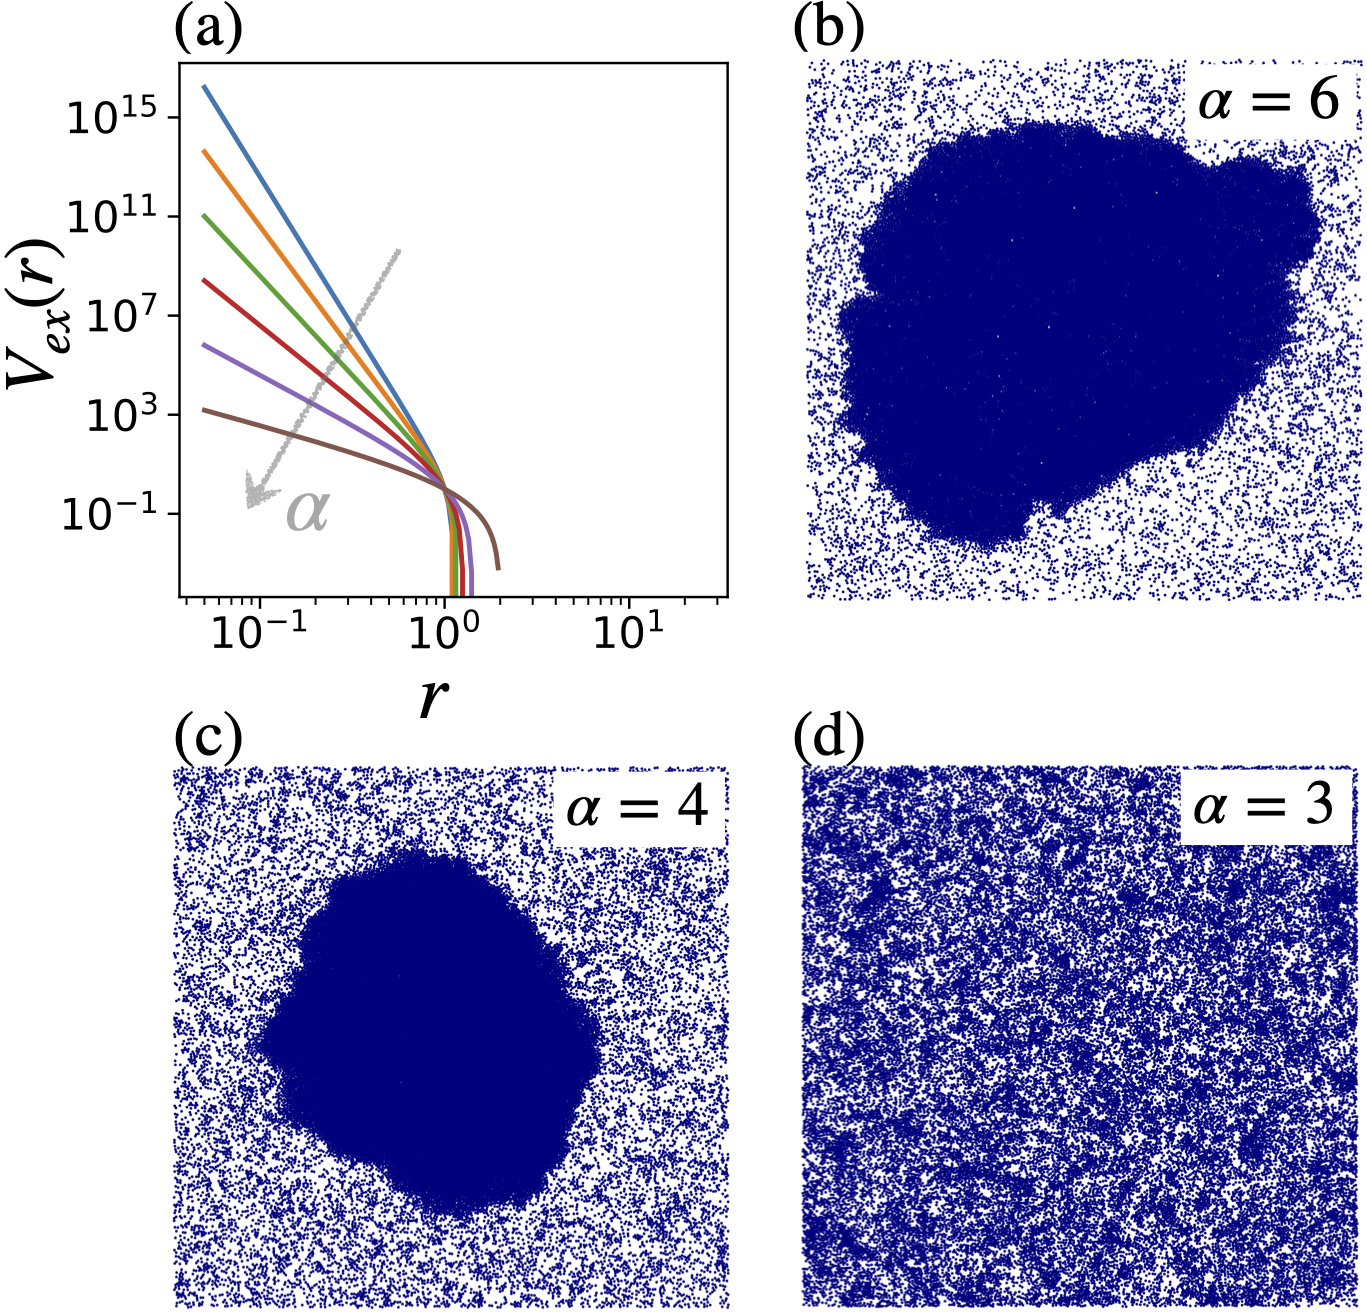
Our numerical model consists of a collection of active Brownian particles in 2D that interact with their neighbors repulsively. The repulsive force between the particles at locations and due to excluded volume interaction is obtained from the generalized WCA potential Zhou and Milner (2018),
| (1) |
where , is the nominal particle diameter, and the characteristic energy of the system is chosen to be . Here is the parameter that controls the particle stiffness; lower denotes soft interaction limit with larger area overlap while upon increasing , the particles become harder and overlap less. The equation of motion of each active particle in non-dimensionalized units is described by the coupled Langevin equations in the overdamped limit (see Appendix A)
| (2) | |||||
| (3) |
Here, and are the Gaussian white noise terms with zero mean and satisfy , and . The direction of self-propulsion for each particle is . Our minimal model has three relevant control parameters: density , the Péclet number Pe, which quantifies the activity strength and the overlap parameter, . Using Eqs. (2–3), we performed Brownian dynamics simulations using an Euler integration step inside a periodic square-box (see Appendix A).
III Results
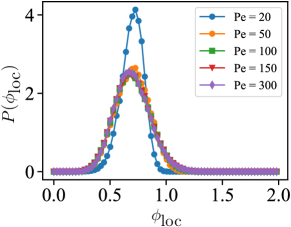
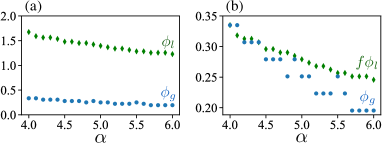
We first study the effect of on density order. We benchmark our numerical study to the WCA case (), where the system exhibits a very clear phase separation Redner et al. (2013). We aim to quantify any deviation from the known results as is decreased below 6. To characterize this, we compute the local density . For a single uniform phase, the density distribution is unimodal while for the phase-separated system is bi-modal. We denote the peak values of the dense and dilute phases as and , respectively.
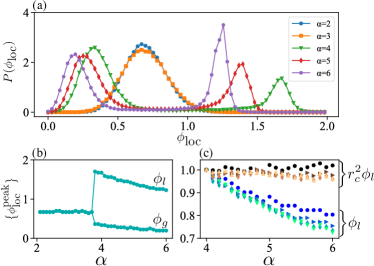
In Fig. 1, we compare for different at and Pe=150. We notice that the phase separation is still observed for (see Fig. 1(a), for and 4). As we decrease even further, we do not see a clear phase separation even when the activity is made very high (see Fig.6, for Pe at and ), except for a very large density ( and Pe ) (see Fig.7). Such a high density is only accessible for particles with large area overlap and we do not make a detailed comparative study here. Interestingly, we also note that as is reduced, there is an overall decrease in the area covered by the dense phase (see Fig.5(b)–(d) in Appendix. A and Fig.8 in Appendix. B). To identify phase transition, we plot the corresponding peak values of as a function of (see Fig. 1(b)). We observe, the creation of two distinct phases and for . Similar disappearance of coexistence with increasing particle softness has been observed earlier in 2D equilibrium systems as well for an inverse power-law pair interaction Kapfer and Krauth (2015).
After phase separation, there is a systematic shift in , and to lower values, as is increased. In Fig. 1(c), we have plotted as a function of for different values of Pe at , which clearly shows this monotonic decrease. This is due to the fact that a smaller leads to a decrease in the average inter-particle distance causing an increase in density. To explain this increase in for lower , we use a mean-field description proposed earlier Bialké et al. (2013). Within this framework the density dependent effective speed is given by , where is the number density and quantifies the local force-balance in the system and is given by , where is the effective pair interaction and , where is the stationary pair-distribution function. For a single homogeneous phase, and for a given , is constant. To estimate the effective cut-off distance between the particles, we consider the scenario where the dense phase has already been formed and we write . Furthermore, within the dense phase , we therefore set . Note that a systematic estimate of would involve an estimation of (and hence ) from simulation data, for different . Here we make a simplifying assumption , since the dense phase has a crystalline structure where shows the first peak around . This leads to:
| (4) |
Here , which in general depends on . Eq. 4 can be used to estimate if is known. As a first approximation we assume to be a constant foo . To see if this could justify the behavior of , we estimate using Eq. 4 and using as a fit parameter. We rescale . For , we notice that the dependence on disappears as is approximately a constant (see Fig. 1(c)).
We also note in Fig. 1(a)) that with increasing , the distribution of the dense phase about becomes narrower, indicating a larger uniformity within the dense phase at higher . Finally, we note that although for we do not observe a phase coexistence (see Fig. 1(b)), the overall phase properties at large Pe are different from a homogeneous phase typically observed at low Pe. Here the system exhibits a complex spatiotemporal dynamics, where we observe a large number of small local clusters that are not stable over time (see Fig.5(d) in Appendix A and Movie 1 in Sanoria et al. for and Pe = 150).
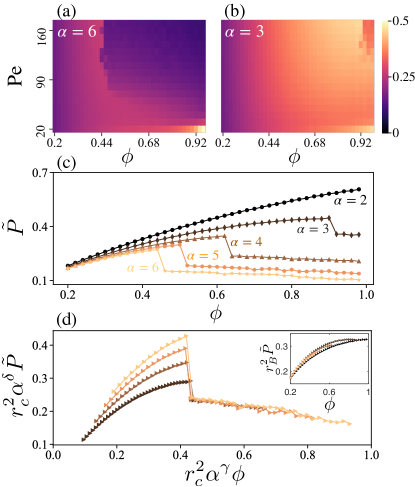
The appearance of dense phase and its dependence on can be understood by quantifying the pressure in presence of activity Takatori et al. (2014a, b); Solon et al. (2015a, b); Winkler et al. (2015); Takatori and Brady (2016). We calculate the normalized pressure , where is the total pressure, calculated by combining the contributions from both thermal fluctuations and activity Winkler et al. (2015) for the our system (See Eq. 7 in Appendix C), and Winkler et al. (2015). Here is the total area in non-dimensional units. In Fig. 2 we show for (Fig. 2(a)) and 3 (Fig. 2(b)) as a function of and Pe. At , we observe a drop in the value of in the -Pe parameter space where the system phase separates. For , the phase separation is shifted to a large value of and Pe. This is visible in Fig. 2(b) — we observe a small region in -Pe parameter space where drops to a smaller value. For a given Pe, the dependence of the normalized pressure is summarized in Fig 2(c). We see how, with decreasing , the critical density , shift to higher densities until it disappears. This systematic shift of the critical point, can be explained as the following: we note that for all , , where and are the number of particles in the dense and dilute phases. Based on the numerical evidence (see Fig.9 in Appendix. D), we assume , where is a scale-factor with a weak dependence on . This leads to , where is an unknown function that explicitly depends on the area occupied by the dilute phase (see Appendix D). Making a simplifying assumption that have a power-law dependence on , we scale the -axis, i.e. for different values where phase separation has been observed. Using the value calculated previously using Eq. 4, and for , we are able to collapse the transition points along the -axis indicating that the critical density also follows the same scaling (see Fig. 2(d)). The small value of the exponent is consistent with our prediction that is weakly dependent on (see Appendix D). The bulk pressure in the dense phase also follows a similar scaling, i.e. with (Fig. 2(d)), implying the qualitatively same dependence as seen for the case of . Note that before phase separation, can be rescaled by the Boltzmann diameter derived from equilibrium considerations Zhou and Milner (2018). Here is a collision parameter that depends on both the softness and the density. We estimate from Zhou and Milner (2018) (see Appendix E) and rescale . As shown in the inset of Fig. 2(d), the curves collapse reasonably well, especially at low values, as expected.
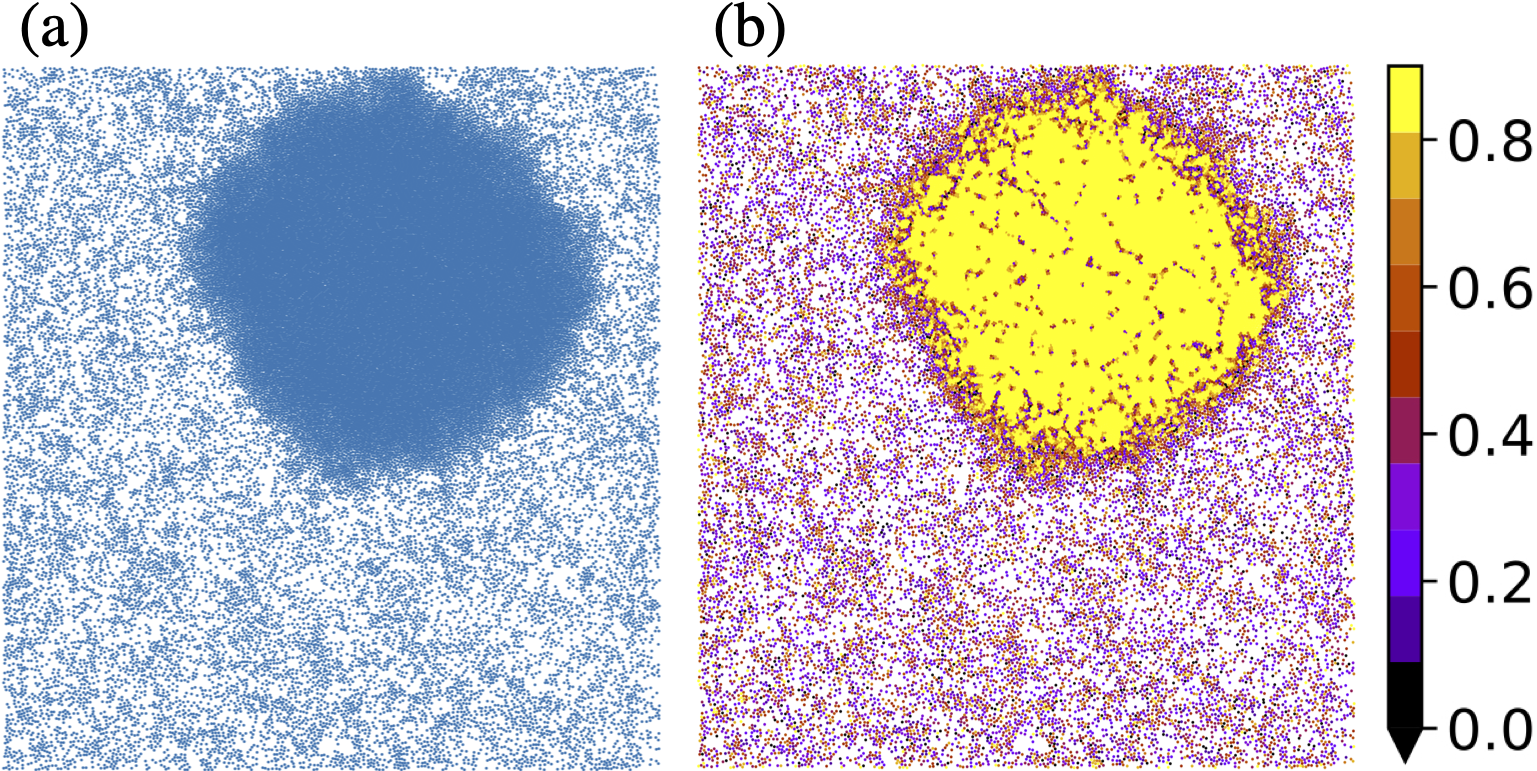
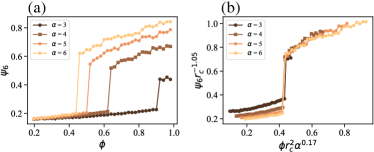
Having looked into the dependence of density ordering and the bulk pressure on the overlap parameter , we now study how the structural properties of the system is affected by changing this parameter. For this purpose we study the global orientational order, , where , calculated at the location of every particle . Here is the total number of neighbours of the particle obtained using Voronoi tessellation, is the angle between the vector and the reference axis.
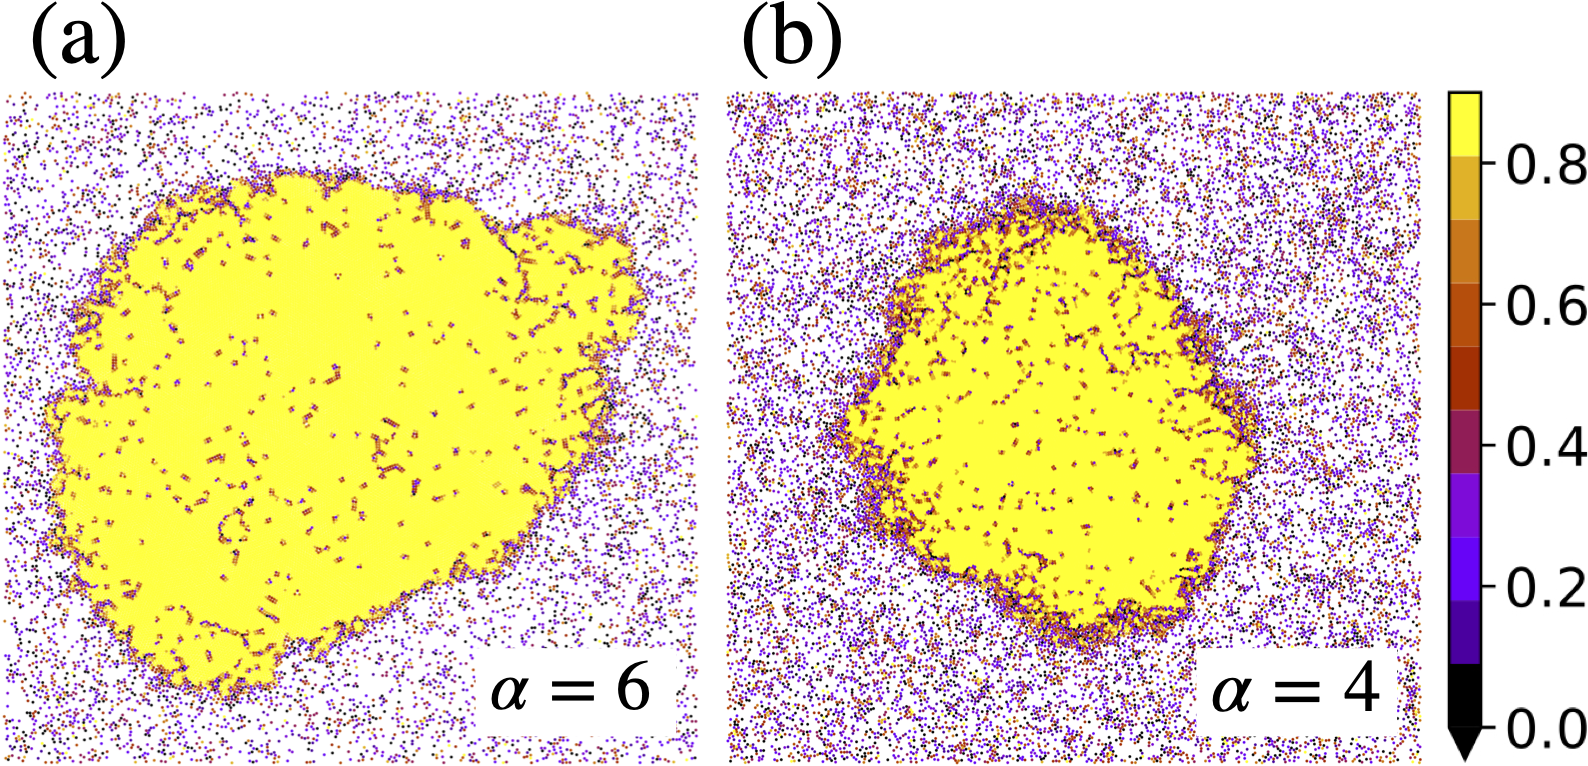
In Fig. 3(a)–(c) we compare the heatmaps in the –Pe plane for , and 3. We notice that the phase separated domain, indicated by a large () value, gradually decreases in size in the -Pe plane as is varied from . Furthermore, the phase boundary (defined by ) also gradually shifts towards higher values of Pe and , as is decreased. There is also an increase in the sixfold symmetry within the dense phase for larger , due to an increase in the cluster size (see Fig.8 in Appendix. B). This behaviour is consistent with our observation of the local density distributions shown in Fig. 1 for . Using the same scaling relation for in the pressure analysis (Fig 2(d)), we rescaled , which leads to a collapse of for different (See Fig.10(b) in Appendix. F). We also note that after phase separation (See Fig.10(b)).
We also note for , at low Pe and large , there is an enhanced global order (see Fig. 3(a)). Such behavior has also been observed recently in systems of active Brownian particles, even with lesser overlap Digregorio et al. (2018). This feature is not seen for and 3 (Fig. 3(e)–(f)) since the larger overlap between the particles destroys the hexatic order at such high densities.
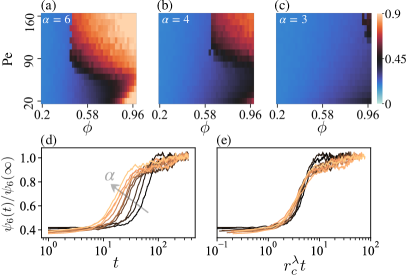
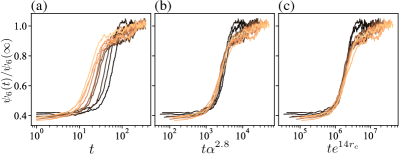
To understand how the emergence of phase ordering changes with varying , we plot versus time starting from a homogeneous phase for different values of . While a more detailed approach to address this question will involve the study of coarsening dynamics, the dynamics can also be used to investigate this transition. In Fig. 3(d), we plot as a function of time, where is the steady-state value after the system has already phase-separated. We notice that with a decrease in , the system takes longer to phase-separate. To quantify this dependence on particle softness, we apply a rescaling of the time axis, . We use instead of for rescaling (see Fig.11(b) in Appendix. F), since it is an intrinsic length-scale, which can be obtained in general for any form of the potential used. This rescaling leads to a data collapse for (see Fig. 3(e)). The large value of indicative of sensitive dependence of the transition time on . This dependence can also be of an exponential form (see Fig.11(c) in Appendix. F).
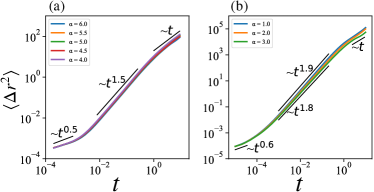
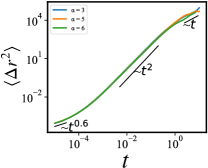
Our study so far has revealed the dependence of the static quantities, such as , , , and on , in a phase-separated system, through a system lengthscale, , defined for the dense-phase. Also, it shows that the time required for the system to phase separate is sensitive to . A natural question arises whether the transport properties within the dense-phase also vary with . To study this, we compute the mean-square displacement (MSD) of one or a few tagged particles inside the dense phase. In Fig. 4, we show the MSD of a tag-particle, inside the dense phase, as a function of lag-time () for , Pe=150, and . We note that the MSD for shows good agreement with the reported results Redner et al. (2013). Interestingly, the MSD behaviour did not show any noticeable change as is varied. This indicates that once the system phase-separates, unlike the static quantities, the particle dynamics is almost independent of . This observation is further strengthened by the MSD behaviour for and 2 at and Pe=150, where there is no single large cluster but the formation of many small local dynamic clusters. In this case, for the same values of and Pe, we notice a deviation in the MSD behaviour (see Fig. 4(b)), qualitatively different from the previous observations in both the dilute phase and dense phase (see Fig.12 in Appendix. G), indicating a different collective dynamics which needs to be studied in detail.
IV Conclusion
Our study reveals that an increase in interaction softness has an inhibiting effect on phase separation and strongly influences the collective phase ordering: the critical density above which the system phase separates shifts to higher values, while the waiting time for observing a phase separation, above the critical density, also increases. The phase separation in the system is manifested by an intrinsic lengthscale, which is the effective inter-particle distance . The changes in state properties with interaction softness in the dense phase can be explained using . Using a mean-field theory Bialké et al. (2013), we make an approximate estimate of which explain the dependence of the dense phase reasonably well. Using a relation between the dense and dilute phase densities obtained numerically, we show that the critical density at the onset of phase ordering and the corresponding bulk pressure can be scaled using the same with power-law corrections. Before the phase separation, the rescaling can be achieved reasonably by the Boltzmann diameter, . To characterize the temporal efficiency as a function of , we also studied the time evolution of the global hexatic order for different . We found that an increase in particle softness (or decrease in ), significantly slows down the approach to transition and scales as . However, the transport properties within the dense phase show no variation with . This indicates that once the system phase separates, the dynamic behaviour inside the dense phase is weakly dependant on the microscopic interaction parameters. Note that the disappearance of phase separation has been observed in inertial systems, with an increase in Pe to ratio Suma et al. (2014); Mandal et al. (2019b). It would be interesting to explore, how an increase in interaction softness modify this behaviour.
The dependence of phase separation on interaction softness has relevance beyond simple models of active matter. The mutual interactions in many active biological systems are not hard-core in nature and may vary across systems. Our study thus may provide a physical basis for phase ordering in such systems. This behaviour need not be specific to the particular form of interaction we have used, and we expect to observe similar behaviour with other forms of short-ranged repulsive interactions.
Acknowledgements
The authors thank Debasish Chaudhuri, Dibyendu Das, and Mithun K. Mitra for insightful discussions. MS thank CSIR, India for financial support. AN and RC acknowledges Industrial Research and Consultancy Centre (IRCC) at IIT Bombay, India, and Science and Engineering Research Board (SERB), India (Project No. ECR/2016/001967, ECR/2017/000744, and SB/S2/RJN-051/2015) for financial support. We thank IIT Bombay HPC facility (Spacetime2).
Appendix A Simulation Method
Our numerical model consists of a collection of active Brownian particles in 2D that interact with its neighbors repulsively. The repulsive force between the particles at locations and due to excluded volume interaction is obtained from the generalized WCA potential Zhou and Milner (2018) given in Eq. 1.
Each particle is represented by a position vector and moves with self-propelled constant speed along a direction , where . The particle direction are evolved randomly in time and equation of motion of active particle is described by the coupled and over-damped Langevin equations
| (5) | |||||
| (6) |
Eqs. (5–6) are non-dimensionalized to obtain Eqs. (2–3) using the particle diameter , thermal energy T and relaxation time . The characteristic energy of the system is chosen to be . Here, is the active self propulsion speed of each particle and is the mobility parameter, is translational diffusion coefficient, and , is the rotational diffusion coefficient. and are the Gaussian white noise terms with mean zero and variance unity and satisfies , and .
The effect of activity is studied by varying the Péclet number (Pe), a non-dimensional parameter defined as . Our minimal model has three relevant control parameters: density , activity strength Pe, and interaction parameter . To characterize the system, these parameters are varied such that, , Pe and .
We performed Brownian dynamics simulations using Euler integration step inside a periodic square-box for to particles and with Brownian time step upto . The translational diffusion coefficient is chosen to be throughout.
Appendix B Phase behavior for the case of
Appendix C Active pressure for 2D active system
Total pressure of a 2D active system with area and total number of particles , can be calculated using the following expression Winkler et al. (2015)
| (7) |
Here the first term on the right hand side is the thermal contribution and the second term is the swim pressure. Here, is defined as the mean speed of the active particle. The last term is contribution due to inter-particle interaction. The last two terms in Eq. 7 is called the total active pressure.
Appendix D Critical Density
Let be the critical density at which phase-separation occurs. We assume there are number of particles in the dense (liquid) phase and in the dilute (gas) phase. Let and be the area of the dense and dilute phases respectively. Therefore, can be written as
| (8) |
By comparing the values of and obtained numerically (see Fig. 9), we note that both shows a similar dependence on and we can assume . Here is weakly dependent on with magnitude . Substituting this in Eq. 8, we obtain
| (9) |
Here and weakly dependent on and is also a function of with magnitude less than unity. Therefore the quantity is expected to have a weak dependence on as well.
Appendix E Scaling using the Boltzmann diameter
Taking the collision energy to be of the order of , one can derive the typical interparticle distance, namely the Boltzmann parameter given by Zhou and Milner (2018)
| (10) |
Here is a collision parameter and depends on both the and . We assume a functional form for the collision parameter where and are constant exponents. Using the simulation data reported in Ref. Zhou and Milner (2018) (Table-I)), we obtain , and . The estimated values of using a form of leads to a reasonably good scaling of (shown in the inset of Fig. 2(d)) before phase-separation.
Appendix F Hexatic order parameter scaling
Similar to the versus plot shown in Fig. 3(c), also shows a sharp change in value at a critical density value (see Fig. 10(a)). Using the same scaling as used in Fig. 3(d) (i.e.), we scale the -axis. The result is shown in Fig. 10(b). We also scaled the , which leads to a collapse of the value after phase separation.
In Fig. 3(d) and (e) of the maintext, we studied the dynamics of phase ordering by plotting as a function of time for different . We noticed that the system exhibit a delayed transition which scales as . We note two important points here: (1) The temporal scaling is applied using since it is an intrinsic length-scale and can be obtained in general for any form of the potential used. We show in Fig. 11(b), that the same collapse can be obtained by using a scaling of the form . (2) The large value of the scaling exponent , mainly indicates the sensitive dependence of the transition time on ; the underlying dynamics may not be necessarily scale-free. The large exponent value may also imply that this dependence is exponential. To show this, we use an exponential scaling of the form (see Fig. 11(c)) which also leads to a very good collapse of the data.
Appendix G MSD Plots at low density
Unlike at high density, as discussed in the maintext (Fig. 4), the system exhibit ballistic transport at intermediate time scales, when the system is kept a low density (), independent of the value of for different . This is shown in Fig. 12. In the long-time limit, the dynamics again becomes diffusive as expected. At short time scales, the dynamics is driven by thermal fluctuations but sub-diffusive due to interparticle interactions.
Appendix H Simulation movie
Movie 1: Steady state dynamics for overlap parameter at Pe=150 and . Although the system does not phase separate, the dynamics is not uniform and exhibit formation of local transient clusters.
References
- Ramaswamy (2010) S. Ramaswamy, Annual Review of Condensed Matter Physics 1, 323 (2010).
- Vicsek and Zafeiris (2012) T. Vicsek and A. Zafeiris, Physics reports 517, 71 (2012).
- Marchetti et al. (2013) M. C. Marchetti, J. F. Joanny, S. Ramaswamy, T. B. Liverpool, J. Prost, M. Rao, and R. A. Simha, Rev. Mod. Phys. 85, 1143 (2013).
- Fily and Marchetti (2012) Y. Fily and M. C. Marchetti, Phys. Rev. Lett. 108, 235702 (2012).
- Redner et al. (2013) G. S. Redner, M. F. Hagan, and A. Baskaran, Phys. Rev. Lett. 110, 055701 (2013).
- Buttinoni et al. (2013) I. Buttinoni, J. Bialké, F. Kümmel, H. Löwen, C. Bechinger, and T. Speck, Phys. Rev. Lett. 110, 238301 (2013).
- van der Linden et al. (2019) M. N. van der Linden, L. C. Alexander, D. G. A. L. Aarts, and O. Dauchot, Phys. Rev. Lett. 123, 098001 (2019).
- Wysocki et al. (2014) A. Wysocki, R. G. Winkler, and G. Gompper, EPL (Europhysics Letters) 105, 48004 (2014).
- Cates and Tailleur (2015) M. E. Cates and J. Tailleur, Annual Review of Condensed Matter Physics 6, 219 (2015).
- Digregorio et al. (2018) P. Digregorio, D. Levis, A. Suma, L. F. Cugliandolo, G. Gonnella, and I. Pagonabarraga, Phys. Rev. Lett. 121, 098003 (2018).
- Caporusso et al. (2020) C. B. Caporusso, P. Digregorio, D. Levis, L. F. Cugliandolo, and G. Gonnella, Physical Review Letters 125, 178004 (2020).
- Stenhammar et al. (2013a) J. Stenhammar, A. Tiribocchi, R. J. Allen, D. Marenduzzo, and M. E. Cates, Physical review letters 111, 145702 (2013a).
- Levis et al. (2017) D. Levis, J. Codina, and I. Pagonabarraga, Soft Matter 13, 8113 (2017).
- Klamser et al. (2018) J. U. Klamser, S. C. Kapfer, and W. Krauth, Nature communications 9, 1 (2018).
- Paliwal and Dijkstra (2020) S. Paliwal and M. Dijkstra, Physical Review Research 2, 012013 (2020).
- Mandal et al. (2019a) S. Mandal, B. Liebchen, and H. Löwen, Physical Review Letters 123, 228001 (2019a).
- Caprini et al. (2020) L. Caprini, U. M. B. Marconi, and A. Puglisi, Physical Review Letters 124, 078001 (2020).
- Das and Chelakkot (2020) S. Das and R. Chelakkot, Soft Matter 16, 7250 (2020).
- Das et al. (2020) S. Das, S. Ghosh, and R. Chelakkot, Physical Review E 102, 032619 (2020).
- Lee (2013) C. F. Lee, New Journal of Physics 15, 055007 (2013).
- Fily et al. (2014) Y. Fily, A. Baskaran, and M. F. Hagan, Soft Matter 10, 5609 (2014).
- Elgeti and Gompper (2013) J. Elgeti and G. Gompper, EPL (Europhysics Letters) 101, 48003 (2013).
- Shi et al. (2020) X.-q. Shi, G. Fausti, H. Chaté, C. Nardini, and A. Solon, Physical Review Letters 125, 168001 (2020).
- Su et al. (2021) J. Su, H. Jiang, and Z. Hou, New Journal of Physics 23, 013005 (2021).
- Stenhammar et al. (2013b) J. Stenhammar, A. Tiribocchi, R. J. Allen, D. Marenduzzo, and M. E. Cates, Phys. Rev. Lett. 111, 145702 (2013b).
- Stenhammar et al. (2014) J. Stenhammar, D. Marenduzzo, R. J. Allen, and M. E. Cates, Soft matter 10, 1489 (2014).
- Bialké et al. (2013) J. Bialké, H. Löwen, and T. Speck, EPL (Europhysics Letters) 103, 30008 (2013).
- Farage et al. (2015) T. F. F. Farage, P. Krinninger, and J. M. Brader, Phys. Rev. E 91, 042310 (2015).
- Kapfer and Krauth (2015) S. C. Kapfer and W. Krauth, Phys. Rev. Lett. 114, 035702 (2015).
- Weeks et al. (1971) J. D. Weeks, D. Chandler, and H. C. Andersen, The Journal of Chemical Physics 54, 5237 (1971).
- Guo et al. (2017) M. Guo, A. F. Pegoraro, A. Mao, E. H. Zhou, P. R. Arany, Y. Han, D. T. Burnette, M. H. Jensen, K. E. Kasza, J. R. Moore, et al., Proceedings of the National Academy of Sciences 114, E8618 (2017).
- Zhou and Milner (2018) Y. Zhou and S. T. Milner, Soft matter 14, 7075 (2018).
- (33) In Eq. 4, the main dependence comes from the terms other than , so it is reasonable to assume to be a constant .
- (34) M. Sanoria, R. Chelakkot, and A. Nandi, See Supplemental Movie for details .
- Takatori et al. (2014a) S. C. Takatori, W. Yan, and J. F. Brady, Physical review letters 113, 028103 (2014a).
- Takatori et al. (2014b) S. C. Takatori, W. Yan, and J. F. Brady, Phys. Rev. Lett. 113, 028103 (2014b).
- Solon et al. (2015a) A. P. Solon, Y. Fily, A. Baskaran, M. E. Cates, Y. Kafri, M. Kardar, and J. Tailleur, Nature Physics 11, 673 (2015a).
- Solon et al. (2015b) A. P. Solon, J. Stenhammar, R. Wittkowski, M. Kardar, Y. Kafri, M. E. Cates, and J. Tailleur, Phys. Rev. Lett. 114, 198301 (2015b).
- Winkler et al. (2015) R. G. Winkler, A. Wysocki, and G. Gompper, Soft Matter 11, 6680 (2015).
- Takatori and Brady (2016) S. C. Takatori and J. F. Brady, Current opinion in colloid & interface science 21, 24 (2016).
- Suma et al. (2014) A. Suma, G. Gonnella, D. Marenduzzo, and E. Orlandini, EPL (Europhysics Letters) 108, 56004 (2014).
- Mandal et al. (2019b) S. Mandal, B. Liebchen, and H. Löwen, Phys. Rev. Lett. 123, 228001 (2019b).