Us vs. Them: A Dataset of Populist Attitudes, News Bias and Emotions
Abstract
Computational modelling of political discourse tasks has become an increasingly important area of research in natural language processing. Populist rhetoric has risen across the political sphere in recent years; however, computational approaches to it have been scarce due to its complex nature. In this paper, we present the new Us vs. Them dataset, consisting of 6861 Reddit comments annotated for populist attitudes and the first large-scale computational models of this phenomenon. We investigate the relationship between populist mindsets and social groups, as well as a range of emotions typically associated with these. We set a baseline for two tasks related to populist attitudes and present a set of multi-task learning models that leverage and demonstrate the importance of emotion and group identification as auxiliary tasks.
1 Introduction
Political discourse is essential in shaping public opinion. The tasks related to modelling political rhetoric have thus been gaining interest in the natural language processing (NLP) community. Many of them focused on automatically placing a piece of text on the left-to-right political spectrum. For instance, much research has been devoted to detecting bias in news sources (Kiesel et al., 2019) and predicting the political affiliation of politicians (Iyyer et al., 2014) and social media users, more generally (Conover et al., 2011; Pennacchiotti and Popescu, 2011; Preoţiuc-Pietro et al., 2017). Other works conducted a more fine-grained analysis, identifying the framing of political issues in news articles (Card et al., 2015; Ji and Smith, 2017). Recently, the field has also turned attention towards modelling the spread of political information in social media, such as detecting fake news or political perspectives (Li and Goldwasser, 2019; Chandra et al., 2020; Nguyen et al., 2020).
Populism has taken the spotlight in political communication in recent years. Various countries around the globe have experienced a surge of populist rhetoric (Inglehart and Norris, 2016) in both the public and political space. Despite this, approaches to computational modelling of populist discourse have so far been scarce. Due to the flexible nature of populism, annotating populist rhetoric in text is challenging, and the existing research in this area has relied on small-scale analysis by experts (Hawkins et al., 2019). In this paper, we present a new dataset111Available at https://github.com/LittlePea13/UsVsThem of Reddit comments annotated for populist attitudes and the first large-scale computational models of this phenomenon. We rely on research in social- and behavioural sciences (e.g., political science and social psychology) to operationalise a definition of populism and an annotation procedure that allows us to capture and generalise the crucial aspects of populist rhetoric at scale.
In social sciences, populism is essentially described as a not fully developed political ideology and a series of background beliefs and techniques (Aslanidis, 2016), traditionally centred around the Us vs. Them dichotomy. In one of the first attempts to fully define populism Mudde (2004), it is described as a thin ideology around the distinction between ‘the people’, which includes the ‘Us’, and ‘the elites’ describing the ‘Them’, and with politics being a tool for ‘the people’ to achieve the common good or ‘the popular will’ (Kyle and Gultchin, 2018; Rodrik, 2019). Through different platforms, populism uses this rhetoric that revolves around social identity (Hogg, 2016; Abadi, 2017) and the Us vs. Them argumentation (Mudde, 2004). While right-wing populism tends to be characterised by fear, resentment, anger and hatred, left-wing populism is associated with shame and guilt (Otjes and Louwerse, 2015; Salmela and von Scheve, 2017a). Moreover, emotions have been shown to be crucial in shaping public opinion more generally (Marcus, 2002, 2003; Demertzis, 2006; Rico et al., 2020).
The design of our annotation scheme and the dataset are inspired by this research, particularly the link between populist rhetoric and both social identity and emotions. Our dataset consists of comments posted on Reddit that explicitly mention a social group. We collect the comments posted in response to news articles across the political spectrum. Through crowd-sourcing, we annotate supportive, critical and discriminatory attitudes towards the group, as well as a range of emotions typically associated with populist attitudes. At the same time, given the relevance of news in the spread of such mindsets, we investigate the relationship between news bias and the Us vs. Them rhetoric. Our data analysis reveals interesting interactions between populist attitudes, specific social groups and emotions.
We also present a series of computational models, automatically identifying populist attitudes, based on RoBERTa (Liu et al., 2019). We experiment in a multi-task learning framework, jointly modelling supportive vs. discriminatory attitudes towards a group, the identity of the group and emotions towards the group. We demonstrate that joint modelling of these phenomena leads to significant improvements in detection of populist attitudes.
2 Related work
2.1 Psychology research on populism
Populist rhetoric revolves around social identity (Hogg, 2016; Abadi, 2017; Marchlewska et al., 2018; Bos et al., 2020) and the Us vs. Them argumentation (Mudde, 2004). Social identity explores the relations of individuals to social groups. Turner and Reynolds (2010) study the evolution of research into social identity and explain the Us vs. Them as an inter-group phenomenon, exposing its relation to social identity where the “self is hierarchically organised and that it is possible to shift from intra-group (‘we’) to inter-group (‘us’ versus ‘them’) and vice versa.”
Emotions constitute a part of the populist rhetoric and have been essential for information processing and the formation of (public) opinion among citizens (Marcus, 2002; Götz et al., 2005; Demertzis, 2006). While social identity and socio-economic factors have been considered primary indicators of populism’s growth (Rooduijn and Burgoon, 2018), emotional factors have lately become a focus within empirical studies, particularly regarding the reactions and spread of populist views Hameleers et al. (2017). Specific appraisal patterns have characterised emotions, i.e. an adverse event for which one blames the other is felt as anger - a pattern of appraisals is referred to as Core Relational Themes (Smith and Lazarus, 1993; Lazarus, 2001), which are the central (therefore core) harm or benefit that underlies each of the negative and positive emotions (Smith and Lazarus, 1993; Moors et al., 2013). Latest attempts to scrutinise populism from the communication science and social psychological perspective have described populist communication and language (Abadi et al., 2016; Rico et al., 2017) and demonstrated its operationalisation through experimental research (Wirz et al., 2018) as being successful in inducing emotions (Bakker et al., 2020). According to the concept of media populism (Krämer, 2014; Mazzoleni and Bracciale, 2018), media effects can further evoke hostility toward the perceived ‘elites’ and (ethnic/religious) minorities, as it contributes to the construction of social identities, such as in-groups and out-groups (i.e., Us vs. Them).
2.2 Modelling political discourse in NLP
Handcrafted features such as word-frequency (Laver et al., 2003) were initially the base of NLP approaches to model political data. Thomas et al. (2006) introduced the Convote dataset of US congressional speeches, and applied an support-vector machine (SVM) classifier leveraging discourse information to identify policy stances in it. One of the first uses of neural networks on political text was the work of Iyyer et al. (2014), who used a recurrent neural network (RNN) to identify the party affiliation on the Convote dataset. Li and Goldwasser (2019) detected the political perspective of news articles using a long short-term memory (LSTM) and a graph convolutional network (GCN) on user data from Twitter. Other research investigated the framing effect in news articles, which is a mechanism that promotes a particular perspective (Entman, 1993). Card et al. (2015) presented the Media Frame Corpus, which explores policy framing within news articles. Ji and Smith (2017) developed a discourse-level Tree-RNN model to identify the framing in each article, by using this corpus dataset. Huguet Cabot et al. (2020) addressed this task by leveraging emotion and metaphor detection in an MTL setup. Other works have also explored sentence-level framing (Johnson et al., 2017; Hartmann et al., 2019).
Hate speech detection is not limited to the analysis of political discourses. However, it is related to exposing populist rhetoric in digital communication (Meret and Pajnik, 2017; Estelles and Castellví Mata, 2020). Several NLP approaches (Mishra et al., 2020), as well as recent shared tasks (Zampieri et al., 2019, 2020) have been proposed to tackle this widespread problem.
While political bias and framing have been widely explored, research on modelling populist rhetoric is still in its nascent stages. Previous work in this area focused on a general description of populism to determine whether a particular text, such as a party manifesto or a political speech contains what is understood as populist rhetoric or attitudes (Hawkins, 2009; Rooduijn and Pauwels, 2011; Manucci and Weber, 2017). Manual annotation was necessary to perform this analysis, often by experts, which also limited the scope and amount of data used, while the resulting datasets are not sufficiently large to train current machine learning models. Furthermore, the description of what constitutes populist rhetoric is still diffuse and covers many different aspects. Hawkins et al. (2019) used holistic grading to assess whether a text is populist or not, to later determine the degree of ‘populism’ of individual political leaders, thus creating the only existing dataset of populist rhetoric, the Global Populist Database.
3 Dataset creation
Data collection.
By annotating Reddit comments that refer to a social group, we monitored how online discussions target them and whether the text showed a positive or negative attitude towards that social group, ranging from support to discrimination. While this process did not ensure capturing the complexity behind the Us vs. Them rhetoric, we detected comments directed at certain groups (out-groups) and the attitude towards them within an online community (in-group). We restricted this to six specific groups that populist rhetoric has targeted as an out-group, Immigrants, Refugees, Muslims, Jews, Liberals and Conservatives. Current research has shown these groups are common targets of populism in the US, UK and across Europe Inglehart and Norris (2016); Mudde and Kaltwasser (2018). Note that to annotate sufficient comments per group we limit the current work to six groups, which is by no means a complete list of targeted groups. We encourage future research to broaden the scope of groups covered.
We chose to extract data from Reddit, (1) due to its availability through the Pushshift repository222https://pushshift.io/ (Baumgartner et al., 2020) and the Google Bigquery service, (2) its social identity dynamics (in-group vs. out-group) as close-nit communities created by sub-Reddits, (3) its nature as a social news aggregation platform, and (4) that it has been shown to encourage toxic communication between users and hate speech towards social groups Massanari (2017); Salminen et al. (2020); Munn (2020). To filter the data for annotation, we followed several steps. (1) We identified submissions in Reddit which shared a news article from a news source listed at the AllSides website333https://www.allsides.com/unbiased-balanced-news, (2) we extracted comments which are direct replies to the submission where both the news article title and the comment match any of the keywords for our groups. Keywords were devised using online resources from the Anti Defamation League444https://www.adl.org/ as well as by consulting social scientists. The full list of keywords can be found in Appendix A Table 4. (3) We selected comments with a minimum of 30 words and a maximum of 250 words, and sampled from specific periods during which each group was actively discussed on Reddit. See Appendix A Table 3 for details. (4) We removed comments that contained keywords from multiple social groups to make the annotation process more straightforward. (5) We randomly sampled 300 comments per group and news source bias according to AllSides (left, centre-left, centre, centre-right, right), resulting in a total of 9000 Reddit comments. Note that the bias is not directly related to individual comments, but rather to the news article the comment responded to.
Annotation procedure.
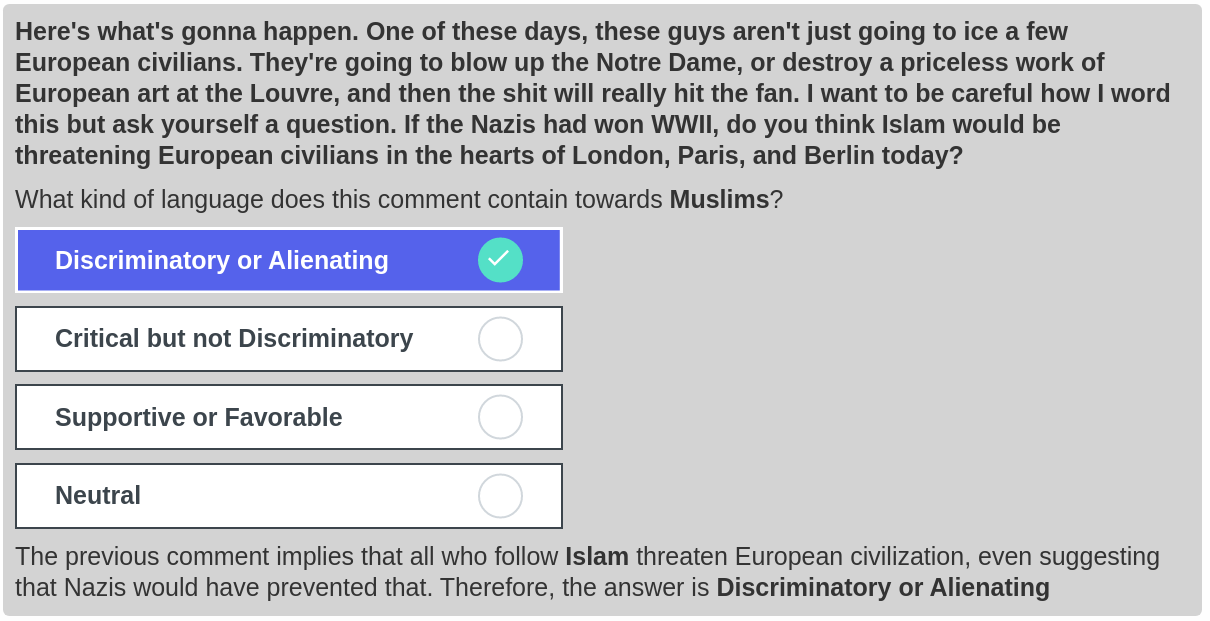
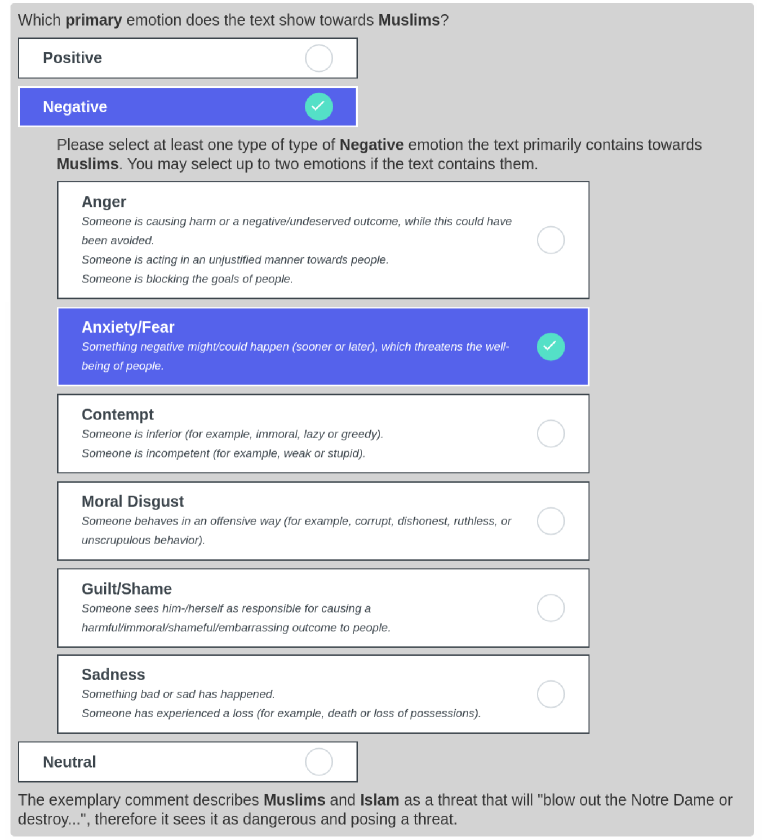
To capture the Us vs. Them rhetoric, we asked: What kind of language does this comment contain towards _group_?, where _group_ corresponds to the specific social group that comment refers to. Respondents had four options: Discriminatory, Critical, Neutral or Supportive. An extended description and an example as presented to annotators can be found in Appendix A.2, and Figure 5. We asked annotators a second question to capture the emotions expressed towards the group in the same comment. We extended Ekman’s model of 6 Basic Emotions (Ekman, 1992) to a 12-emotions model, which includes a balanced set of positive and negative sentiments. Specifically, we included emotions previously shown to be associated with populist attitudes (Demertzis, 2006). We also provided the annotators with a brief description of each emotion, inspired by the concept of Core Relational Themes (Smith and Lazarus, 1990). The positive emotions are Gratitude, Happiness, Hope, Pride, Relief and Sympathy, and the negative emotions are Anger, Fear, Contempt, Sadness, Disgust and Guilt. Detailed descriptions can be found in Appendix A.2 along with an example 6. The annotation was conducted on Amazon Mechanical Turk (MTurk) and its framework can be accessed here.
Annotation reliability.
Once the MTurk annotation was completed, we deployed the CrowdTruth 2.0 toolkit (Dumitrache et al., 2018) to assess the quality of annotations and to identify unreliable workers. CrowdTruth includes a set of metrics to analyse and obtain probabilistic scores from crowd-sourced annotations. Worker Quality Score (WQS) is a metric that measures each worker’s performance, by leveraging their agreement with other annotators and the difficulty of annotation. The Media Unit Annotation Score (UAS) is given for each comment and possible answer, indicating the probability with which each option could be the gold label. Finally, Media Unit Quality score (UQS) describes the quality of annotation for each comment. We removed annotations by workers with a WQS lower than and those with high disagreement after manually checking their responses, and recomputed the metrics. We removed comments left with only one annotator and comments with a UQS lower than . This resulted in 4278 comments with 5+ annotators, and 2564 comments with less, which constitute our final dataset.
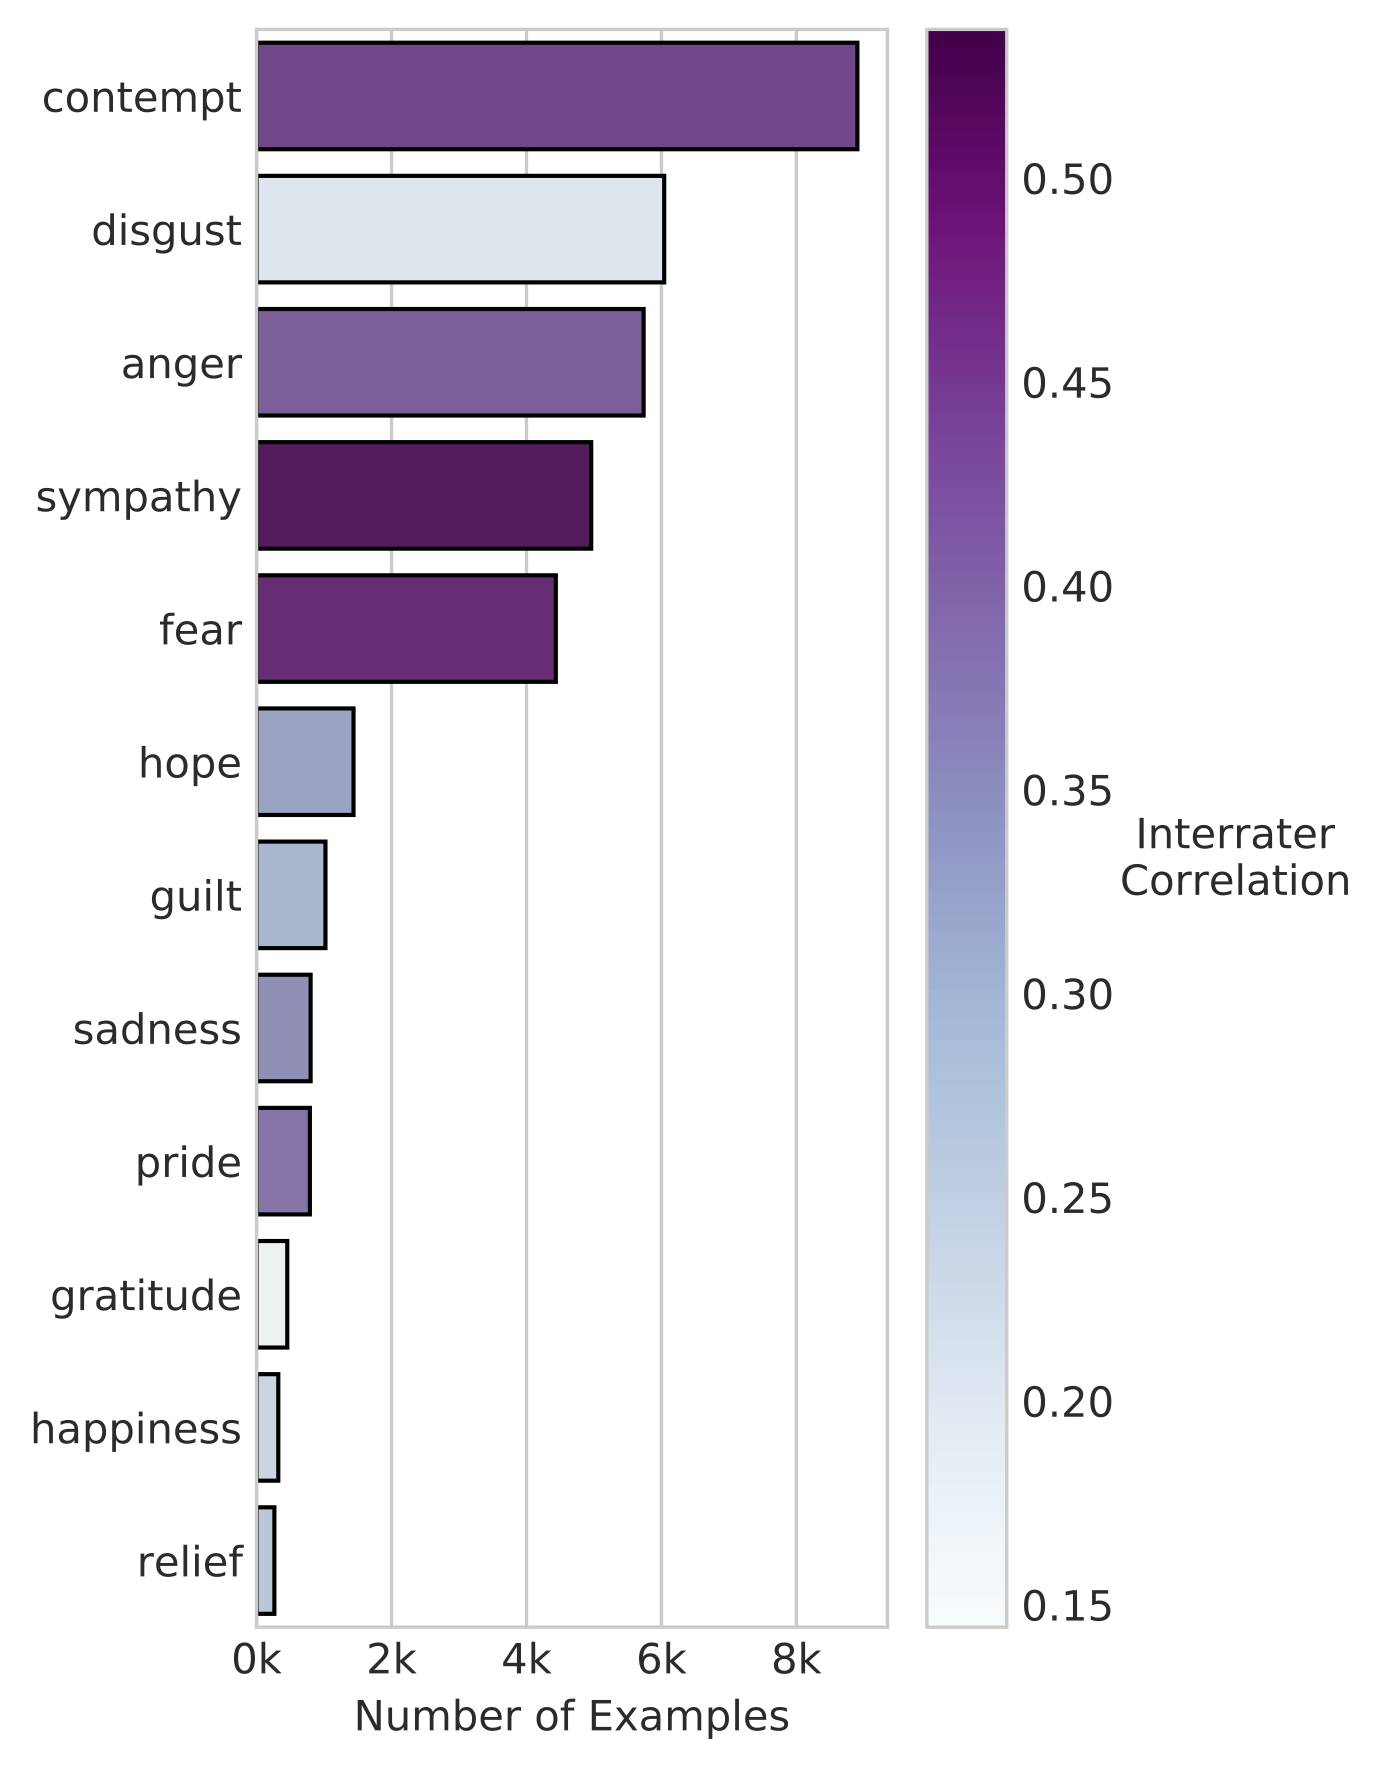
Following the same procedure as Demszky et al. (2020), we computed inter-rater correlation (Delgado and Tibau Alberdi, 2019) by using Spearman correlation. We took the average of the correlation between each annotator’s answers and all other annotators’ average answers that labelled the same items. We obtain a range between 0.5 and 0.13 per emotion. The lowest agreement is for Relief (0.13), in line with Demszky et al. (2020), where the lowest value for correlation agreement being 0.16, and 0.17 for Relief. The full distribution can bee found in Section A.3 Figure 7.
Of course Dems are stealing the elections. They are playing by a different set of rules - being ruthless and violent. Dems take no prisoners and show no mercy to their enemies. The sooner GOP realizes it, the better. Because we have to up our game. If things go this way, we have only one way to save this country - Martial Law and kick every single liberal out! Label UsVsThem Group Emotions Discriminatory Liberals Contempt, Disgust & Fear You do realize it’s sad to celebrate the US cutting the number of refugees down, right? These are people who come here seeking a safe haven from the violence or despair of their home countries, and we’re turning them away. Label UsVsThem Group Emotions Supportive Refugees Sympathy
4 Data analysis
4.1 UsVsThem scale
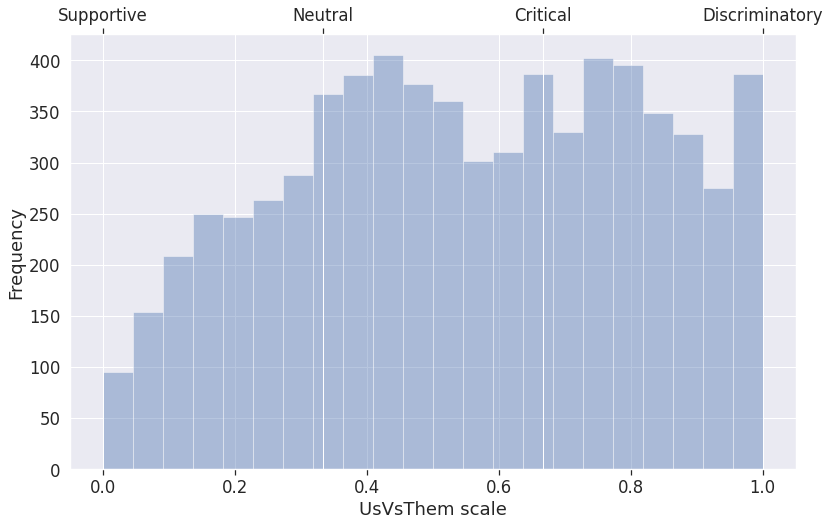
For the Us vs. Them question, we aggregated the answers into a continuous scale. To obtain a score for each comment, we computed the CrowdTruth UAS for each of the labels assigned to it and then take a weighted sum. We assigned the weight of to the Supportive label, to Neutral, to Critical and to Discriminatory. The frequency distribution of comments on this scale can be seen in Section A.4 Figure 8. From now on, we will refer to it as the UsVsThem scale.
The scale is skewed, with an overall mean of . Although our data selection was random across the selected news sources and groups, there are more comments with negative attitudes towards selected groups than positive or neutral ones due to its nature and our keyword selection.
We performed a two-way ANOVA (Analysis of Variance) test (Fujikoshi, 1993) on news bias and social groups as independent variables and the UsVsThem scale as the dependent variable to see whether the interactions between groups and news bias are significant. One-way tests show statistical significance. Interestingly, there was a statistically significant interaction between the effects of social groups and bias on the UsVSThem scale, . Values can be found in Section A.4 Table 5. Therefore, we explored the interaction between them and the influence of news bias on how each group is perceived. We performed a Tukey HSD test to check for significance between means in the UsVsThem scale.
Social groups.
There were differences between groups in terms of the UsVsThem scale when looking at the comment frequency distributions in Figure 2. For Refugees, the distribution was relatively flat as they received a similar amount of positive and negative attitude comments. Immigrants showed a similar distribution with fewer comments in the higher end, i.e. the group received less discrimination than Refugees. Despite the two share many inherent similarities, these differences may be explained by negative media coverage of Refugees portrayed as a threat and being attributed to negative attitudes. Muslims received a higher amount of discriminatory comments than any other group. On the other hand, Conservatives showed a similar mean, due to a very high amount of critical comments. Liberals also received a relatively high amount of critical comments. Both share moderately low tails, as they received less support and discrimination. Finally, Jews showed lower critical and discrimination values, with most values around Neutral, having the lowest mean value of all social groups. These variations translate into a significant () difference between the means of each group, except for Conservatives and Muslims, and for Liberals and Refugees.
News source bias.
In this case, the bias was not directly associated with the comment itself. However, differences in the distribution of comments and the out-group attitudes based on the original article’s bias can be observed, as shown in Figure 2. Moreover, means increased from the centre-left to the right bias. Interestingly, there was no symmetry at the centre bias, contrary to the Horseshoe Theory (Hanel et al., 2019), which argues both ends of the political spectrum closely resemble one another. In terms of significant differences, all biases were significantly different from the right bias (), and there was a significant difference between centre-left and centre-right (). The remaining groups showed no significant difference.
Groups and news source bias.
In line with the above-mentioned bias effect, there was almost always a significant difference between right and centre-right bias and the rest for each group. Only right bias showed a distinct high value and a negative attitude towards Immigrants, which even exceeds those towards Refugees. With the exception of the attitude towards Conservatives, centre, centre-left and left showed lower degrees of negative attitude towards any of the groups. Full results can be seen in Section A.4 Tables 6 and 9.
4.2 Emotions
Instead of using CrowdTruth for emotions, we considered an emotion as being present in the comment provided that at least 1/4 of annotators selected it. In case more than half of annotators marked that comment as Neutral, it was labelled as Neutral. This way, a comment can contain more than one emotion, except for Neutral. Unless specified otherwise, in this subsection Neutral refers to emotionally neutral.
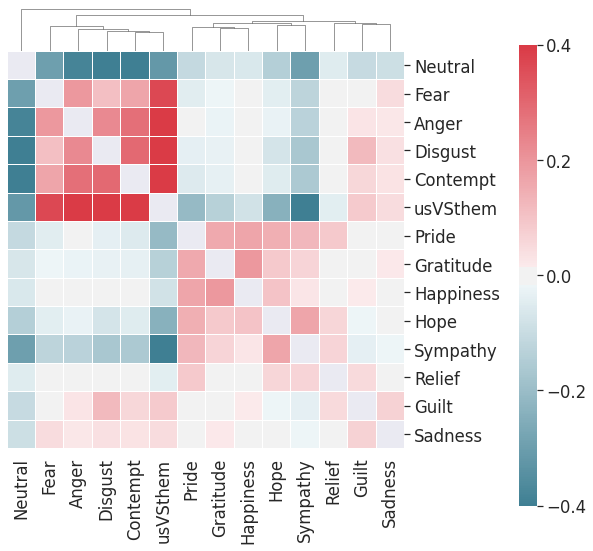
In Figure 3 we present the correlations between the values for each emotion dimension and the UsVsThem scale across all comments, in the same fashion as Demszky et al. (2020). We show the hierarchical relations at the top, demonstrating which emotions interact more strongly with each other. The frequency of emotions in our dataset is as follows: Anger 1724, Contempt 2538, Disgust 1843, Fear 1136, Gratitude 70, Guilt 170, Happiness 59, Hope 307, Pride 174, Relief 37, Sadness 122, Sympathy 1139, Neutral 2094.
Emotions and the UsVsThem scale.
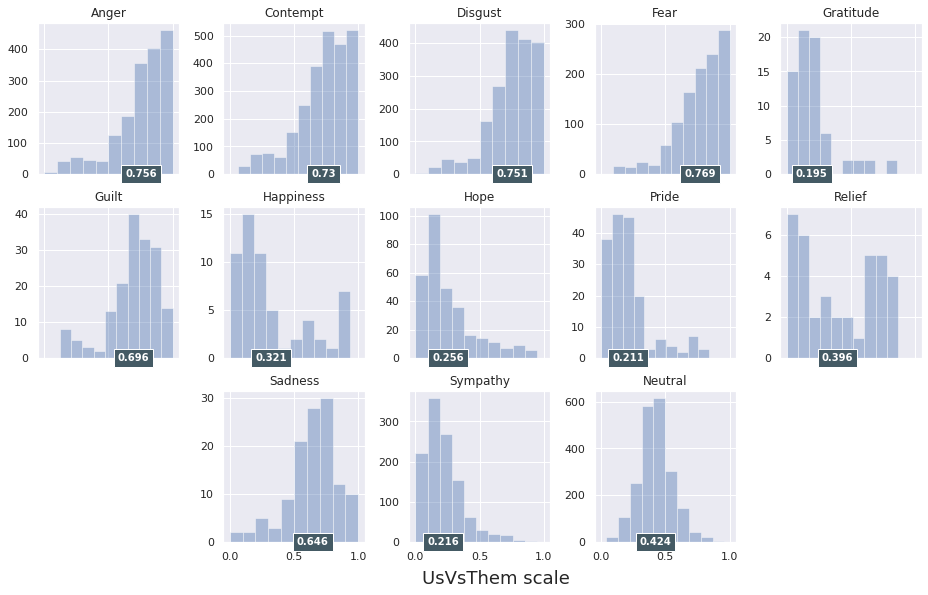
We were interested in the interaction between emotions and social identity by exploring how the UsVsThem scale is shaped for each emotion. Not surprisingly, comments with negative emotions showed a higher value on the UsVsThem scale and a high correlation with it, except for Guilt and Sadness. Contempt showed the strongest correlation, while Anger and Fear showed a higher proportion of Discriminatory comments. Guilt and Sadness, on the other hand, are characterised by a lower amount of comments in the Discriminatory range. In line with these results, the UsVsThem scale had a negative correlation with Sympathy and Neutral comments, and while Sympathy was the most frequent positive emotion, other emotions displayed a very similar relation to the UsVsThem scale. These results are visualised in Figure 3 including the UsVsThem scale and the distributions are summarised in Figure 10 in Section A.4.
Emotions and groups.
We used a two-sided proportion z-test to check for significant differences since emotions are discrete variables. More than 25% of comments towards Muslims and Refugees showed Fear, with no significant difference between the two, followed by Immigrants at 21.5% and other groups at less than 10%. Another notable finding is that Contempt (47.7%) and Disgust (44.4%) were significantly higher towards Conservatives, particularly the latter, which for other groups never exceeded 30% of comments. Sympathy for Liberals (6.5%) and Conservatives (6.9%) was significantly lower when compared to other groups. Hope was present in a significantly higher number of comments for Liberals (7.9%). The values for all proportions can be found in Appendix Section A.4 Table 7.
Emotions and bias.
Not many differences between biases were found. Most salient was the right bias showing a higher value in all negative emotions, significantly for Anger (31.5%), Contempt (43.4%) and Fear (21.9%). All proportion values can be found in Section A.4 Table 8.
5 Modelling populist rhetoric
5.1 Main tasks
Our models’ main focus was to assess to which degree a social group is viewed as an out-group and whether in a negative or discriminatory manner. Our annotation procedure provided a scale from Supportive to Discriminatory for each comment. While this scale is artificial and highly dependent on our task’s context, it provides a good indication of how strongly a social group is targeted in social media comments.
Regression UsVsThem.
In our models, we explored two different main tasks. The first task was to predict the values on the UsVsThem scale in a regression model. This scale provides a score for each comment, which illustrates the attitude towards a social group mentioned in the comment ranging from Supportive (closer to 0) to Discriminatory (closer to 1). Values in between depict an intermediate attitude, Neutral lies at , and Critical at . By predicting the score, we modelled the out-group attitude of each comment. We used of the data as the test set, and as the validation set.
Classification UsVsThem.
Our second task was to classify each comment in a binary fashion as whether the comment shows a negative attitude towards a group, i.e., Critical or Discriminatory, or not, i.e., Neutral or Supportive. This task resulted in a relatively balanced dataset, with of Critical or Discriminatory comments. We used the same splits as before.
5.2 Auxiliary tasks
Emotion detection.
Interactions between populist rhetoric and emotions have been explored in political psychology through surveys and behavioural experiments (Fischer and Roseman, 2007; Tausch et al., 2011; Salmela and von Scheve, 2017b; Redlawsk et al., 2018; Rollwage et al., 2019; Nguyen, 2019; Roseman et al., 2020). This is consistent with our findings in section 4 and further motivates modelling emotions in the context of populist rhetoric. For each comment, emotions were annotated as a Boolean vector. For our task, some emotions were rarely annotated or only present alongside more frequent ones. They increased the difficulty of the task while not providing relevant information. To simplify the auxiliary task, we considered the 8 most common emotions, Anger, Contempt, Disgust, Fear, Hope, Pride, Sympathy and Neutral.
Group identification.
In the work of Burnap and Williams (2016), types of hate speech were differentiated based on race, religion, etc., and models were trained specifically on those categories. In ElSherief et al. (2018), data-driven analysis of online hate speech explored in profundity the differences between directed and generalised hate speech, and Silva et al. (2016) analysed the different targets of hate online. In our case, the Us vs. Them rhetoric metric showed significant differences for each group as we have seen in the previous section. Therefore, we hypothesised that the information bias (Caruana, 1993) the group identification task provides will help understand the Us vs. Them rhetoric aimed at the different social groups, which motivated its role as an auxiliary task.
5.3 Model architecture
We used the Robustly Optimized BERT Pretraining Approach (RoBERTa) (Liu et al., 2019) in its base variant as provided by Wolf et al. (2019).
Multi-task learning.
In all setups, tasks shared the first eleven transformer layers of RoBERTa. The final 12th layer was task-specific, followed by a classification layer that used the hidden representation of the <s> token, to output a prediction. We used scheduled learning, where the losses of each task are weighted and changed during training. We also experimented with a three-task MTL model where the two auxiliary tasks are learned simultaneously.
We assigned three different loss weights associated with each task, for the main task, either regression or binary classification; for emotion detection; for group identification. For MTL with one auxiliary task, , while for the three-task MTL: .
Regression UsVsThem.
We used Mean Squared Error loss with a sigmoid activation function for the main task. For emotion identification as the auxiliary task, we used Binary Cross-Entropy loss, and for the group identification, we used Cross-Entropy loss, both with sigmoid activation. For all MTL models, there was a warm-up period of epochs, after which the weight is changed to and , and for the three-task setting.
Classification UsVsThem.
We used Cross-Entropy loss with a sigmoid activation function for the main task. The remaining tasks were kept the same as with the Regression case above. For all MTL models, there was a warm-up period of epochs, after which the weight was changed to and , and for the three-task setting.
5.4 Experimental setup
Regression UsVsThem.
We report model performance in terms of Pearson correlation coefficient (R). We found the optimal STL hyperparameters using the validation set: a learning rate of , a lineal warm-up period of 2 epochs and dropout of . The batch size used was 128. These hyperparameters were kept constant across our experiments for the regression UsVsThem task. For the emotion detection MTL setup, and . For the groups MTL, and . For the three-task MTL model we obtained optimal validation performance by setting and both , which was the equivalent of for the two-task MTL.
Classification UsVsThem.
Similarly, we ran a grid-search to find the best hyperparameters for the classification setup. For the STL model, we obtained a learning rate of , a warm-up of 2 epochs and an extra dropout of . For emotions-MTL, and . For the groups-related MTL, and . For the three-task MTL, , , and . For both regression and classification, we report performance averaged over 10 different seeds.
5.5 Results
| STL | MTL, Emotion | MTL, Group | MTL, Emotion & Group | |
|---|---|---|---|---|
| Pearson R | 0.545 0.005 | 0.553 0.009 | 0.557 0.012 | 0.570 0.009 |
| Accuracy | 0.705 0.006 | 0.710 0.009 | 0.711 0.007 | 0.717 0.004 |
Results are presented in Table 1. We find that MTL outperforms STL in both versions of our task.
Regression UsVsThem.
The STL baseline showed a 0.545 Pearson R to the gold score. When emotion identification was used as an auxiliary task, the performance increased by almost one point, to 0.553. The groups MTL setup showed a higher increase, up to 0.557. Both improvements were significant compared to the STL model, using the Williams test (Williams, 1959). Perhaps all the more interesting is that the three-task MTL model achieved the highest performance, even without its hyperparameters being specifically tuned as with the other setups. It resulted in a Pearson R of 0.570, i.e. over 2 points performance increase over STL, a statistically significant improvement over both STL and the remaining two MTL approaches.
Classification UsVsThem.
Although not shown in the table, the accuracy baseline for a majority class classifier would be 0.550. All models highly surpassed that, with the real baseline set by the STL setup achieving a 0.705 accuracy. Results for the MTL approaches were similar to what we observed in the regression task. Emotion-MTL increased performance by half a point, to 0.710, as did group-MTL, with 0.711. The best performing model was again the three-task MTL, at 0.717, yielding a statistically significant improvement over STL, using the permutation test.
5.6 Analysis
| Reddit Comment | |||||||
| 1 | Does anyone else think it’s absurd that we have Muslims serving in our congress? Literal foreign agents acting as if they hold the interests of the country and its people at heart? They never talk about the will of the people. It’s always some bullshit about how white men (who founded and built this country) are evil and we need to let in more 3rd worlders who want to bomb and kill us. This is literal clown world tier nonsense. | ||||||
| 2 | You proud of yourselves, making 3 year olds represent themselves in immigration court? You fucking proud of that insanity? All for the sake of keeping out a gang that has already been in America for a long time, meanwhile regular home grown white kids are murdering dozens of their own classmates but goddam, at least they we’re legal, amirite | ||||||
| 3 | Conservatives have every right to revolt. If we don’t get our way we will destroy the country. I hope the left keeps pushing us to provoke a civil war. Or maybe Commiefornia should secede. Maybe that’s the best thing that can happen, a complete break up. That way we can have our ethnostate, and the left can have their degenerate cesspool without us paying taxes for it. The US is dead anyway. It’s time to burn this diverse shithole to the ground. It will be the ultimate proof that diversity doesn’t work. | ||||||
| Label | MTL, E. & G. | MTL, Emo. | MTL, Groups | STL | Group | Emotions | |
| 1 | Muslims | Anger, Contempt, Disgust & Fear | |||||
| 2 | Immigrants | Sympathy | |||||
| 3 | Conservatives | Hope & Pride | |||||
Qualitative and error analysis.
We selected comments with higher values on the scale where MTL improved the STL baseline predictions for the regression task. Comments with high emotion valence were better predicted by models that included emotion identification. Comments that had group-specific rhetoric with references to (derogatory) terms such as ‘illegal aliens’ were better predicted by models that incorporated group identification (see the first example in Table 2).
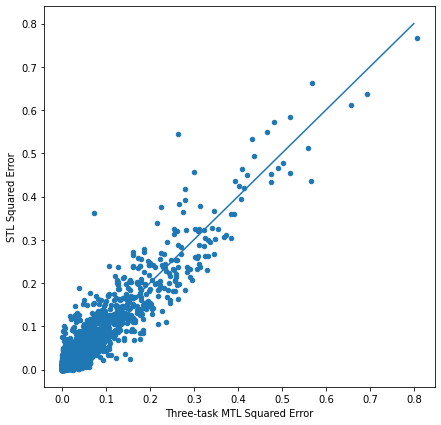
The standard deviation of the difference between the STL and the three-task predictions was just . This means that MTL helped capture nuanced information that improved prediction; however, comments with high squared error for STL still showed similar behaviour for MTL models. This aspect is shown in Appendix A.5 Figure 11. All models’ squared error showed a pair-wise Pearson correlation higher than . This observation prompted us to investigate comments with a high squared error. We identified three different sources. (1) Comments with emotionally charged language, slurs, or insults, which may often be associated with a more negative attitude towards a group, were mispredicted due to not being negative towards such group or being used ironically or satirically. (see second example in Table 2). (2) Reference to multiple groups: we removed comments that included keywords from similar groups, however it was impossible to account for all the terms that may refer to other groups. Hence, there are comments for which the prediction seems to be about a target different than the one at annotation time (see the third example in Table 2). More examples can be found in Section A.5 Table 9. (3) Annotation error is expected in any crowd-sourced annotation. While these were not as frequent as to pose a problem during training, they did occur as incorrect model predictions that can mistakenly decrease performance.
Analysis of model representations.
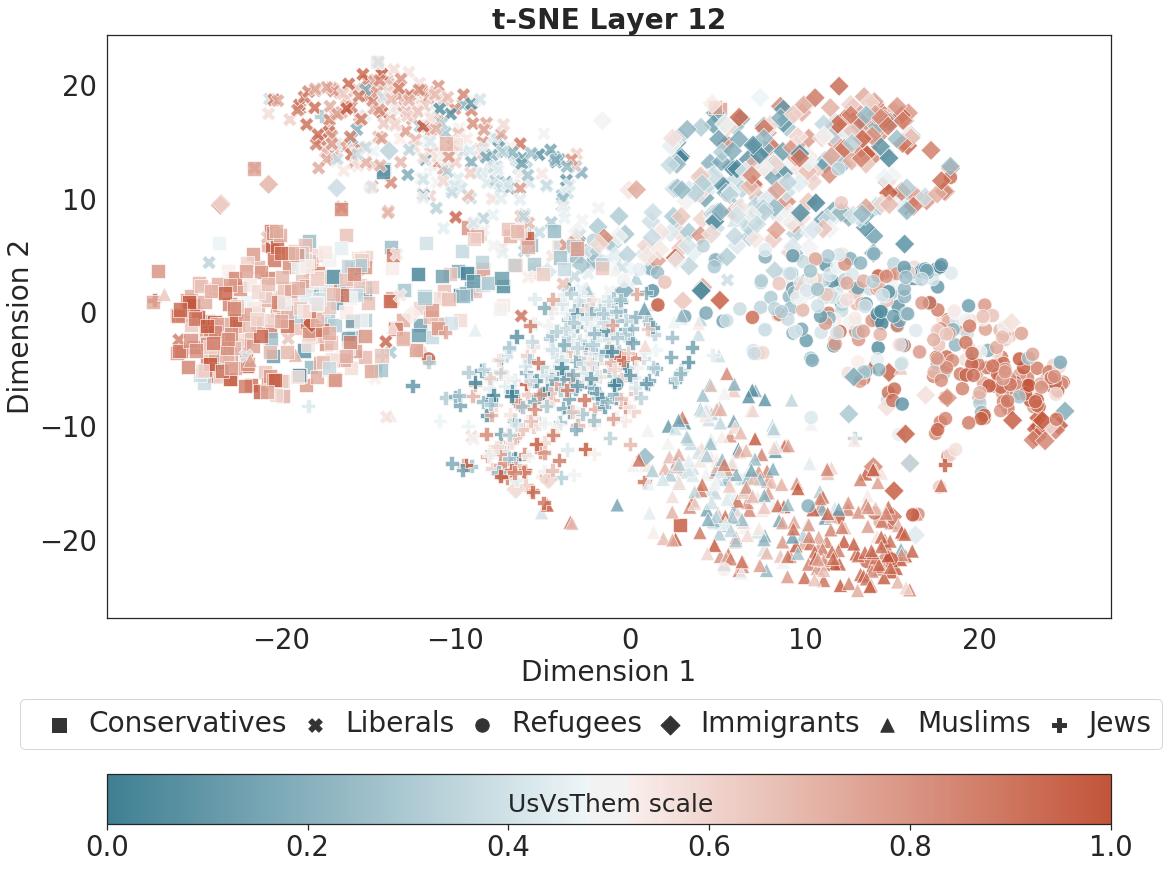
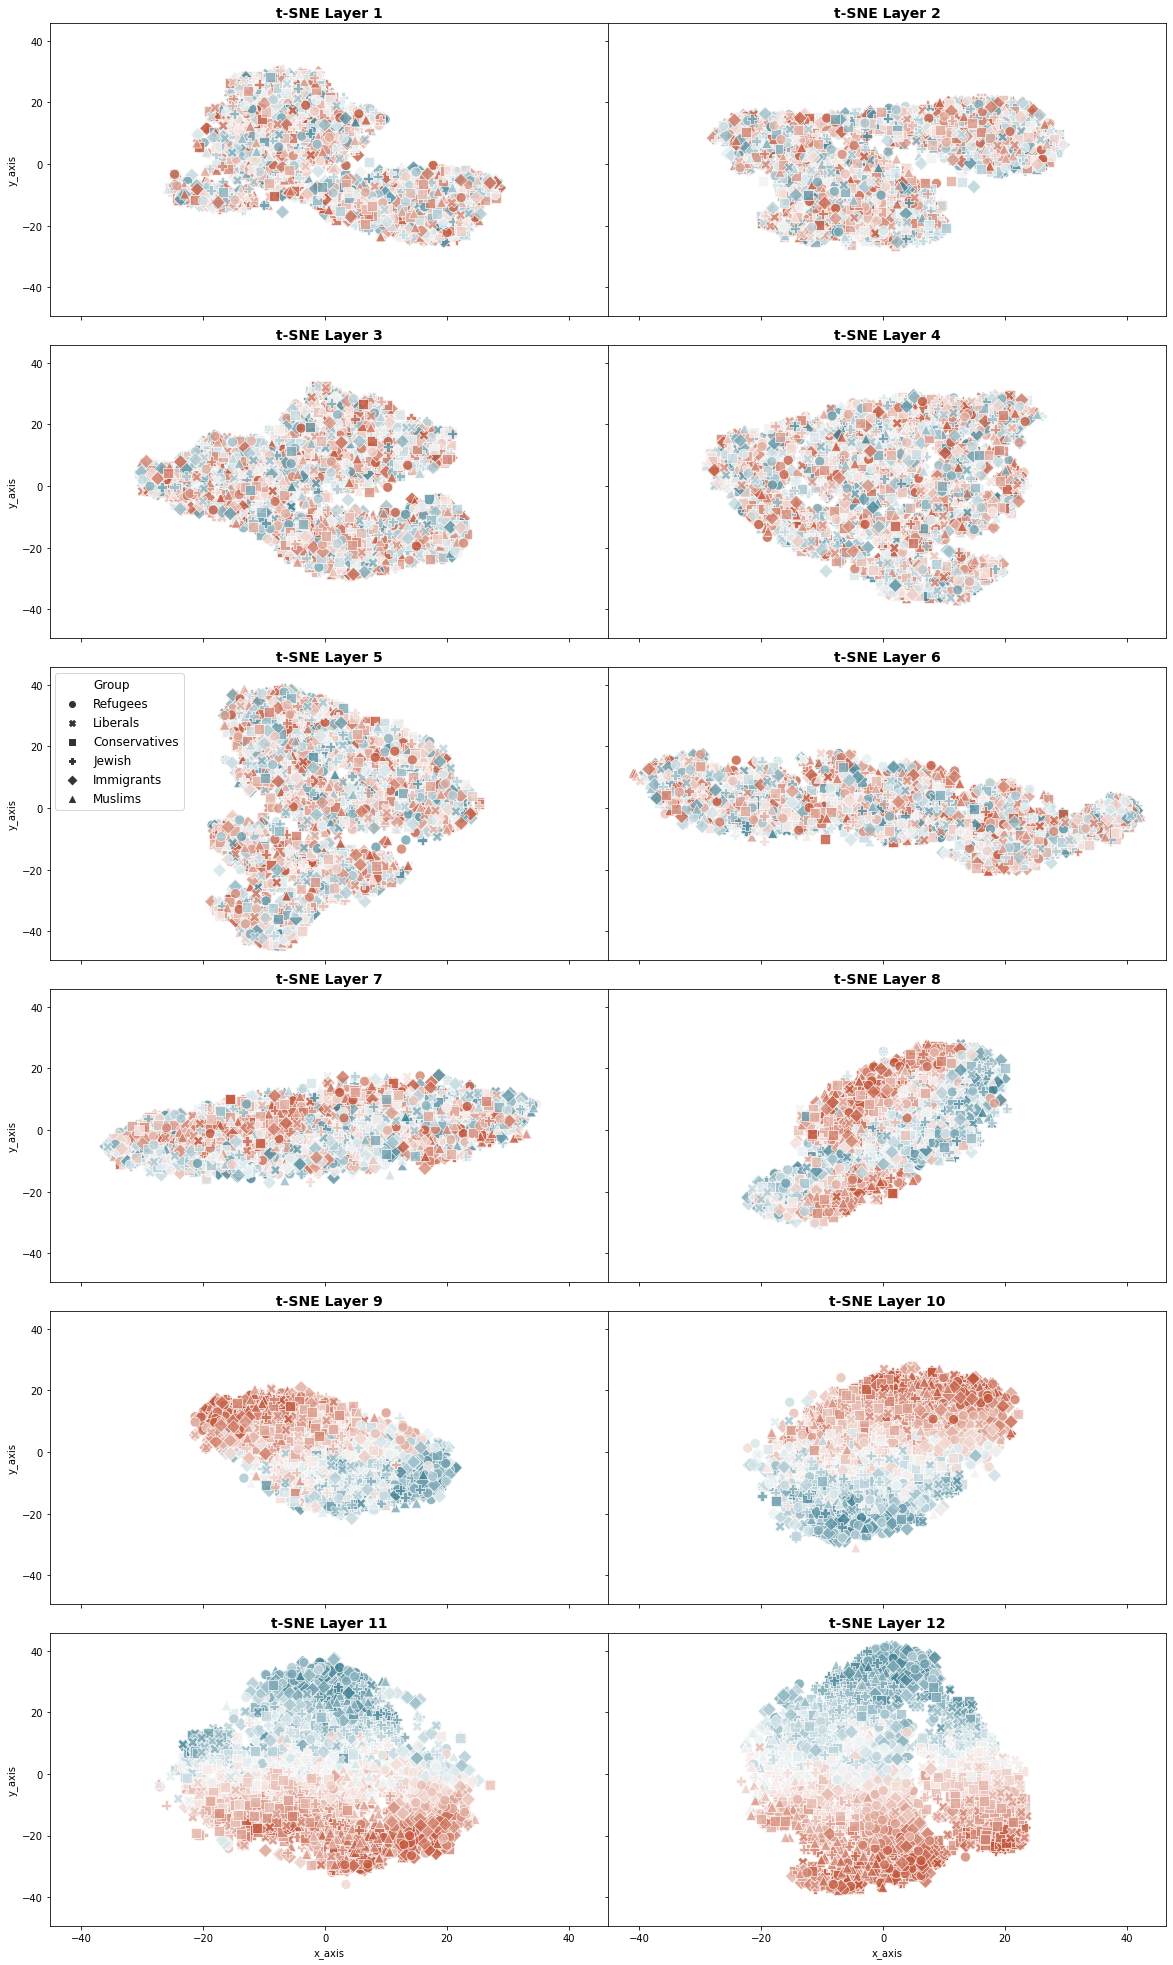
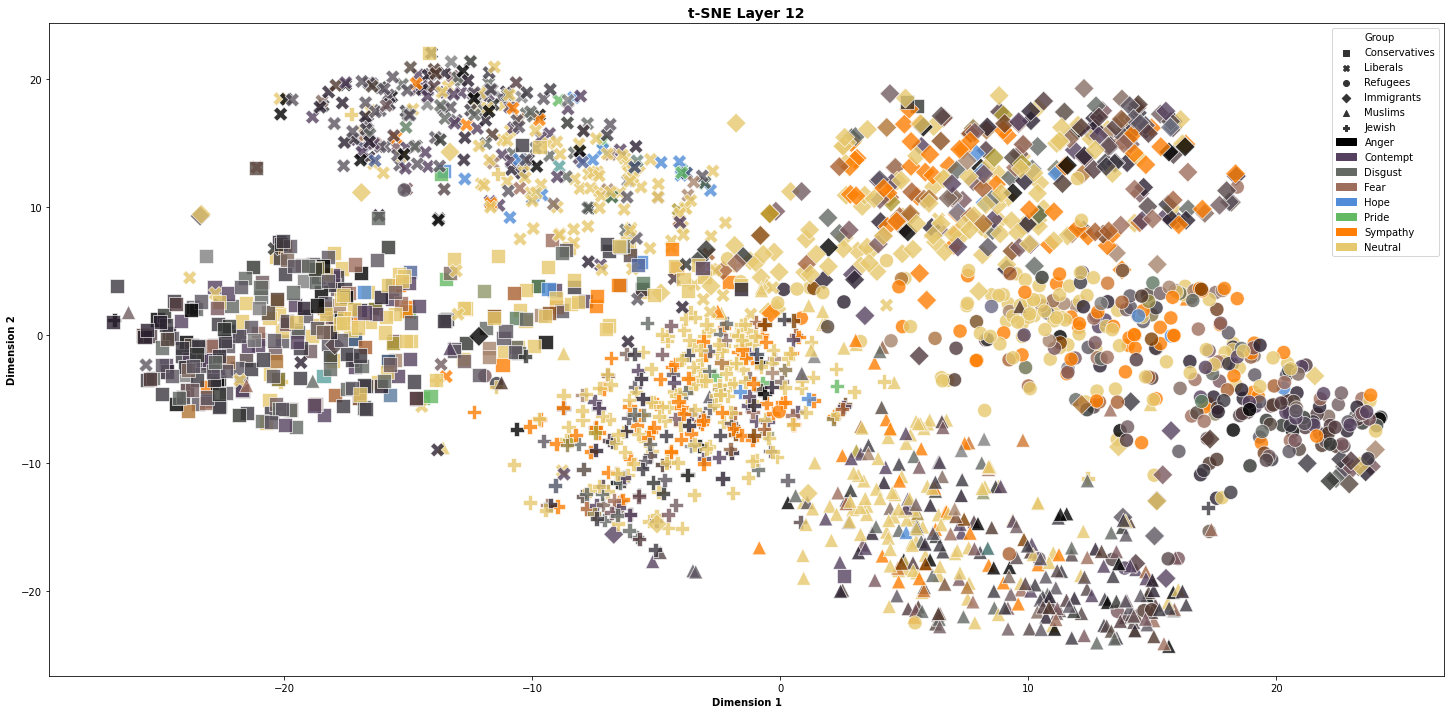
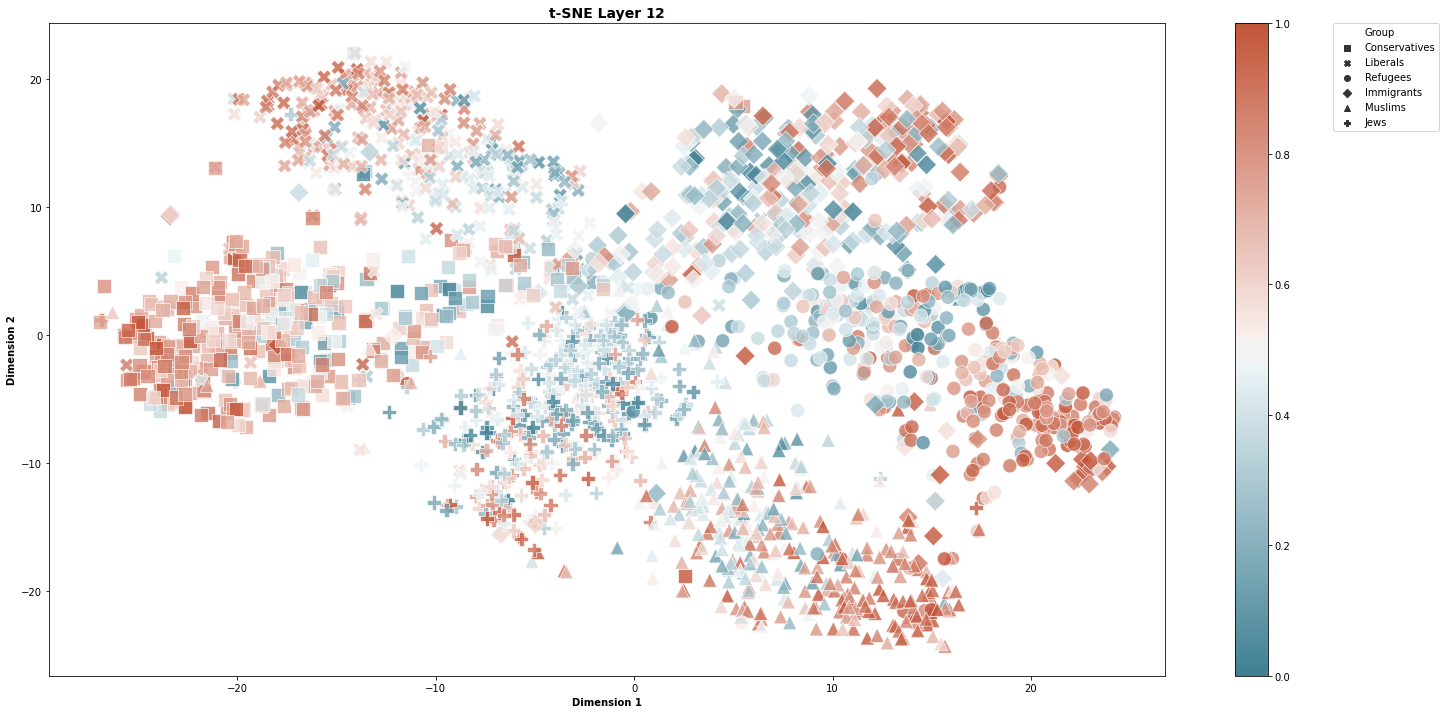
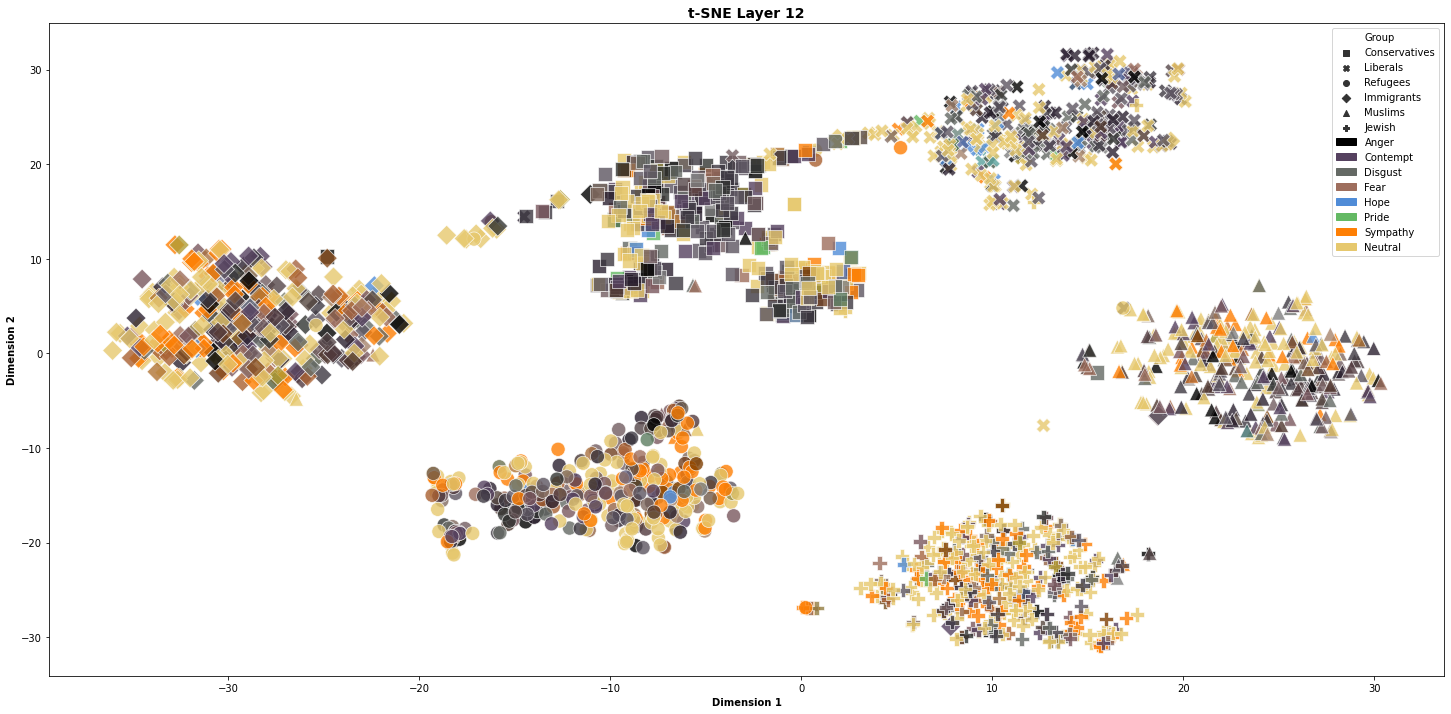
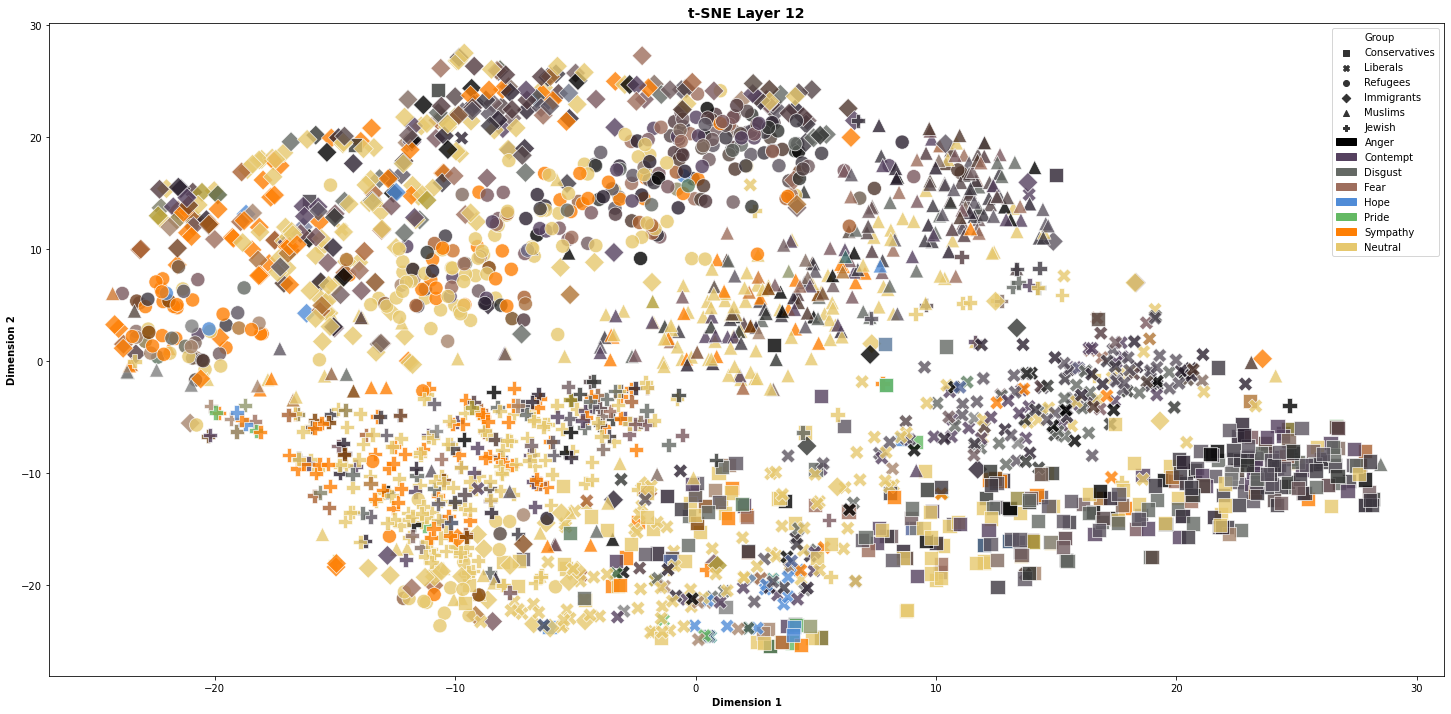
Our qualitative analysis showed that auxiliary tasks had a positive effect on predictions. Still, it cannot explain how the model changes its underlying structure and Reddit comments’ encoding. We explored how auxiliary tasks affected how the network encodes information through its layers to get a better understanding. We used t-Distributed Stochastic Neighbour Embedding (t-SNE) (van der Maaten and Hinton, 2008), a stochastic technique for dimensionality reduction focused on high dimensional data visualisation. We used it to visualise the hidden representations of the test set comments in-between transformer layers across the network. We present the results for both STL and the three-task MTL in Section A.5 Figures 12 and 13, where for both the first layers showed some structure not related to the tasks at hand. As we were using pre-trained weights from RoBERTa, this could be explained by the first layers modelling lower-level language characteristics as shown empirically in Tenney et al. (2019), where probing mechanisms indicate early layers being more relevant for tasks such as POS tagging. For STL, the last layers showed the UsVsThem scale continuously in the y axis. Once we introduced the auxiliary tasks of group identification and emotion classification differences in the last layers were exacerbated. For three-task MTL the last layers showed clusters for each social group, and related groups were closer together, such as Refugees and Immigrants, or Liberals and Conservatives. We also observe a radial distribution with highly emotional comments further away from the centre. Comments with very distant values on the scale (Discriminatory and Supportive) were closer together than with those in the mid-range (Neutral and Critical) as seen in Figure 4 and Section A.5 Figure 15. While paradoxical, our interpretation is that the model leverages the valence of emotion, where Discriminatory and Supportive comments are more loaded with emotion. This leads to a better performance of MTL compared to STL. This idea is supported by the distribution of emotions on the last layer, where emotionally neutral comments are closer to the centre of the plot, while more emotionally charged comments radially increase, visualised in Section A.5 Figure 14. In Section A.5 Figures 16 and 17 we present the emotion distribution for the group and emotion-specific layers, respectively.
6 Conclusions
We presented a new, large-scale dataset of populist rhetoric and the first series of computational models on this phenomenon. We have shown that joint modelling of emotion and populist attitudes towards social groups enhances performance over the single-task model, further corroborating previous research findings in various social sciences. Future work may deploy social information (e.g., Twitter) or explore the interactions of populist attitudes and the political bias of news articles as provided in our Us Vs. Them dataset.
Funding statement.
This research was funded by the European Union’s H2020 project Democratic Efficacy and the Varieties of Populism in Europe (DEMOS) under H2020-EU.3.6.1.1. and H2020-EU.3.6.1.2. (grant agreement ID: 822590) and supported by the European Union’s H2020 Marie Skłodowska-Curie project Knowledge Graphs at Scale (KnowGraphs) under H2020-EU.1.3.1. (grant agreement ID: 860801).
References
- Abadi (2017) David Abadi. 2017. Negotiating Group Identities in Multicultural Germany: The Role of Mainstream Media, Discourse Relations, and Political Alliances. Communication, Globalization, and Cultural Identity. Lexington Books.
- Abadi et al. (2016) David Abadi, Leen d’Haenens, Keith Roe, and Joyce Koeman. 2016. Leitkultur and discourse hegemonies: German mainstream media coverage on the integration debate between 2009 and 2014. International Communication Gazette, 78(6):557–584.
- Aslanidis (2016) Paris Aslanidis. 2016. Is populism an ideology? a refutation and a new perspective. Political Studies, 64(1_suppl):88–104.
- Bakker et al. (2020) Bert N. Bakker, Gijs Schumacher, and Matthijs Rooduijn. 2020. Hot politics? affective responses to political rhetoric. American Political Science Review, 115(1):150–164.
- Baumgartner et al. (2020) Jason Baumgartner, Savvas Zannettou, Brian Keegan, Megan Squire, and Jeremy Blackburn. 2020. The pushshift reddit dataset.
- Bos et al. (2020) Linda Bos, Christian Schemer, Nicoleta Corbu, Michael Hameleers, Ioannis Andreadis, Anne Schulz, Desirée Schmuck, Carsten Reinemann, and Nayla Fawzi. 2020. The effects of populism as a social identity frame on persuasion and mobilisation: Evidence from a 15-country experiment. European Journal of Political Research, 59(1):3–24.
- Burnap and Williams (2016) Peter Burnap and Matthew Leighton Williams. 2016. Us and them: identifying cyber hate on twitter across multiple protected characteristics. EPJ Data Science, 5(1):11.
- Card et al. (2015) Dallas Card, Amber E. Boydstun, Justin H. Gross, Philip Resnik, and Noah A. Smith. 2015. The media frames corpus: Annotations of frames across issues. In Proceedings of the 53rd Annual Meeting of the Association for Computational Linguistics and the 7th International Joint Conference on Natural Language Processing (Volume 2: Short Papers), pages 438–444, Beijing, China. Association for Computational Linguistics.
- Caruana (1993) Richard Caruana. 1993. Multitask learning: A knowledge-based source of inductive bias. In Proceedings of the Tenth International Conference on Machine Learning, pages 41–48. Morgan Kaufmann.
- Chandra et al. (2020) Shantanu Chandra, Pushkar Mishra, Helen Yannakoudakis, Madhav Nimishakavi, Marzieh Saeidi, and Ekaterina Shutova. 2020. Graph-based modeling of online communities for fake news detection.
- Conover et al. (2011) Michael D. Conover, Bruno Goncalves, Jacob Ratkiewicz, Alessandro Flammini, and Filippo Menczer. 2011. Predicting the political alignment of twitter users. In 2011 IEEE Third Int’l Conference on Privacy, Security, Risk and Trust and 2011 IEEE Third Int’l Conference on Social Computing, pages 192–199.
- Cowen et al. (2019) Alan S. Cowen, Petri Laukka, Hillary Anger Elfenbein, Runjing Liu, and Dacher Keltner. 2019. The primacy of categories in the recognition of 12 emotions in speech prosody across two cultures. Nature Human Behaviour, 3(4):369–382.
- Delgado and Tibau Alberdi (2019) Rosario Delgado and Xavier-Andoni Tibau Alberdi. 2019. Why cohen’s kappa should be avoided as performance measure in classification. PLoS ONE, 14:1–26.
- Demertzis (2006) Nicolas Demertzis. 2006. Emotions and populism. In Emotion, Politics and Society.
- Demszky et al. (2020) Dorottya Demszky, Dana Movshovitz-Attias, Jeongwoo Ko, Alan Cowen, Gaurav Nemade, and Sujith Ravi. 2020. GoEmotions: A dataset of fine-grained emotions. In Proceedings of the 58th Annual Meeting of the Association for Computational Linguistics, pages 4040–4054, Online. Association for Computational Linguistics.
- Dumitrache et al. (2018) Anca Dumitrache, Oana Inel, Lora Aroyo, Benjamin Timmermans, and Chris Welty. 2018. Crowdtruth 2.0: Quality metrics for crowdsourcing with disagreement.
- Ekman (1992) Paul Ekman. 1992. An Argument for Basic Emotions. Cognition and Emotion.
- ElSherief et al. (2018) Mai ElSherief, Vivek Kulkarni, Dana Nguyen, William Yang Wang, and Elizabeth Belding. 2018. Hate lingo: A target-based linguistic analysis of hate speech in social media. In Twelfth International AAAI Conference on Web and Social Media.
- Entman (1993) Robert M. Entman. 1993. Framing: Toward clarification of a fractured paradigm. Journal of Communication, 43(4):51–58.
- Estelles and Castellví Mata (2020) Marta Estelles and Jordi Castellví Mata. 2020. The educational implications of populism, emotions and digital hate speech: A dialogue with scholars from canada, chile, spain, the uk, and the us. Sustainability, 12.
- Fischer and Roseman (2007) Agneta H. Fischer and Ira J. Roseman. 2007. Beat them or ban them: the characteristics and social functions of anger and contempt. Journal of personality and social psychology, 93 1:103–15.
- Fujikoshi (1993) Yasunori Fujikoshi. 1993. Two-way anova models with unbalanced data. Discrete Mathematics, 116(1):315 – 334.
- Götz et al. (2005) Thomas Götz, Anne Frenzel, Reinhard Pekrun, and Nathan Hall. 2005. Emotional intelligence in the context of learning and achievement, pages 233–253. Cambridge, MA: Hogrefe & Huber Publishers.
- Hameleers et al. (2017) Michael Hameleers, Linda Bos, and Claes H. de Vreese. 2017. “they did it”: The effects of emotionalized blame attribution in populist communication. Communication Research, 44(6):870–900.
- Hanel et al. (2019) Paul H. P. Hanel, Natalia Zarzeczna, and Geoffrey Haddock. 2019. Sharing the same political ideology yet endorsing different values: Left- and right-wing political supporters are more heterogeneous than moderates. Social Psychological and Personality Science, 10(7):874–882.
- Hartmann et al. (2019) Mareike Hartmann, Tallulah Jansen, Isabelle Augenstein, and Anders Søgaard. 2019. Issue framing in online discussion fora. In Proceedings of the 2019 Conference of the North American Chapter of the Association for Computational Linguistics: Human Language Technologies, Volume 1 (Long and Short Papers), pages 1401–1407, Minneapolis, Minnesota. Association for Computational Linguistics.
- Hawkins (2009) Kirk A Hawkins. 2009. Is Chávez Populist?: Measuring Populist Discourse in Comparative Perspective. Comparative Political Studies, 42(8):1040–1067.
- Hawkins et al. (2019) Kirk A. Hawkins, Rosario Aguilar, Bruno Castanho Silva, Erin K. Jenne, Bojana Kocijan, and Rovira Kaltwasser. 2019. Measuring Populist Discourse: The Global Populism Database. In EPSA Annual Conference in Belfast.
- Hogg (2016) Michael A. Hogg. 2016. Social Identity Theory, pages 3–17. Springer International Publishing, Cham.
- Huguet Cabot et al. (2020) Pere-Lluís Huguet Cabot, Verna Dankers, David Abadi, Agneta Fischer, and Ekaterina Shutova. 2020. The Pragmatics behind Politics: Modelling Metaphor, Framing and Emotion in Political Discourse. In Findings of the Association for Computational Linguistics: EMNLP 2020, pages 4479–4488, Online. Association for Computational Linguistics.
- Inglehart and Norris (2016) Ronald F. Inglehart and Pippa Norris. 2016. Trump, brexit, and the rise of populism: Economic have-nots and cultural backlash. Social Science Research Network.
- Iyyer et al. (2014) Mohit Iyyer, Peter Enns, Jordan Boyd-Graber, and Philip Resnik. 2014. Political ideology detection using recursive neural networks. In Proceedings of the 52nd Annual Meeting of the Association for Computational Linguistics (Volume 1: Long Papers), pages 1113–1122, Baltimore, Maryland. Association for Computational Linguistics.
- Ji and Smith (2017) Yangfeng Ji and Noah A. Smith. 2017. Neural discourse structure for text categorization. In Proceedings of the 55th Annual Meeting of the Association for Computational Linguistics (Volume 1: Long Papers), pages 996–1005, Vancouver, Canada. Association for Computational Linguistics.
- Johnson et al. (2017) Kristen Johnson, Di Jin, and Dan Goldwasser. 2017. Leveraging behavioral and social information for weakly supervised collective classification of political discourse on twitter. In Proceedings of the 55th Annual Meeting of the Association for Computational Linguistics (Volume 1: Long Papers), pages 741–752, Vancouver, Canada. Association for Computational Linguistics.
- Kiesel et al. (2019) Johannes Kiesel, Maria Mestre, Rishabh Shukla, Emmanuel Vincent, Payam Adineh, David Corney, Benno Stein, and Martin Potthast. 2019. SemEval-2019 task 4: Hyperpartisan news detection. In Proceedings of the 13th International Workshop on Semantic Evaluation, pages 829–839, Minneapolis, Minnesota, USA. Association for Computational Linguistics.
- Krämer (2014) Benjamin Krämer. 2014. Media populism: A conceptual clarification and some theses on its effects. Communication Theory, 24(1):42–60.
- Kyle and Gultchin (2018) Jordan Kyle and Limor Gultchin. 2018. Populism in power around the world. SSRN Electronic Journal.
- Laver et al. (2003) Michael Laver, Kenneth Benoit, and John Garry. 2003. Extracting policy positions from political texts using words as data. American Political Science Review, 97(2):311–331.
- Lazarus (2001) Richard Lazarus. 2001. Relational meaning and discrete emotions. Appraisal Processes in Emotion: Theory, Methods, Research, pages 37–67.
- Li and Goldwasser (2019) Chang Li and Dan Goldwasser. 2019. Encoding social information with graph convolutional networks forPolitical perspective detection in news media. In Proceedings of the 57th Annual Meeting of the Association for Computational Linguistics, pages 2594–2604, Florence, Italy. Association for Computational Linguistics.
- Liu et al. (2019) Yinhan Liu, Myle Ott, Naman Goyal, Jingfei Du, Mandar Joshi, Danqi Chen, Omer Levy, Mike Lewis, Luke Zettlemoyer, and Veselin Stoyanov. 2019. Roberta: A robustly optimized BERT pretraining approach. CoRR, abs/1907.11692.
- van der Maaten and Hinton (2008) Laurens van der Maaten and Geoffrey Hinton. 2008. Visualizing data using t-sne. Journal of Machine Learning Research, 9:2579–2605.
- Manucci and Weber (2017) Luca Manucci and Edward Weber. 2017. Why The Big Picture Matters: Political and Media Populism in Western Europe since the 1970s. Swiss Political Science Review.
- Marchlewska et al. (2018) Marta Marchlewska, Aleksandra Cichocka, Orestis Panayiotou, Kevin Castellanos, and Jude Batayneh. 2018. Populism as identity politics: Perceived in-group disadvantage, collective narcissism, and support for populism. Social Psychological and Personality Science, 9(2):151–162.
- Marcus (2002) George Marcus. 2002. The sentimental citizen: emotion in democratic politics. Choice Reviews Online, 40(05):40–3068–40–3068.
- Marcus (2003) George Marcus. 2003. The Psychology of Emotion, pages 182–221. Oxford University Press.
- Massanari (2017) Adrienne Massanari. 2017. #gamergate and the fappening: How reddit’s algorithm, governance, and culture support toxic technocultures. New Media & Society, 19(3):329–346.
- Mazzoleni and Bracciale (2018) Gianpietro Mazzoleni and Roberta Bracciale. 2018. Socially mediated populism: the communicative strategies of political leaders on Facebook. Palgrave Communications, 4(1):50.
- Meret and Pajnik (2017) Susi Meret and Mojca Pajnik. 2017. Populist political communication in mediatized society. Routledge, United Kingdom.
- Mishra et al. (2020) Pushkar Mishra, Helen Yannakoudakis, and Ekaterina Shutova. 2020. Tackling online abuse: A survey of automated abuse detection methods.
- Moors et al. (2013) Agnes Moors, Phoebe C. Ellsworth, Klaus R. Scherer, and Nico H. Frijda. 2013. Appraisal theories of emotion: State of the art and future development. Emotion Review, 5(2):119–124.
- Mudde (2004) Cas Mudde. 2004. The Populist Zeitgeist. Government and Opposition.
- Mudde and Kaltwasser (2018) Cas Mudde and Cristóbal Rovira Kaltwasser. 2018. Studying populism in comparative perspective: Reflections on the contemporary and future research agenda. Comparative Political Studies, 51(13):1667–1693.
- Munn (2020) Luke Munn. 2020. Angry by design: toxic communication and technical architectures. Humanities and Social Sciences Communications, 7.
- Nguyen (2019) Christoph G Nguyen. 2019. Emotions and populist support.
- Nguyen et al. (2020) Van-Hoang Nguyen, Kazunari Sugiyama, Preslav Nakov, and Min-Yen Kan. 2020. Fang: Leveraging social context for fake news detection using graph representation. ArXiv, abs/2008.07939.
- Otjes and Louwerse (2015) Simon Otjes and Tom Louwerse. 2015. Populists in parliament: Comparing left-wing and right-wing populism in the netherlands. Political Studies, 63(1):60–79.
- Pennacchiotti and Popescu (2011) Marco Pennacchiotti and Ana-Maria Popescu. 2011. Democrats, republicans and starbucks afficionados: user classification in twitter. In Proceedings of the 17th ACM SIGKDD international conference on Knowledge discovery and data mining, pages 430–438.
- Preoţiuc-Pietro et al. (2017) Daniel Preoţiuc-Pietro, Ye Liu, Daniel Hopkins, and Lyle Ungar. 2017. Beyond binary labels: Political ideology prediction of twitter users. In Proceedings of the 55th Annual Meeting of the Association for Computational Linguistics (Volume 1: Long Papers), pages 729–740, Vancouver, Canada. Association for Computational Linguistics.
- Redlawsk et al. (2018) David P. Redlawsk, Ira J. Roseman, Kyle Mattes, and Steven Katz. 2018. Donald trump, contempt, and the 2016 gop iowa caucuses. Journal of Elections, Public Opinion and Parties, 28(2):173–189.
- Rico et al. (2017) Guillem Rico, Marc Guinjoan, and Eva Anduiza. 2017. The Emotional Underpinnings of Populism: How Anger and Fear Affect Populist Attitudes. Swiss Political Science Review, 23(4):444–461.
- Rico et al. (2020) Guillem Rico, Marc Guinjoan, and Eva Anduiza. 2020. Empowered and enraged: Political efficacy, anger and support for populism in europe. European Journal of Political Research, 59(4):797–816.
- Rodrik (2019) Dani Rodrik. 2019. What’s driving populism?
- Rollwage et al. (2019) Max Rollwage, Leor Zmigrod, Lee de Wit, Raymond J. Dolan, and Stephen M. Fleming. 2019. What underlies political polarization? a manifesto for computational political psychology. Trends in Cognitive Sciences, 23(10):820 – 822.
- Rooduijn and Burgoon (2018) Matthijs Rooduijn and Brian Burgoon. 2018. The Paradox of Well-being: Do Unfavorable Socioeconomic and Sociocultural Contexts Deepen or Dampen Radical Left and Right Voting Among the Less Well-Off? Comparative Political Studies, 51(13):1720–1753.
- Rooduijn and Pauwels (2011) Matthijs Rooduijn and Teun Pauwels. 2011. Measuring populism: Comparing two methods of content analysis. West European Politics.
- Roseman et al. (2020) Ira J. Roseman, Kyle Mattes, David P. Redlawsk, and Steven Katz. 2020. Reprehensible, laughable: The role of contempt in negative campaigning. American Politics Research, 48(1):44–77.
- Salmela and von Scheve (2017a) Mikko Salmela and Christian von Scheve. 2017a. Emotional roots of right-wing political populism. Science Information, 56(4).
- Salmela and von Scheve (2017b) Mikko Salmela and Christian von Scheve. 2017b. Emotional roots of right-wing political populism. Social Science Information, 56(4):567–595.
- Salminen et al. (2020) Joni Salminen, Sercan Sengün, Juan Corporan, Soon-gyo Jung, and Bernard J. Jansen. 2020. Topic-driven toxicity: Exploring the relationship between online toxicity and news topics. PLOS ONE, 15(2):1–24.
- Silva et al. (2016) Leandro Silva, Mainack Mondal, Denzil Correa, Fabrício Benevenuto, and Ingmar Weber. 2016. Analyzing the targets of hate in online social media.
- Smith and Lazarus (1990) Craig Smith and Richard Lazarus. 1990. Emotion and Adaptation, volume 21, pages 609–637.
- Smith and Lazarus (1993) Craig Smith and Richard Lazarus. 1993. Appraisal Components, Core Relational Themes, and the Emotions. Cognition & Emotion - COGNITION EMOTION, 7:233–269.
- Tausch et al. (2011) Nicole Tausch, Julia Becker, Russell Spears, Oliver Christ, Rim Saab, Purnima Singh, and Roomana Siddiqui. 2011. Explaining radical group behavior: Developing emotion and efficacy routes to normative and nonnormative collective action. Journal of personality and social psychology, 101:129–48.
- Tenney et al. (2019) Ian Tenney, Dipanjan Das, and Ellie Pavlick. 2019. BERT rediscovers the classical NLP pipeline. In Proceedings of the 57th Annual Meeting of the Association for Computational Linguistics, pages 4593–4601, Florence, Italy. Association for Computational Linguistics.
- Thomas et al. (2006) Matt Thomas, Bo Pang, and Lillian Lee. 2006. Get out the vote: Determining support or opposition from congressional floor-debate transcripts. CoRR, abs/cs/0607062.
- Turner and Reynolds (2010) John C Turner and Katherine J Reynolds. 2010. The story of social identity. In Rediscovering Social Identity: Key Readings, pages 13–32. Psychology Press, Taylor & Francis, New York.
- Williams (1959) E. J. Williams. 1959. The comparison of regression variables. Journal of the Royal Statistical Society: Series B (Methodological), 21(2):396–399.
- Wirz et al. (2018) Dominique S Wirz, Martin Wettstein, Anne Schulz, Philipp Müller, Christian Schemer, Nicole Ernst, Frank Esser, and Werner Wirth. 2018. The Effects of Right-Wing Populist Communication on Emotions and Cognitions toward Immigrants. The International Journal of Press/Politics, 23(4):496–516.
- Wolf et al. (2019) Thomas Wolf, Lysandre Debut, Victor Sanh, Julien Chaumond, Clement Delangue, Anthony Moi, Pierric Cistac, Tim Rault, Rémi Louf, Morgan Funtowicz, Joe Davison, Sam Shleifer, Patrick von Platen, Clara Ma, Yacine Jernite, Julien Plu, Canwen Xu, Teven Le Scao, Sylvain Gugger, Mariama Drame, Quentin Lhoest, and Alexander M. Rush. 2019. Huggingface’s transformers: State-of-the-art natural language processing.
- Zampieri et al. (2019) Marcos Zampieri, Shervin Malmasi, Preslav Nakov, Sara Rosenthal, Noura Farra, and Ritesh Kumar. 2019. SemEval-2019 task 6: Identifying and categorizing offensive language in social media (OffensEval). In Proceedings of the 13th International Workshop on Semantic Evaluation, pages 75–86, Minneapolis, Minnesota, USA. Association for Computational Linguistics.
- Zampieri et al. (2020) Marcos Zampieri, Preslav Nakov, Sara Rosenthal, Pepa Atanasova, Georgi Karadzhov, Hamdy Mubarak, Leon Derczynski, Zeses Pitenis, and Çağrı Çöltekin. 2020. SemEval-2020 task 12: Multilingual offensive language identification in social media (OffensEval 2020). In Proceedings of the Fourteenth Workshop on Semantic Evaluation, pages 1425–1447, Barcelona (online). International Committee for Computational Linguistics.
Appendix A Supplemental material
A.1 Data collection
| Time ranges | Events | |
|---|---|---|
| Conservatives | 2016/09/15 - 2016/12/15 | Election periods |
| 2018/09/15 - 2018/12/15 | ||
| Liberals | 2016/09/15 - 2016/12/15 | Election periods |
| 2018/09/15 - 2018/12/15 | ||
| Muslims | 2016/11/01 - 2017/11/30 | Trump Muslim ban, |
| 2018/04/01 - 2018/05/01 | Mosque attacks. | |
| 2019/03/01 - 2019/06/01 | ||
| Immigrants | 2016/11/01 - 2017/11/30 | Migrant caravans, |
| 2017/01/15 - 2017/03/15 | Children at the US | |
| 2018/06/17 - 2018/07/01 | border | |
| 2018/10/01 - 2019/02/01 | ||
| Jews | 2018/10/20 - 2018/11/25 | Christchurch shooting |
| News Title | Comment | |
|---|---|---|
| Refugees | refugee, asylum seeker | refugee, asylum seeker, |
| undocumented, colonization | ||
| Immigration | -migra-, undocumented, | -migra-, undocumented, |
| colonization | colonization | |
| Muslims | muslim, arab, muhammad, | muslim, arab, muhammad, |
| muhammed, islam, hijab, | muhammed, islam, hijab, | |
| sharia | sharia | |
| Jews | -jew(i/s)-, heeb- , sikey-, | -jew(i/s)-, heeb- , sikey-, |
| -zionis-, -semit- | -zionis-, -semit- | |
| Liberals | antifa, libtard, communist, | antifa, libtard, communist, |
| socialist, leftist, liberal, | socialist, leftist, liberal, | |
| democrat | democrat | |
| Conservatives | altright, alt-right, | altright, alt-right, |
| cuckservative, trumpster, | cuckservative, trumpster, | |
| conservative, republican | conservative, republican |
A.2 Description of the annotation options
Discriminatory or Alienating.
Annotators were asked to mark this in case the comment was either, (A) alienating or portraying a social group as negative, (B) a threat, danger or peril to society, (C) trying to ridicule it and attack that group as lesser or worthless.
Critical but not Discriminatory.
In case the comment was critical, but not to the extent of the first option, annotators were asked to mark this option.
Supportive or Favorable.
This answer refers to comments expressing support towards that group, by defending it or praising it.
Neutral.
This option was offered in case none of the above applied, either because the group was only mentioned but the comment was not addressed at them, or there was no opinion whatsoever expressed towards the group, such as expressing purely factual information.
Annotators were first asked to select whether the comment showed a ‘Positive’, ‘Negative’ or ‘Neutral’ sentiment towards the specified group. With this approach, we intended to simplify the task and guide annotators, which then were offered to choose from 6 positive or 6 negative emotions according to sentiment they initially chose. In case annotators selected Neutral no further options were provided. The descriptions for each emotion were:
Positive emotions:
Gratitude Someone is doing/causing something good or lovely.
Happiness/Joy555Referred to as Happiness for simplicity Something good is happening.
Something amusing or funny is happening.
Hope Something good/better might happen (sooner or later).
Pride Someone is taking credit for a good achievement.
Relief Something bad has changed for the better.
Sympathy Someone shows support or devotion.
Negative emotions:
Anger. Someone is causing harm or a negative/undeserved outcome, while this could have been avoided.
Someone is acting in an unjustified manner towards people.
Someone is blocking the goals of people.
Anxiety/Fear Something negative might/could happen (sooner or later), which threatens the well-being of people.
Contempt Someone is inferior (for example, immoral, lazy or greedy).
Someone is incompetent (for example, weak or stupid).
Sadness Something bad or sad has happened.
Someone has experienced a loss (for example, death or loss of possessions).
Moral Disgust666Referred to as Disgust for simplicity Someone behaves in an offensive way (for example, corrupt, dishonest, ruthless, or unscrupulous behavior).
Guilt/Shame777Referred to as Guilt for simplicity Someone sees him-/herself as responsible for causing a harmful/ immoral/ shameful/ embarrassing outcome to people.
A.3 Reliability
emotions and the inter-rater correlation.
We also applied the algorithm called Leave-One-Rater-Out PPCA Cowen et al. (2019), using Bonferroni correction on p-values. Principal Preserved Component Analysis (PPCA) finds principal components which instead of preserving variance within a single dataset as conducted in PCA, preserve the cross-covariance between two different datasets, in our case being a comparison between annotations by one rater and a random set of other raters. In this manner, we can assess the degree of agreement and whether all component dimensions are significant, indicating significant emotion dimensions to be preserved. In our setup, the largest p-value for a dimension was , with all other dimensions showing much smaller values. This supports the idea that our emotion dimensions are significant, in order to be kept.
A.4 Data analysis
| Predictor | Sum of | df | Mean | F | p | partial |
|---|---|---|---|---|---|---|
| Squares | Square | |||||
| (Intercept) | 2582.47 | 1 | 2582.47 | 0.000 | ||
| Groups | 22.05 | 5 | 4.41 | 78.73 | 0.000 | 0.04 |
| Bias | 4.82 | 4 | 1.21 | 21.52 | 0.000 | 0.01 |
| Groups x Bias | 13.82 | 20 | 0.69 | 12.33 | 0.000 | 0.03 |
| Error | 492.63 | 8794 | 0.06 |
| Conservatives | Liberals | Immigrants | Refugees | Jews | Muslims | |
|---|---|---|---|---|---|---|
| left | 0.433 | |||||
| centre-left | 0.422 | |||||
| centre | 0.452 | |||||
| centre-right | 0.557 | 0.433 | ||||
| right | 0.467 |
| Anger | Contempt | Disgust | Fear | Gratitude | Guilt | Happiness | Hope | Pride | Relief | Sadness | Sympathy | Neutral | |
|---|---|---|---|---|---|---|---|---|---|---|---|---|---|
| Conservatives | 28.5% | 47.7% | 44.4% | 8.9% | 1.3% | 4.5% | 1.4% | 4.2% | 4.1% | 0.5% | 2.4% | 6.9% | 23.7% |
| Liberals | 22.4% | 40.7% | 28.3% | 8.4% | 1.3% | 3.1% | 0.8% | 7.9% | 2.9% | 0.4% | 1.6% | 6.4% | 32.6% |
| Jews | 17.4% | 22.8% | 16.9% | 8.2% | 0.5% | 1.3% | 0.6% | 2.3% | 3.1% | 0.6% | 1.5% | 23.8% | 44.4% |
| Muslims | 31.4% | 39.2% | 30.0% | 26.1% | 0.8% | 2.5% | 0.9% | 2.0% | 1.9% | 0.3% | 1.5% | 15.1% | 26.8% |
| Immigrants | 23.5% | 33.4% | 18.8% | 21.5% | 1.5% | 1.4% | 0.8% | 4.3% | 2.2% | 0.6% | 1.6% | 23.4% | 30.9% |
| Refugees | 26.9% | 37.3% | 21.8% | 25.8% | 0.7% | 2.0% | 0.6% | 6.2% | 1.0% | 0.8% | 2.0% | 24.1% | 25.3% |
| Anger | Contempt | Disgust | Fear | Gratitude | Guilt | Happiness | Hope | Pride | Relief | Sadness | Sympathy | Neutral | |
|---|---|---|---|---|---|---|---|---|---|---|---|---|---|
| left | 22.5% | 35.8% | 25.8% | 15.1% | 0.7% | 2.4% | 0.6% | 4.9% | 2.5% | 0.5% | 2.0% | 18.6% | 31.5% |
| centre-left | 21.1% | 34.1% | 27.0% | 13.5% | 1.2% | 2.6% | 0.7% | 5.0% | 2.1% | 0.4% | 1.8% | 18.1% | 32.6% |
| centre | 24.4% | 35.2% | 26.1% | 15.0% | 1.5% | 2.1% | 1.1% | 5.0% | 2.7% | 0.7% | 1.8% | 15.1% | 32.8% |
| centre-right | 25.9% | 36.3% | 26.5% | 17.0% | 1.2% | 2.4% | 0.9% | 3.9% | 3.2% | 0.7% | 1.2% | 17.8% | 29.4% |
| right | 31.5% | 43.4% | 29.0% | 21.9% | 0.6% | 2.9% | 0.9% | 3.6% | 2.2% | 0.4% | 2.1% | 13.5% | 26.4% |
A.5 Analysis
| Reddit Comment | |||||||
| 1 | I can’t believe this bullshit. It’s literally come down to picking between letting refugees sleep in your bed and fuck your wife and daughter or you’re a racist hate monger. Literally no point on the spectrum exists between the two ends. | ||||||
| Label | MTL, E. & G. | MTL, E. | MTL, G. | STL | Group | Emotions | |
| Refugees | Anger & Fear | ||||||
| 2 | As a legal immigrant, the newfound term ‘undocumented immigrant’ annoys the heck out of me. They’re illegal aliens. Stop trying to sugarcoat it. It took me years to move here legally, and I resent those who chose to do it illegally. The process is long but it is fair. Come in through the front door, not the backdoor. | ||||||
| Label | MTL, E. & G. | MTL, E. | MTL, G. | STL | Group | Emotions | |
| Immigrants | Anger & Disgust | ||||||
| 3 | By every moral or ethical standard, it is your duty to refuse orders to “defend” the US from these migrants. History will look kindly upon you if you do. There are thousands, if not millions, of us who will support your decision to lay your weapons down. | ||||||
| Label | MTL, E. & G. | MTL, E. | MTL, G. | STL | Group | Emotions | |
| Immigrants | Sympathy & Hope | ||||||
| 4 | I was about to be shocked, until i thought about the god damn state of the world, the western world is at the moment at almost the same state, where at least a large minority wish the same thing of the Muslims. That and god damn people THERE IS MILLIONS OF MUSLIMS NOT EVERYONE THINKS THIS WAY! | ||||||
| Label | MTL, E. & G. | MTL, E. | MTL, G. | STL | Group | Emotions | |
| Muslims | Sympathy | ||||||
| 5 | The Democrats are the ones preventing people? That’s funny. Who are the lawmakers in the state legislatures that are constantly scheming up roundabout ways to defund planned parenthood and completely outlaw abortion access, despite a large majority of Americans supporting at least some degree of abortion? Hint: they’re not Dems. | ||||||
| Label | MTL, E. & G. | MTL, Emo. | MTL, Groups | STL | Group | Emotions | |
| Liberals | Sympathy | ||||||