The Extraordinary Outburst in the Massive Protostellar System NGC 6334 I-MM1: Spatio-kinematics of Water Masers during a Contemporaneous Flare Event
Abstract
Following an eruptive accretion event in NGC 6334I-MM1, flares in the various maser species, including water masers, were triggered. We report the observed relative proper motion of the highly variable water masers associated with the massive star-forming region, NGC 6334I. High velocity H2O maser proper motions were detected in 5 maser clusters, CM2-W2 (bow-shock structure), MM1-W1, MM1-W3, UCHII-W1 and UCHII-W3. The overall average of the derived relative proper motion is 85 km s-1. This mean proper motion is in agreement with the previous results from VLA multi-epoch observations. Our position and velocity variance and co-variance matrix analyses of the maser proper motions show its major axis to have a position angle of , cutting through the dust cavity around MM1B and aligned in the northwest-southeast direction. We interpret this as the axis of the jet driving the CM2 shock and the maser motion. The complicated proper motions in MM1-W1 can be explained by the combined influence of the MM1 northeast-southwest bipolar outflow, CS(6-5) north-south collimated bipolar outflow, and the radio jet. The relative proper motions of the H2O masers in UCHII-W1 are likely not driven by the jets of MM1B protostar but by MM3-UCHII. Overall, the post-accretion burst relative proper motions of the H2O masers trace shocks of jet motion.
1 Introduction
Accretion in young massive protostars is a complex phenomenon. Irregular and fragmented accretion disks lead to episodic accretion with long periods of relatively slow accretion rate, and short periods of high mass gain (Meyer et al., 2017). High accretion rates (also called accretion bursts) have been directly observed in massive protostars of S255IR NIRS 3 (Caratti o Garatti et al., 2017), NGC6334I-MM1 (Hunter et al., 2017) and G358.93-0.03-MM1 (Burns et al., 2020). The high accretion rate heats up the protostellar disk, which in turn can dramatically increase thermal radiation by the surrounding dust. Among the consequences of accretion events include enhancement of existing spectral line emission (Hunter et al., 2018; Brogan et al., 2018; Burns et al., 2020) and the excitation of new maser lines (Brogan et al., 2019; MacLeod et al., 2019; Chen et al., 2020a; Volvach et al., 2020; Chen et al., 2020b). Accretion bursts can also significantly alter the chemical makeup of the protostellar disk for a short time, as observed in low mass protostars (Visser et al., 2015).
In general, astrophysical masers provide clues into the physical conditions and the kinematics of protostellar systems. Maser flares have been found to accompany accretion bursts initially identified in many observations: in 6.7 GHz CH3OH masers near S255IR (Moscadelli et al., 2017; Szymczak et al., 2018) and many maser species from NGC6334I (MacLeod et al., 2018). Long term single-dish monitoring observations of variable masers can provide an excellent mechanism to identify the onset of an accretion burst. The early identification of an accretion burst via maser monitoring was detected in G358.93-0.03 by Sugiyama et al. (2019). This exciting result led to the detection of a wide range of methanol maser transitions including several not even predicted to exist (MacLeod et al., 2019; Brogan et al., 2019; Breen et al., 2019). Monitoring of 19.967 GHz CH3OH masers towards G358.93-0.03 are presented in Volvach et al. (2020) and for other transitions, in MacLeod et al. (in preparation) and Yonekura et al. (in preparation).
High resolution multi-epoch Very Long Baseline Interferometry (VLBI) studies of maser proper motion measurements provide useful insights into the gas spatio-kinematics of protostellar disks, outflows and shocks (Moscadelli et al., 2011; Chibueze et al., 2012; Torrelles et al., 2014).
NGC 6334 I, located at a parallax distance of kpc (Chibueze et al., 2014; Reid et al., 2014; Wu et al., 2014), is a massive star forming region containing a massive protostar that has recently undergone an accretion burst. Millimeter and sub-millimeter observations using the Submillimeter Array (SMA) first identified four compact sources in NGC 6334I (MM1-MM4). MM1 and MM2 were the brightest dust sources while MM3 coincided with the ultra-compact HII region NGC 6334 F (Hunter et al., 2006). Five more continuum sources (MM5-MM9) were later identified using the Atacama Large Millimeter/submillimeter Array (ALMA) and MM1 was also resolved into six continuum components (A-F) at 1.3 mm (Brogan et al., 2016). Properties of the individual components were modelled, with several having high dust and brightness temperatures . Continuum emission associated with MM1, MM3-UCHII and CM2 (located north of MM1) was detected in the 5 cm observations of NGC 6334I made using the Karl G. Jansky Very Large Array (VLA) (Brogan et al., 2016). Comparison of the ALMA images with earlier SMA images revealed that the luminosity of MM1 increased by a factor of (Hunter et al., 2017) between 2008 and 2015, with the centroid of the increase aligned with protostar MM1B. In a parallel discovery, MM1F, MM1G, MM1C and MM3-UCHII underwent their first observed activation of 6.7 GHz masers (Hunter et al., 2018), contemporaneous with flaring of nine other maser transitions beginning in January 2015 (MacLeod et al., 2018). Followup 22 GHz H2O maser emission measurements using VLA identified flaring of water masers in a bow shock shape in CM2 (Brogan et al., 2018). In contrast, the H2O masers previously seen surrounding MM1B were also damped significantly, likely due to increased dust temperatures.
Single-dish observations in various CO and CS transitions have consistently shown a northeast-southwest (NE-SW) outflow at large scales (0.5 pc) whose origin is centered on MM1 or MM2 (Bachiller & Cernicharo, 1990; McCutcheon et al., 2000; Leurini et al., 2006; Qiu et al., 2011). Later interferometric imaging with ALMA of CS(6-5) resolved the central part of the outflow, confirming MM1 as the primary origin, and revealing a north-south (N-S) outflow centered on MM1B and a blue-shifted northwest (NW) lobe (Brogan et al., 2018). Subsequent imaging of CS(18-17) and HDO in ALMA Band 10 (McGuire et al., 2018) demonstrated excellent spatial alignment between the warm thermal gas tracing the compact outflow and the 22 GHz H2O masers embedded in it.
In this paper, we present multi-epoch VLBI measurements of the 22 GHz H2O maser emission using a combination of Korean VLBI Network (KVN) and VLBI Exploration of Radio Astronomy (VERA) during the first year of the accretion burst event. We derive the relative proper motion measurements for these H2O masers in order to probe the kinematics of the gas surrounding MM1 and MM3-UCHII in this region of active star formation.
2 Observations and data reduction
2.1 Single-dish monitoring observations
The ongoing 22.2 GHz (1.3 cm) water maser observations reported here were made using the 26m telescope of Hartebeesthoek Radio Astronomy Observatory (HartRAO). The single-dish results reported in this paper covers observations taken between 7 May 2013 and 2 December 2020. The coordinates that the telescope pointed to were ()=(17h20m53s.4, 35o47′015). The beam width for this receiver is 2.2 Pointing observations were made for each epoch. These observations were also corrected for atmospheric absorption. Because of the large velocity extent position switching was employed. The rest frequency of the receiver was set to 22.235120 GHz. The receiver system consisted of left (LCP) and right circularly polarised (RCP) feeds. Dual polarization spectra were obtained using a 1024-channel (per polarisation) spectrometer. The receiver is cryogenically cooled. Each polarisation is calibrated independently relative to Hydra A, 3C123, and Jupiter, assuming the flux scale of Ott et al. (1994). The band width used was 8 MHz providing a velocity resolution of 0.105 km s-1 and a total velocity extent of 107.9 km s-1. Typical sensitivities achieved per observation were 2.3 to 2.9 Jy. Typically, observations were made every 10 to 15d. However, the cadence of observations varied depending on the availability of the telescope, and the weather conditions. At times observations were done daily, but there are also observations separated by weeks.
2.2 KaVA observations
H2O masers in NGC 6334I was observed with KVN and VERA Array (KaVA) in 3 epochs taken on 21 November 2015 (2015.89), 15 December 2015 (2015.95) and 4 January 2016 (2016.01), respectively. The position of the phase tracking center of the NGC 6334I was ()=(17h20m53s.377, -35o46′55″.808) in the J2000.0 epoch. NRAO530 was used as the band-pass calibrator while
The total bandwidth was 256 MHz (16 MHz 16 IFs) and data were recorded for the left-hand circular polarization at a 1 Gbps sampling rate. We analyzed only the one 16 MHz IF channel that contained the H2O 616–523 transition. The spectral resolution is 15.625 kHz (0.21 km s-1) for the H2O maser line. The correlation process was carried out at the Korean-Japan Correlation Center, Daejeon, Korea (KJCC: Lee et al. 2015).
The data calibration was carried out using the Astronomical Image Processing System (AIPS) developed by National Radio Astronomy Observatory (NRAO) (van Moorsel et al. 1996). First, the amplitude was calibrated by using AIPS task APCAL using system temperature and measured antenna gains. Next, delays and phase offsets were removed by running AIPS task FRING using NRAO530. Bandpass response was also calibrated using NRAO530. The 3.9 km s-1 velocity component of the masers was used as a reference maser component in NGC 6334I. Imaging and CLEAN (deconvolution) were performed using the AIPS task IMAGR. The SAD task was employed for the Gaussian fitting for extraction of the peak intensities and offset positions of the maser spots. A maser ‘spot’ refers to an individual maser emission peak in a spectral channel while a maser ‘feature’ denotes a group of maser spots considered to exist within the same maser cloudlet and located physically close to each other. The synthesized beams for the first, second, and third epochs was 2.48 mas 0.97 mas (position angle, PA=-0.38∘), 2.66 mas 1.01 mas (PA=2.82∘) and 2.76 mas 1.06 mas (PA=10.64∘), respectively.
Maser features, defined as clusters of masers spots having a position defined by the position of the brightest peak, were carefully identified in each epoch. Maser distributions in MM1-W1 and UCHII-W1 varied significantly from epoch to epoch, and this complexity may have affected, in small measures, the derived proper motions. Our single-dish results support the complex structures of these masers (see Section 3.1). The proper motions in R.A., and in Dec. were calculated using the displacement (cos) of the maser feature over adjacent epochs. For features detected in all three epochs, the average of the proper motion between epochs 1 & 2, and epochs 2 & 3 were taken.
Fringe-rate mapping was used to derive the absolute position of the reference maser spot and then compared to the closest epoch of the Very Large Array (VLA) H2O maser map to obtain the absolute positions of the maser spots/features. The positional accuracy of the masers are within 1.0 mas in R.A. and 3.5 mas in Declination. To register the relative positions of the maser features in the 3 epoch, we use the position of a bright maser spot in UCHII-W1 region as a reference. The derived relative proper motions are marginally affected by the intrinsic motion of the reference maser spot. The overall uncertainty in our derived relative proper motions due to the motion of the reference maser spot is 10%. This is obtained from the group motion of all maser features around the reference maser spot. It should be noted that all proper motions reported in this work are relative proper motions.
3 Results
3.1 Structures in the H2O maser dynamic spectra
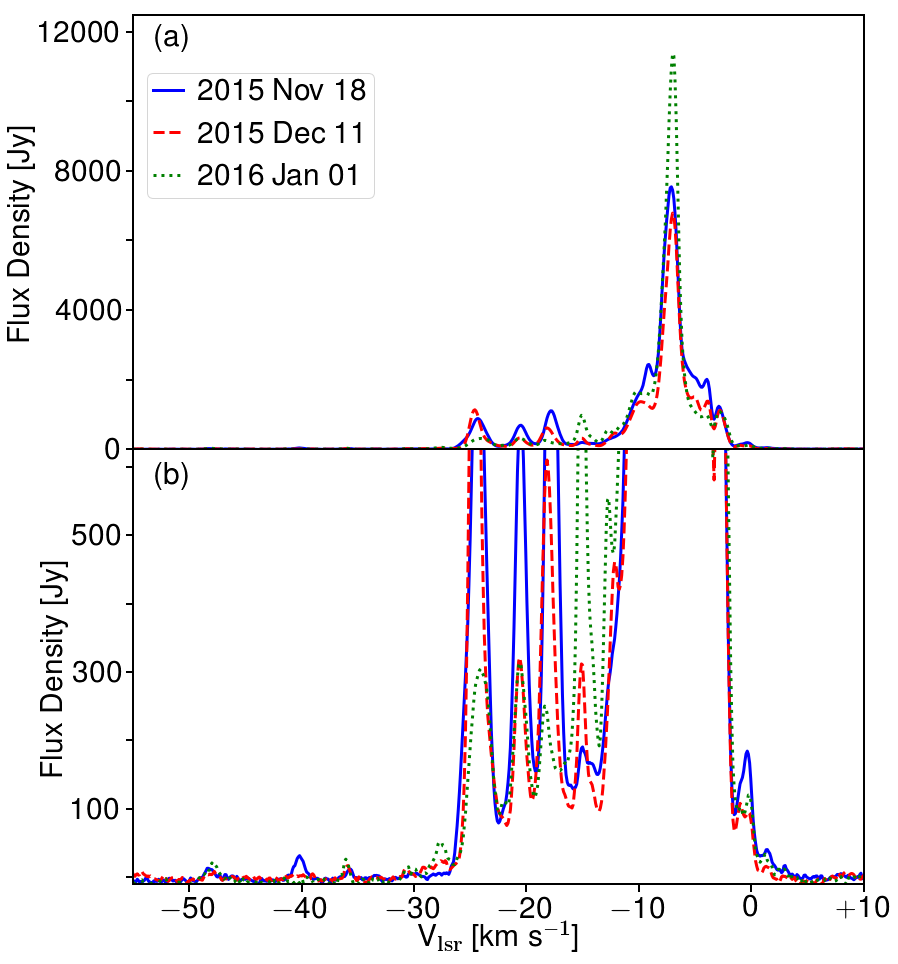
The dynamic spectra of the long-term monitoring of H2O masers is shown in Fig.1 (A and B). The image provides an interesting metric demonstrating the longevity of emission in a given velocity extent. We note that a subset of this data was presented in MacLeod et al. (2018). The water emission in 14 V4 km s-1 suffers significant line blending making it impossible to disentangle maser features and structure in this single-dish data. In panels (a) to (d) more independent masers are visible. In these, and during the MJD extent between the first and last epoch of VLBI observations, little velocity drift appears present in most. Possible velocity drifts may be present in this MJD extent for emission in 45 V35 km s-1. This may be the result of multiple masers varying independently. Still the continuity of maser emission during this MJD extent lends comfort to the study of proper motion below.
Between the onset of the 6.7 GHz CH3OHmaser burst and the first maximum of the burst (white and black lines in Fig.1 A, respectively), H2O masers in the region are mostly destroyed or heavily suppressed. However, Fig. 1 B shows that most of the maser features, though varied in the flux densities, survived through the epochs of our VLBI observations.
Figure 2 shows the single-dish (HartRAO 26 m) spectra of the highly variable H2O masers in NGC 6334I taken nearest the respective VLBI observations. Significant variations can be seen between 18 November, 2015 and 01 January, 2016. The most prominent feature of the spectra, 7 km s-1, and a second, 15 km s-1, feature are brightening, the rest of the maser features are weakening.
3.2 Proper motions of the H2O masers
We obtained the absolute position of the reference maser spot (used for the self calibration) in the first epoch. This position, with full consideration of the proper motion of the reference maser spot, was used for the registration of the maps in the 3 epochs. We traced 186 maser proper motions, divided into groups according to the nomenclature used by Brogan et al. (2018).
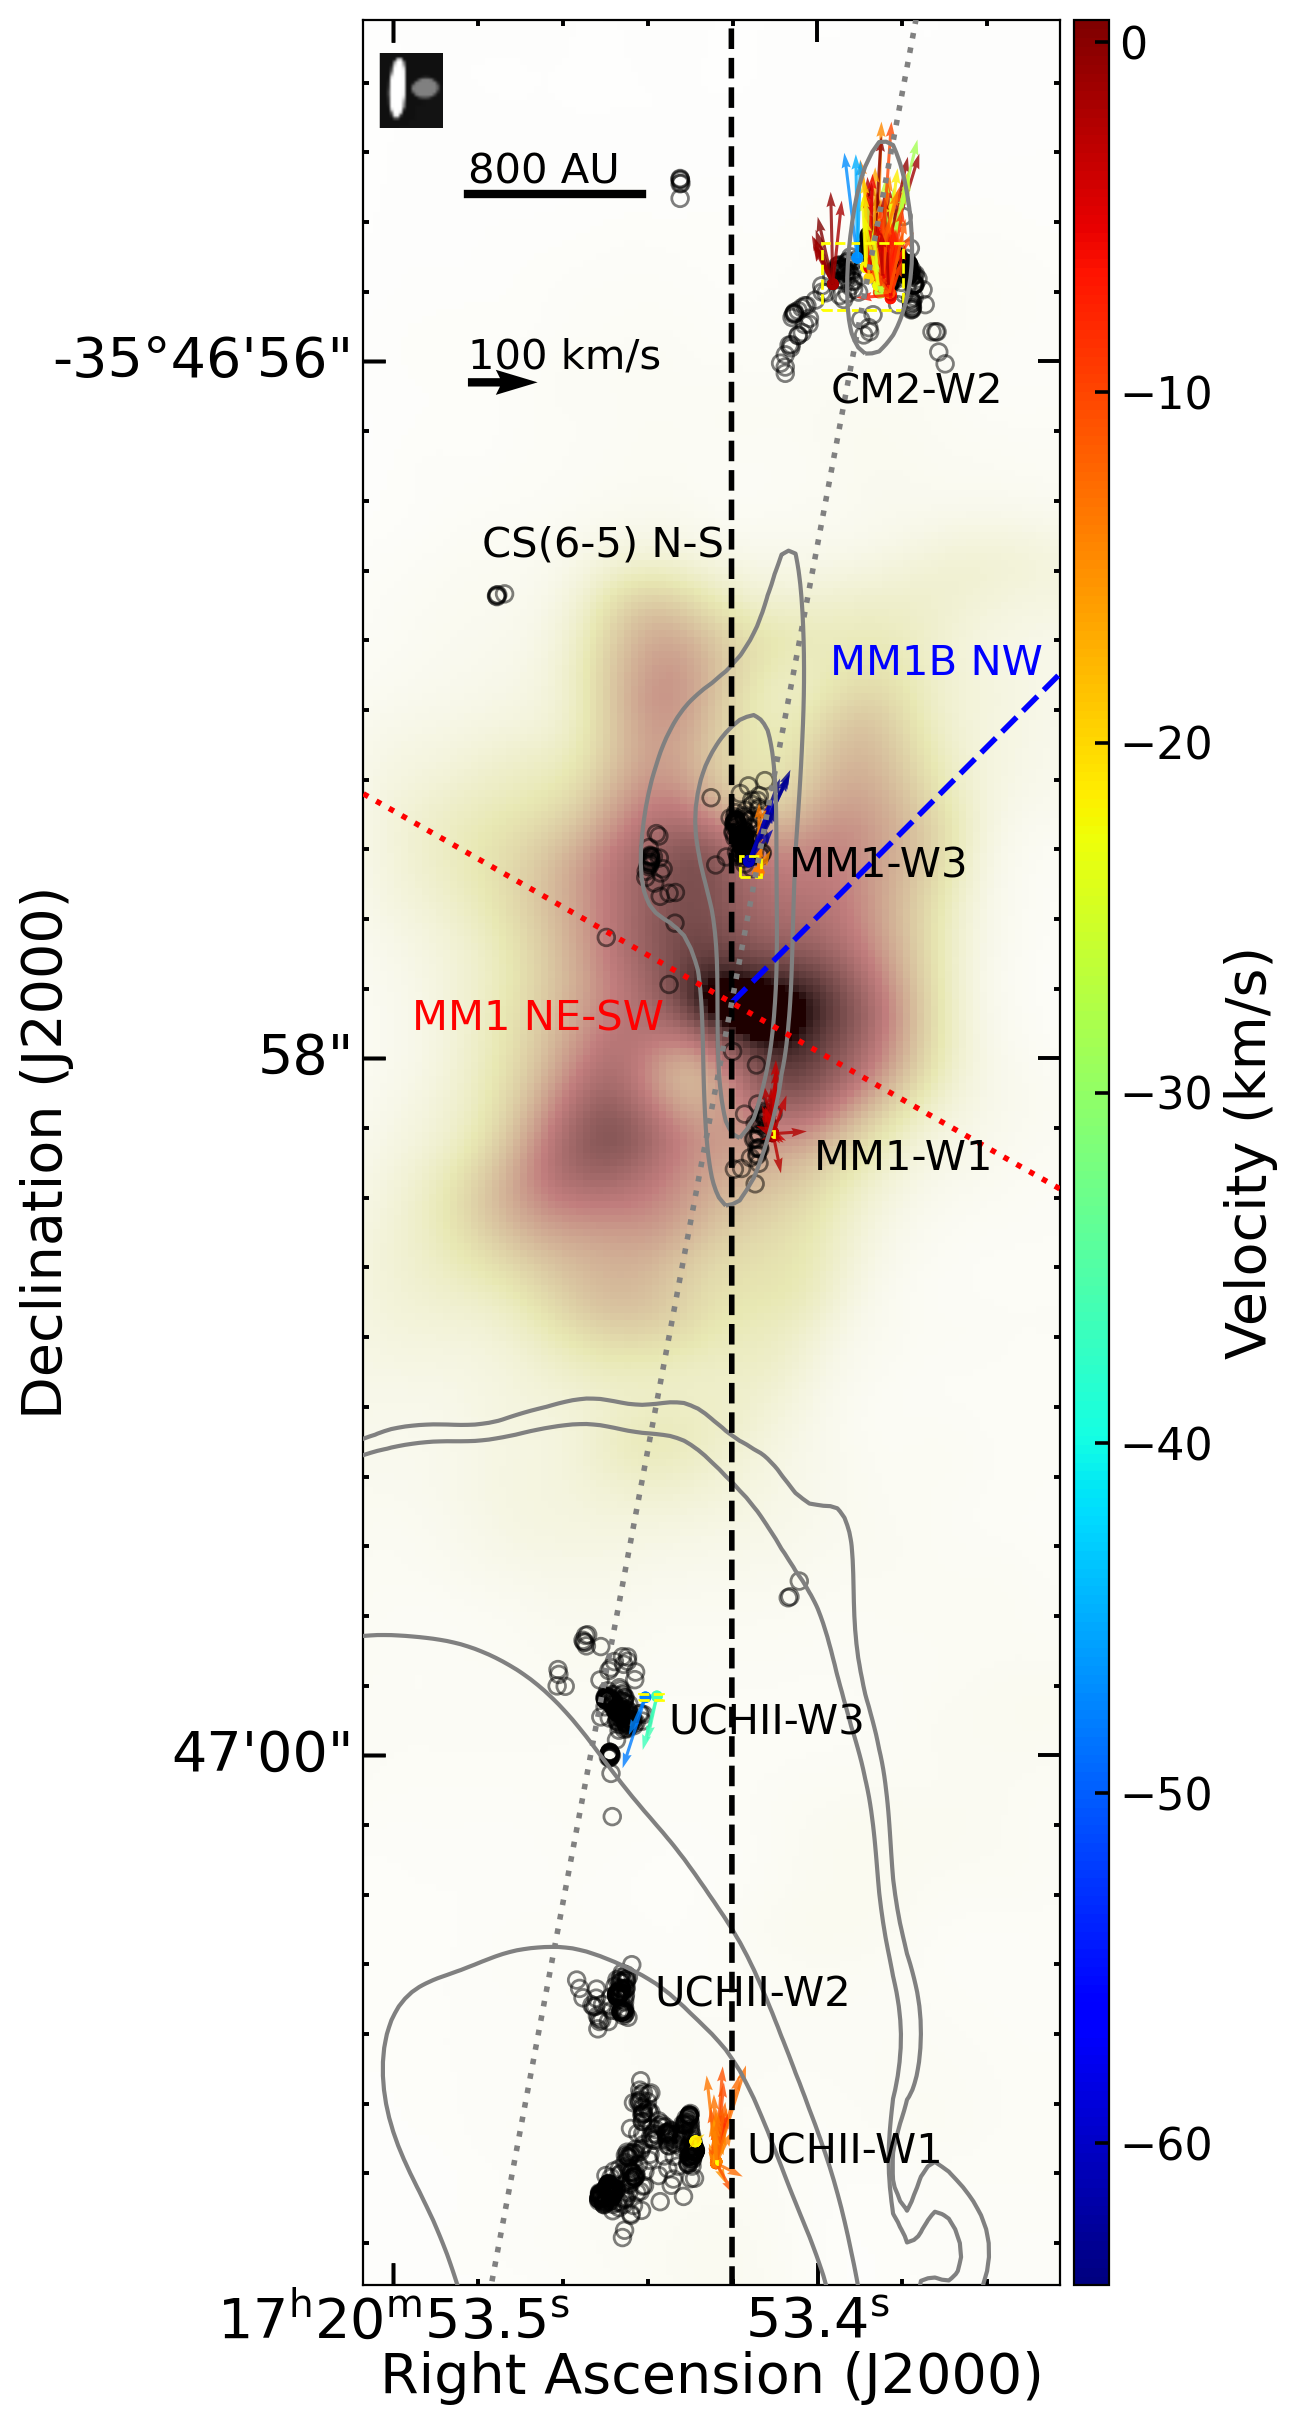
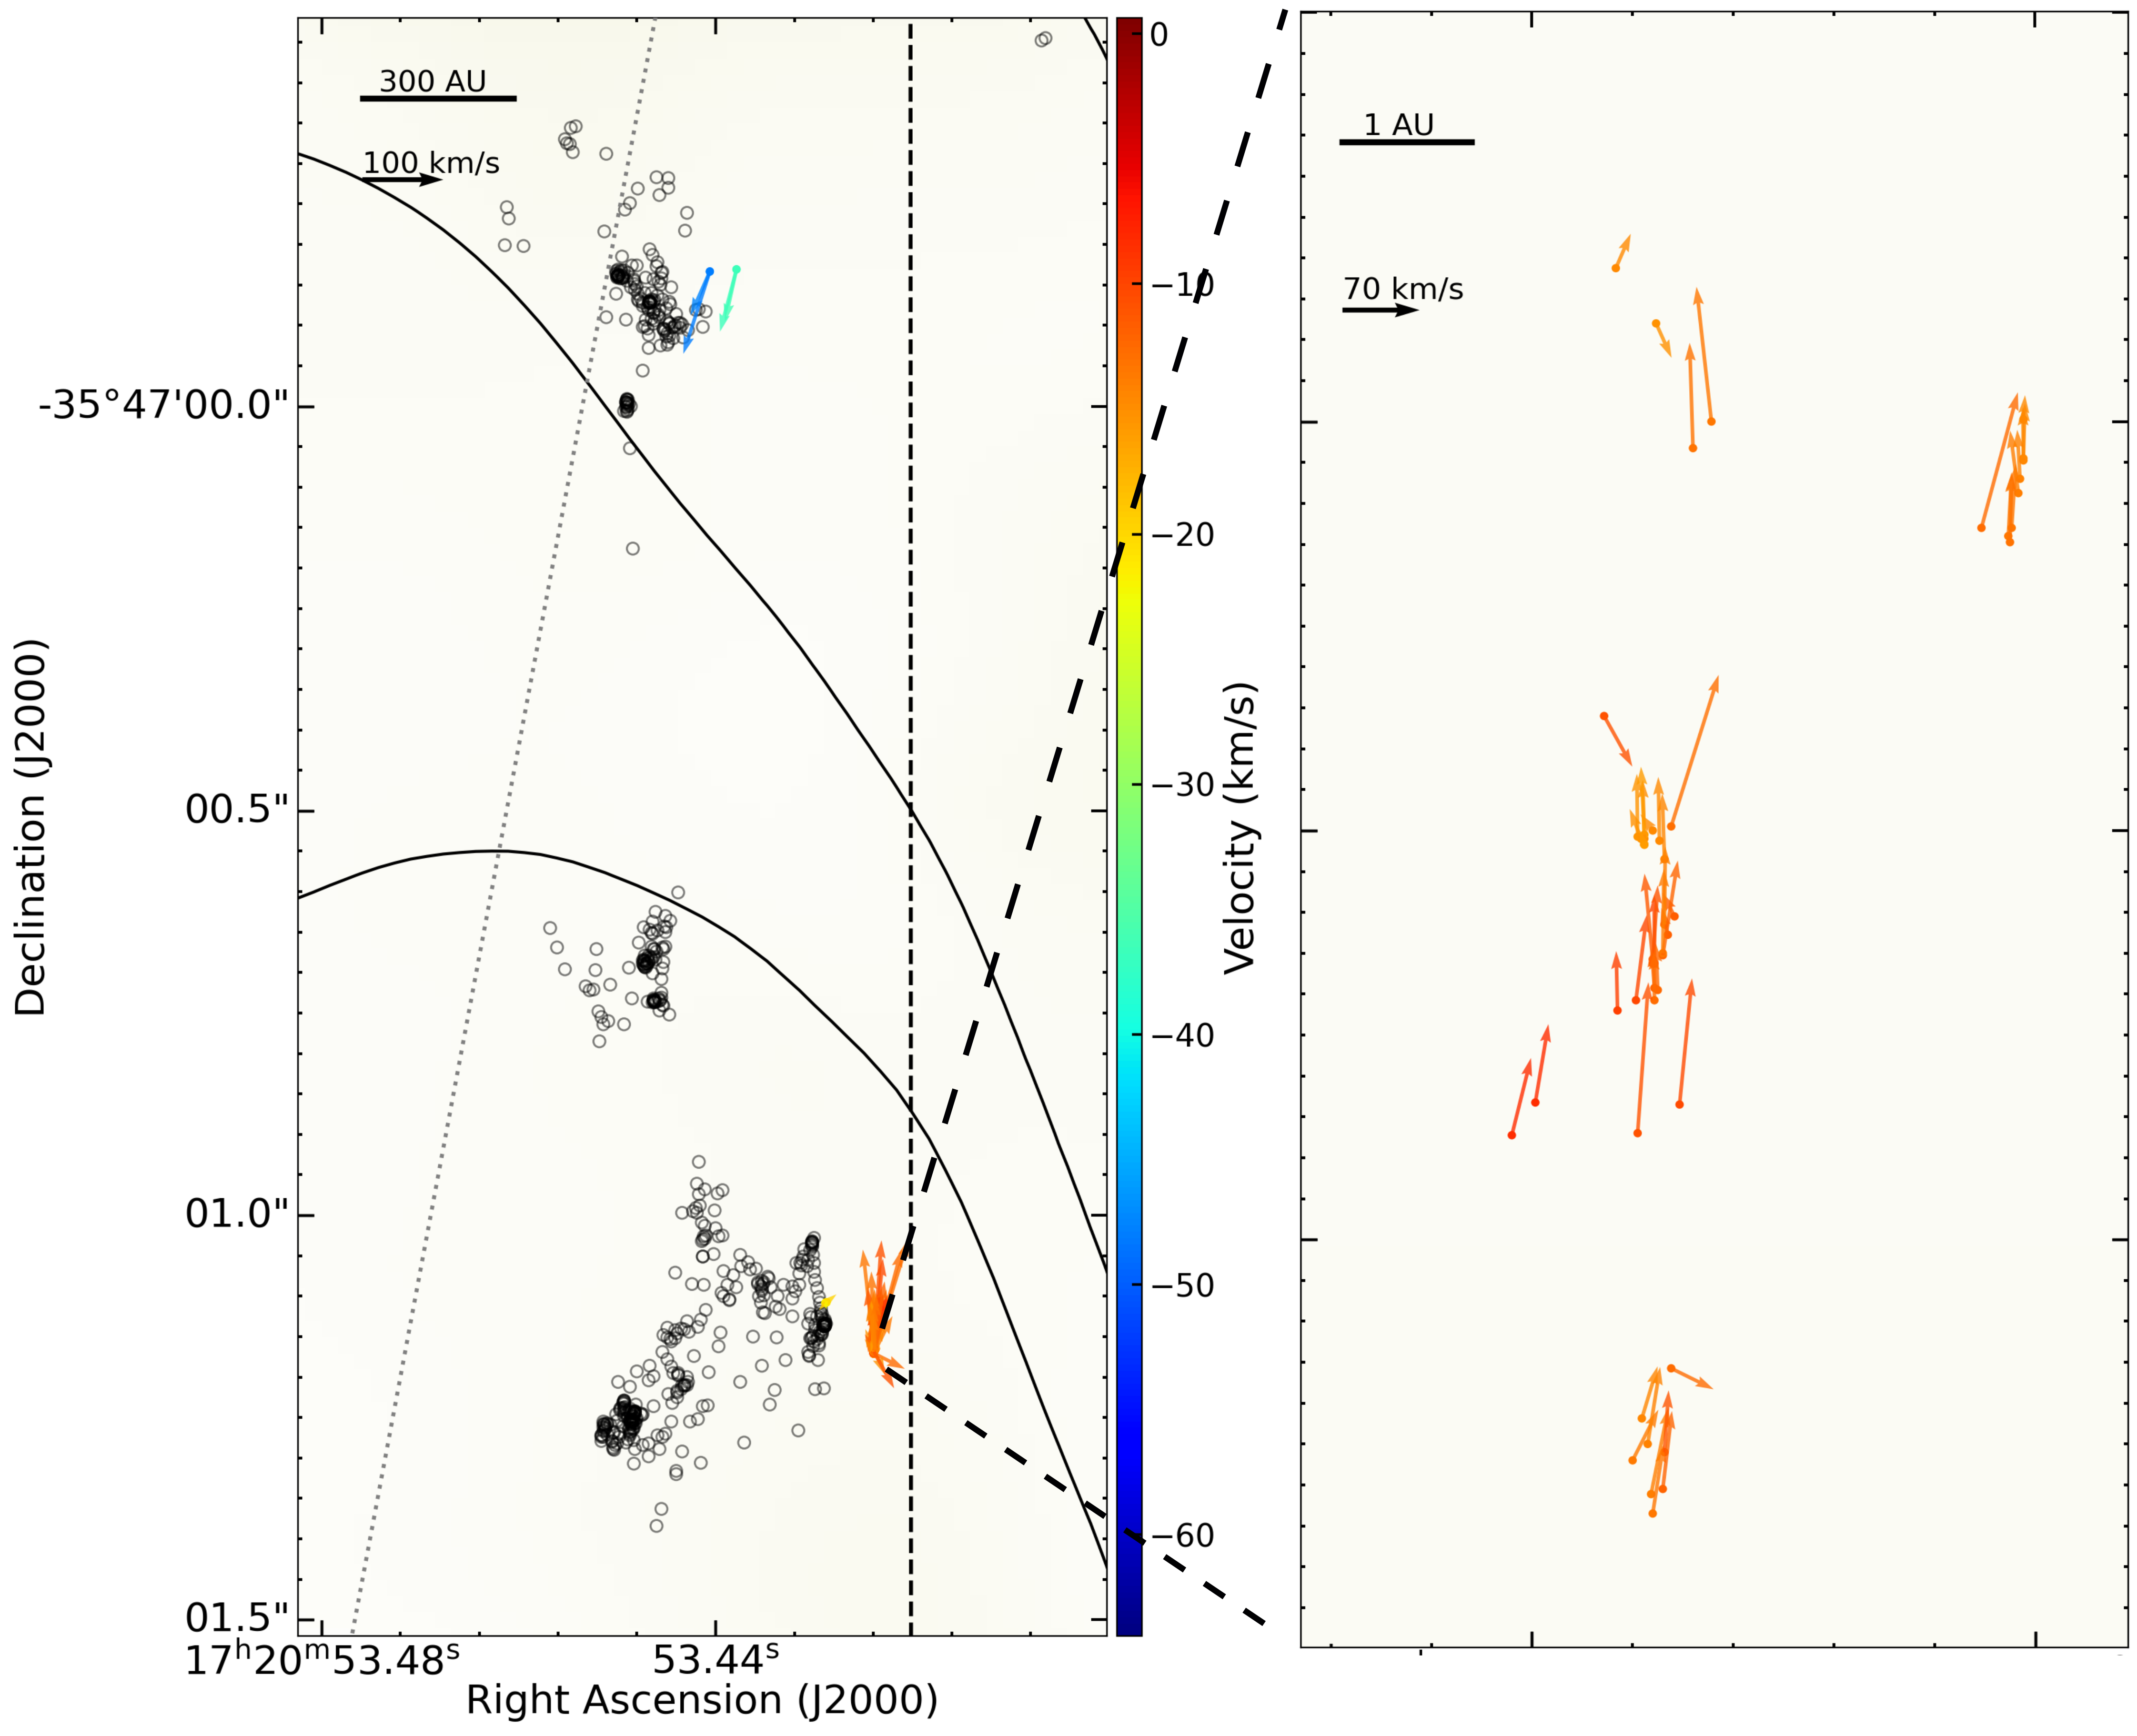
Figures 3, 4, 5, and 6 show the traced H2O maser proper motions overlaid on the ALMA 1.3 mm dust continuum from a comparable epoch (2016.6, grey scale from Hunter et al. (2017)) and the VLA 5 cm image (white contours from Hunter et al. (2018)). The colored vectors (arrows) represent the H2O proper motions traced in the region. The length of each arrow indicates the magnitude of the proper motion and the direction of the arrow indicates the proper motion direction. Proper motions are measured with respect to the reference maser spot in UCHII-W1 located at = = (17h20m52s.600, -35o46′50″.508). The grey circles are water maser detection from Brogan et al. (2018) for comparison. Figures 4, 5 and 6 shows zoom-ins of the proper motions of different maser groups with colors of the of the masers (as in Figure 3).
We detected water maser proper motions in the regions CM2-W2, MM1-W1, MM1-W3, UCHII-W1 and UCHII-W3. The positions, proper motions, and epochs of detection are shown in Table 1. A ‘+’ indicates a detection in a specific epoch of a specific maser feature, while ‘-’ signifies a non-detection. The majority of all the proper motions (56.5%) were traced using all 3 epochs, while the remaining 43.5% were traced in 2 epochs. The overall mean of the 3D velocities of the masers is 85 km s-1. For the rest of this section, average velocity refers to the magnitude of the average 3-dimensional velocity. In the following paragraphs, we describe the properties of each of the groups.
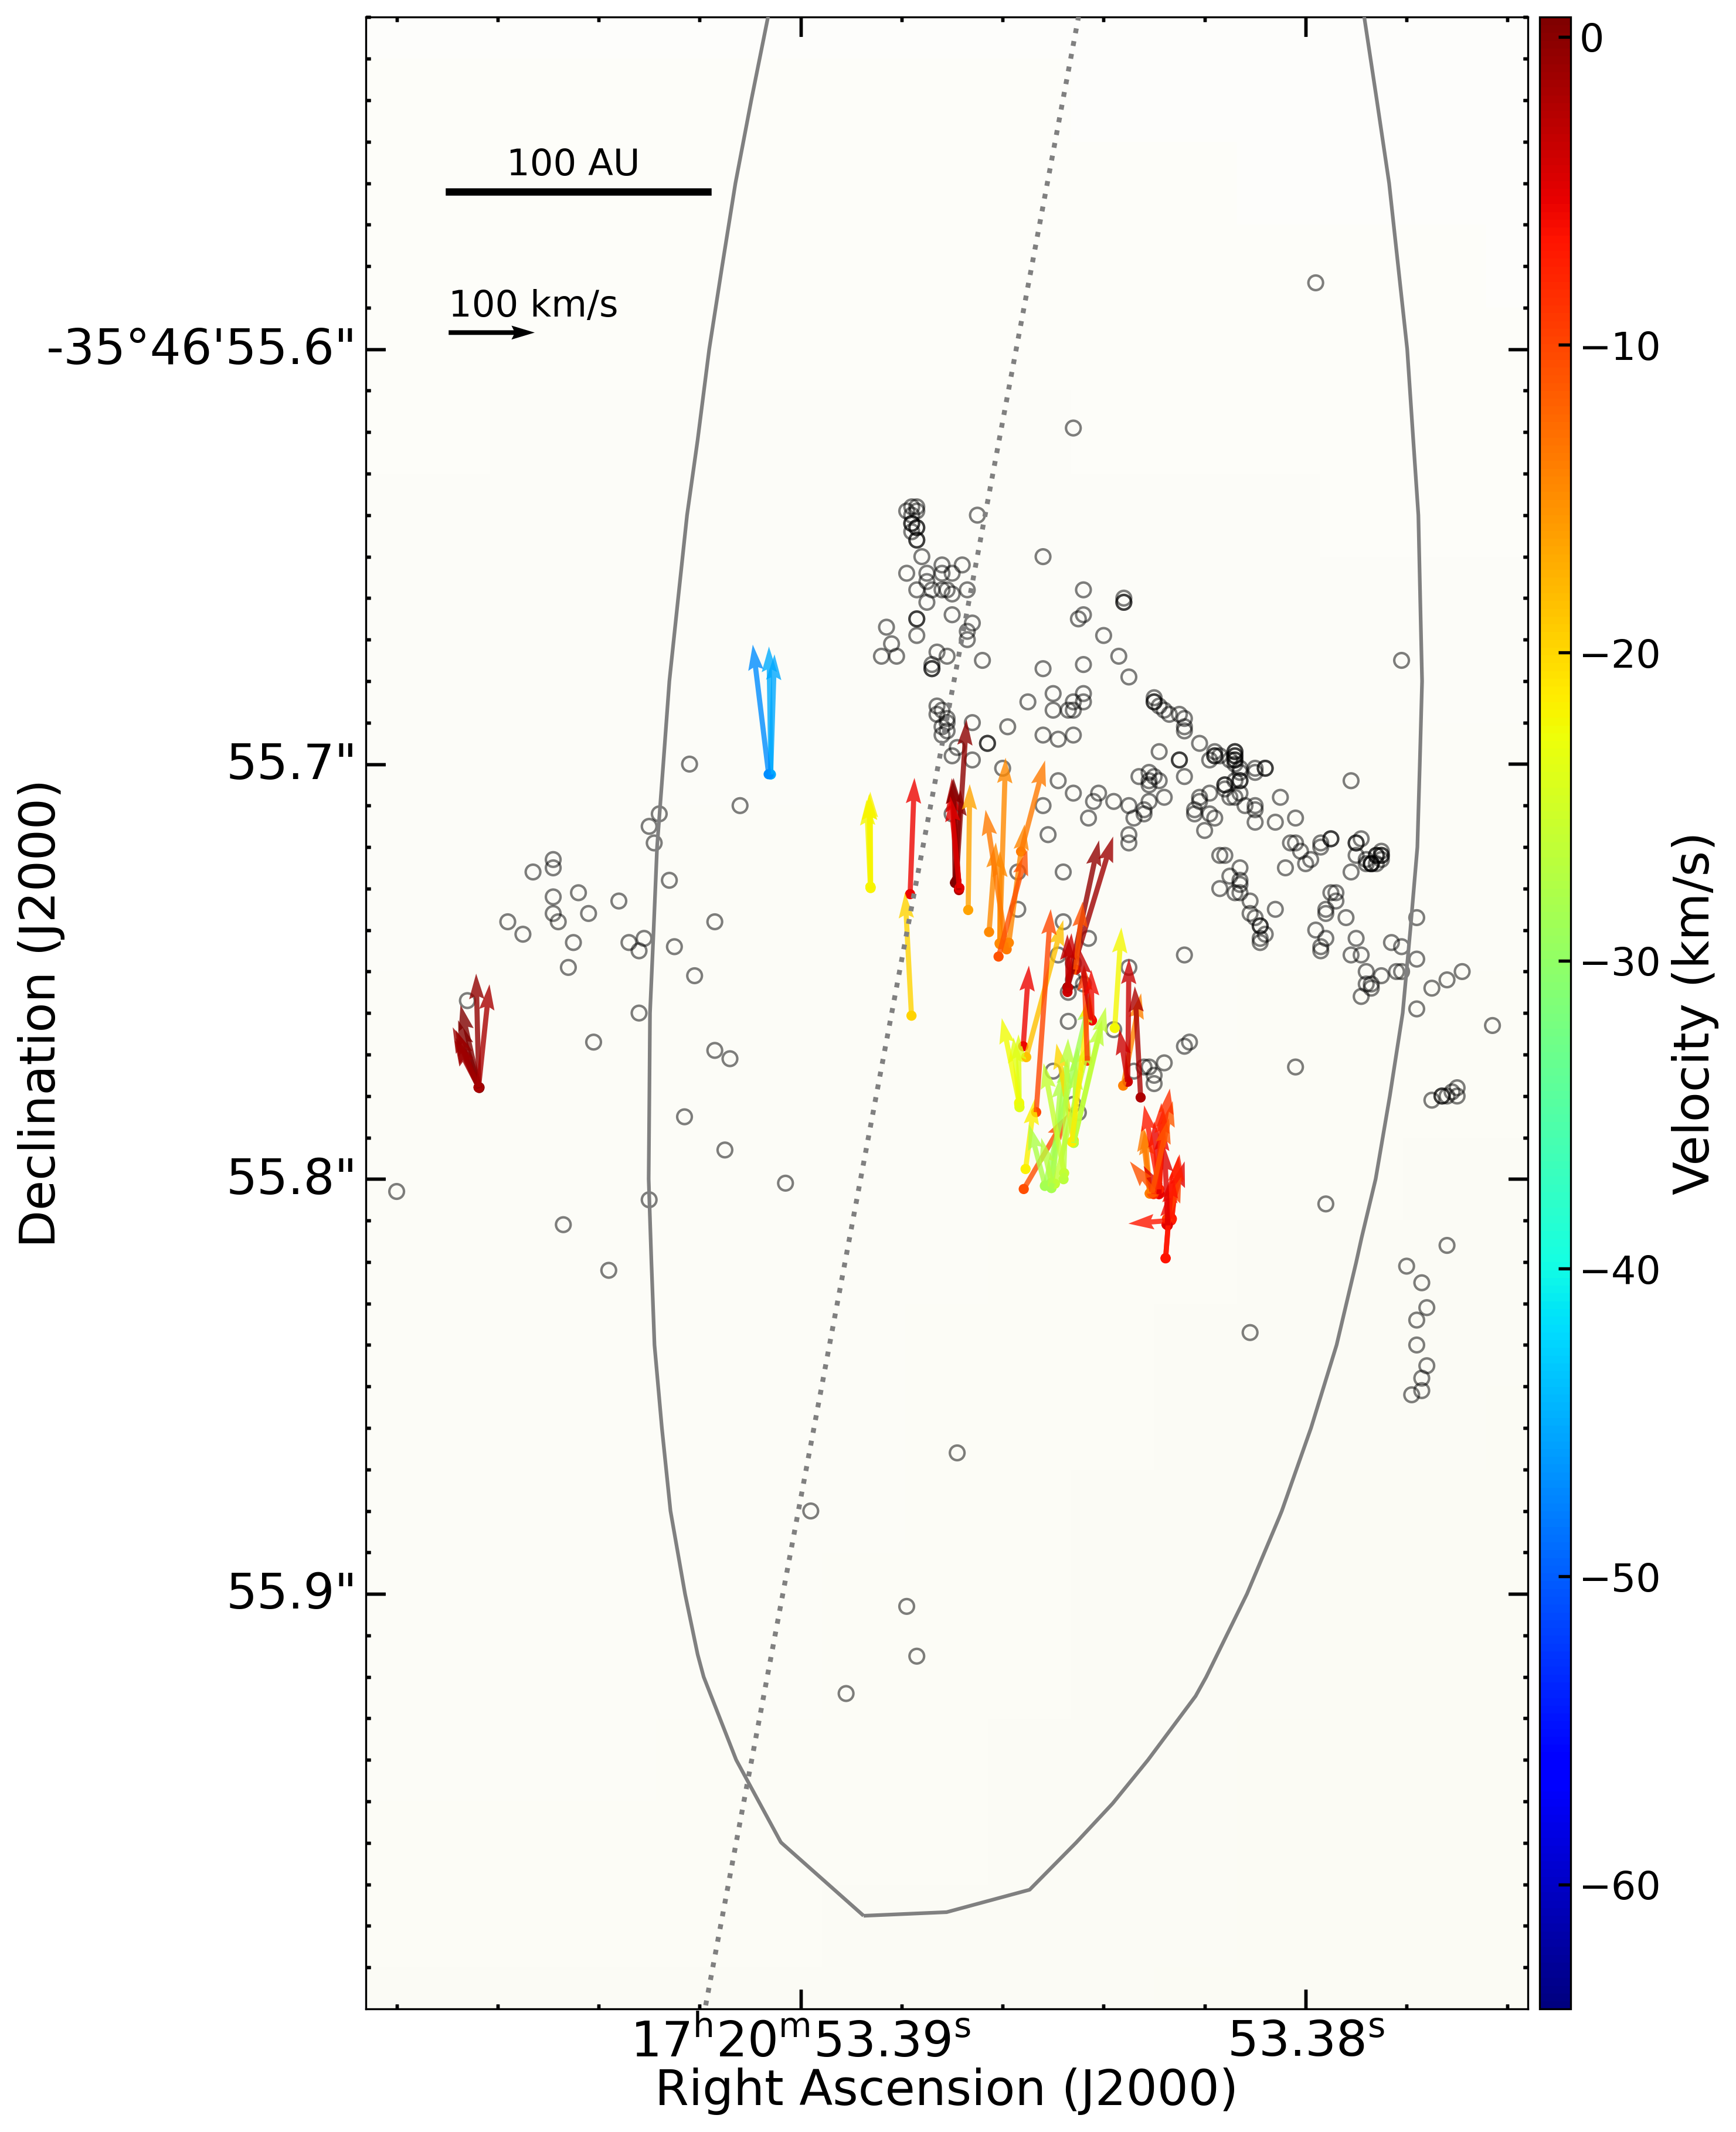
The northernmost region, CM2-W2, is 2750 AU from MM1B with 87 proper motions. Figure 4 shows the spacial distribution, and proper motions of the H2O masers in the region. There were 39 maser features detected in all three epochs. The proper motions have a spatial distribution comparable to a bow-shock shaped structure. Most of the proper motions point north, with an average velocity of 112 km s-1. The region also shows a drastic gradient throughout the structure with 0.63 km s-1. The proper motions detected spanned a linear size of 219 AU from east to west.
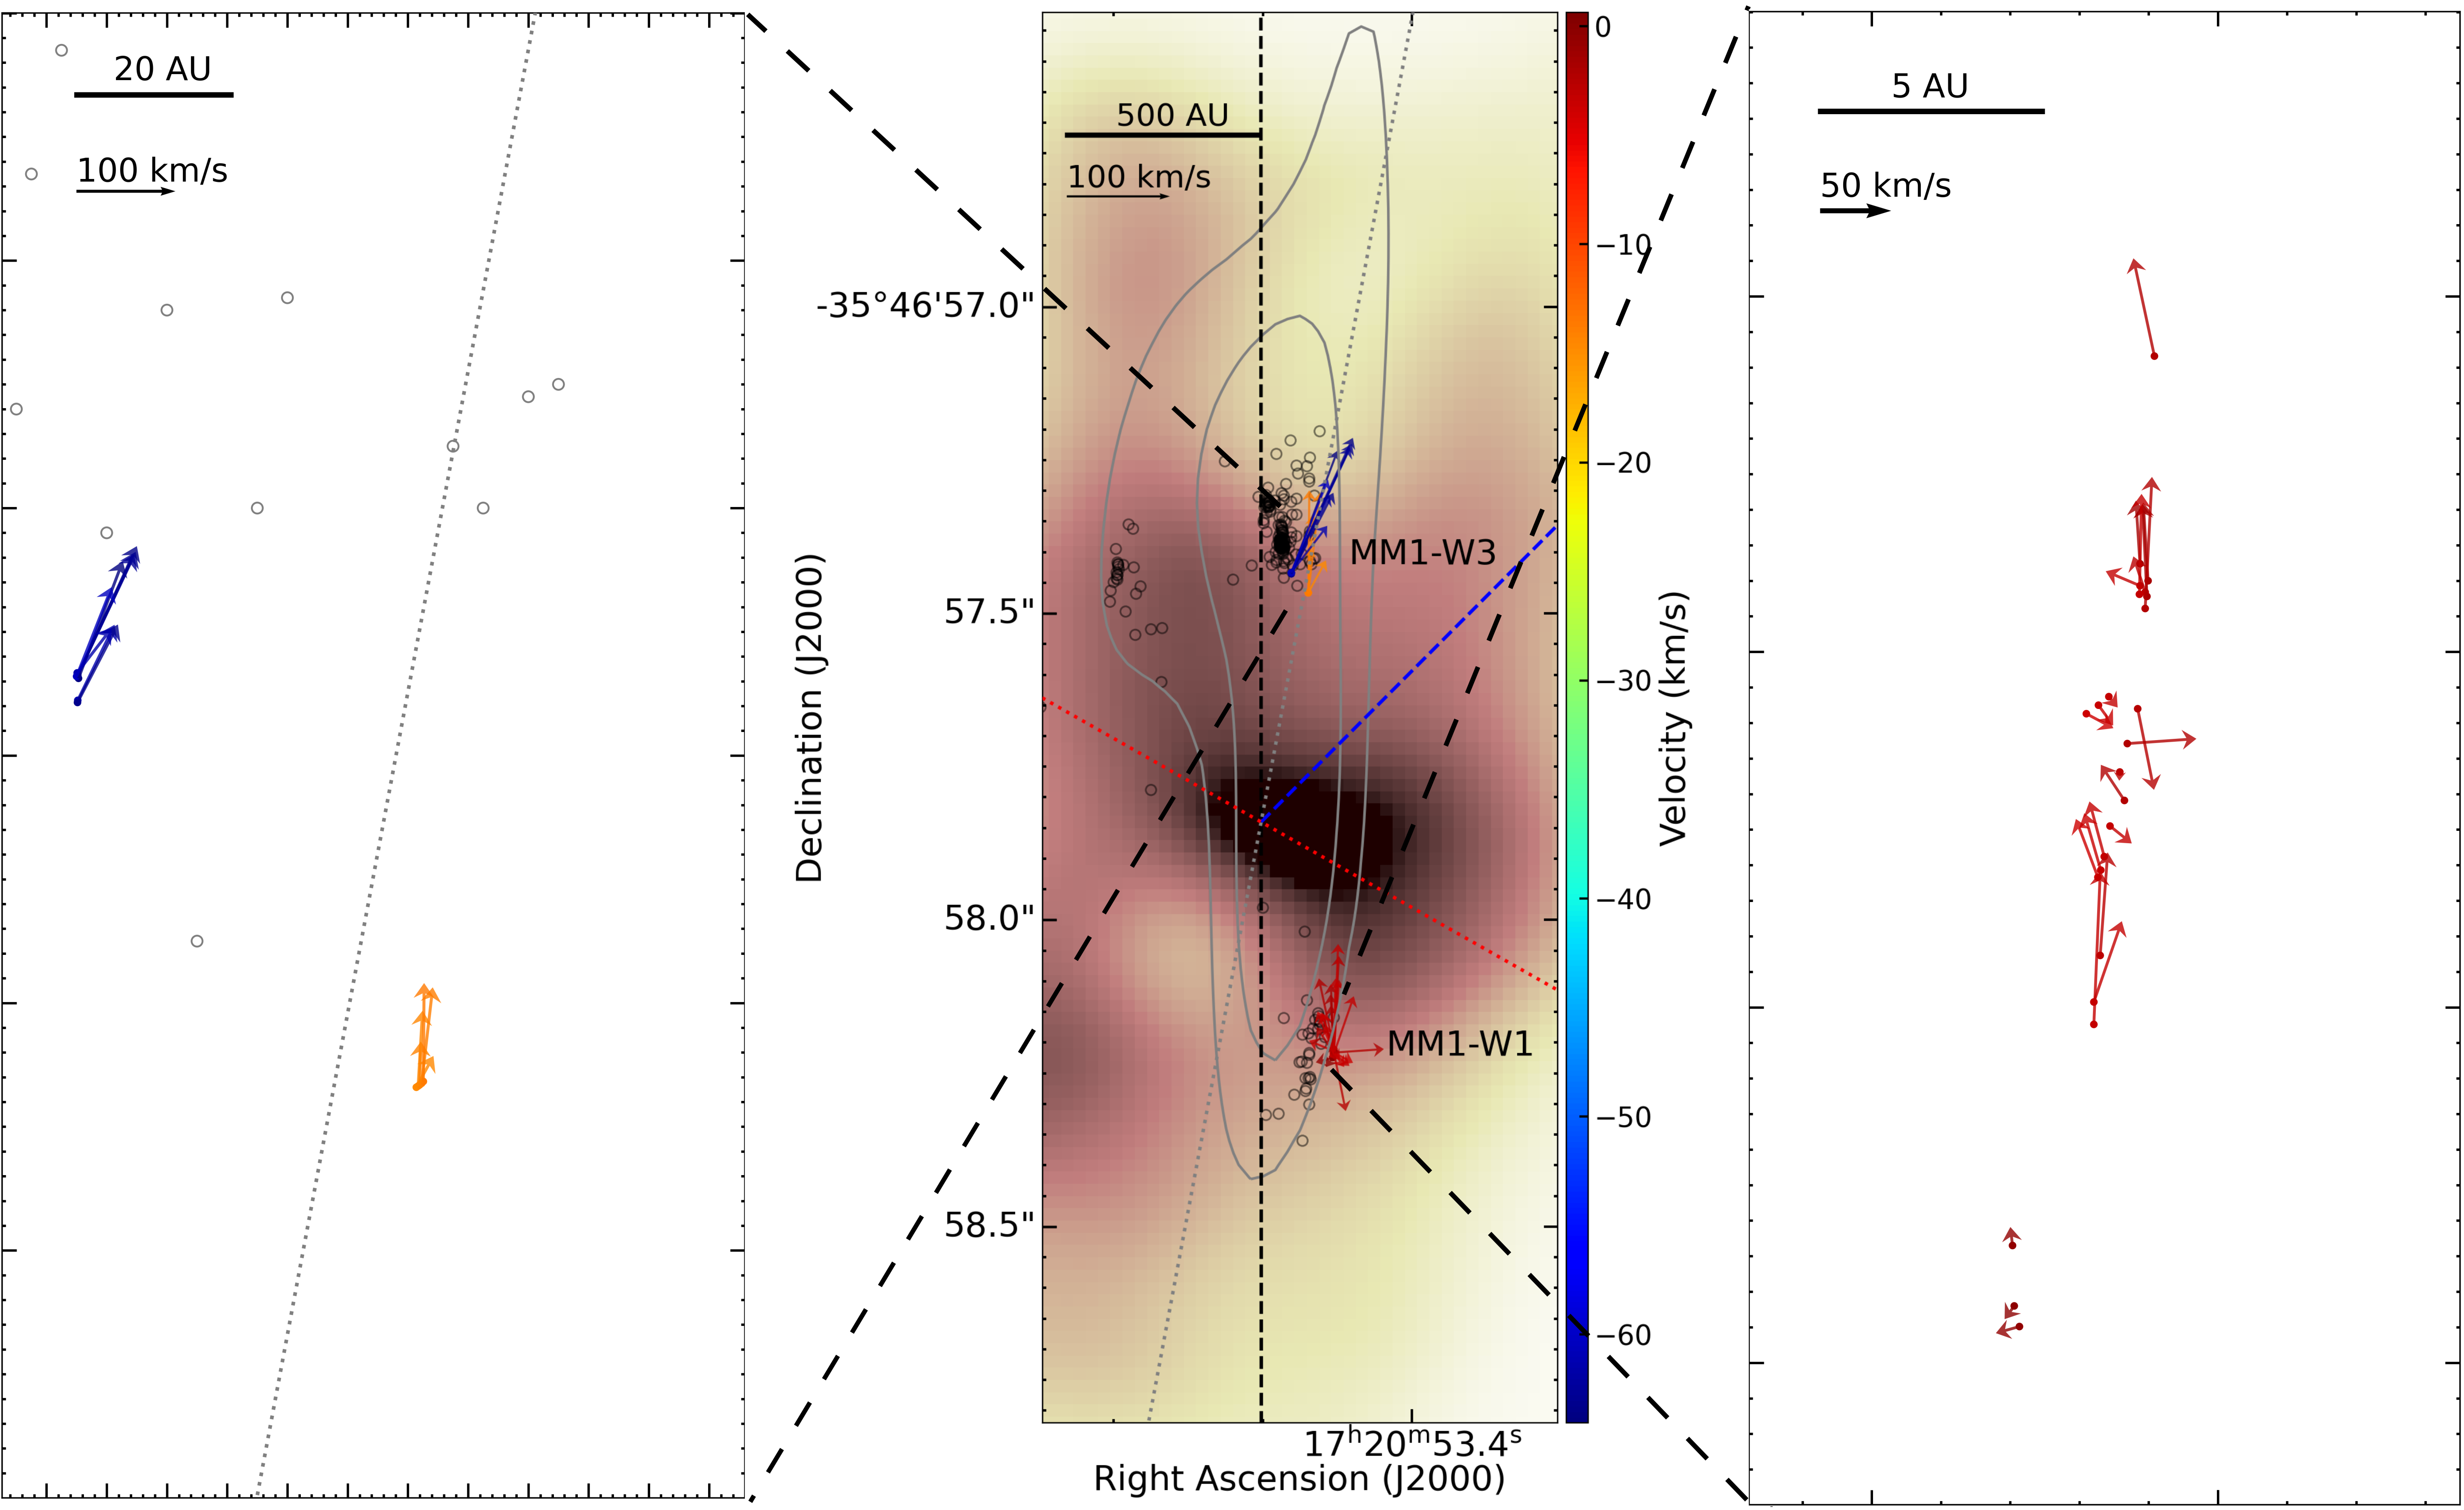
MM1-W1 is found just below MM1B ( 510 AU) and is a more complicated region, with proper motions pointing in various directions. The maser spots showing a linear structure with a length of 18 AU. Figure 5 shows high resolution images of the spatial distribution and proper motions of water masers in MM1-W1 and MM1-W3. We detected 25 proper motions, 14 traced in three epochs. The average velocity of the region is 43 km s-1 and km s-1. The region shows great variation in proper motion direction and magnitude over a relatively small region although there is not a large gradient. The region contains a number of high velocity proper motions pointing northward with an average velocity of 54 km s-1. The complexity of the observed proper motions can be attributed to the combined influence of the MM1 northeast-southwest, CS(6-5) north-source bipolar outflows, and the radio jet. The relative error in proper motion of this region is only 20% for most of the constituent proper motions, indicating that the proper motions do reflect multiple influences on the motion of the masing cloudlets in the region.
MM1-W3 is the maser group just north of MM1B ( 510 AU). We detected 13 proper motions with an average velocity of 106 km s-1. The region has two distinct associations. The north-eastern association consists of 8 proper motions, 5 are traced in all three epochs. The proper motions point north-west with an average of 126 km s-1 and a radial velocity km s-1. The second association points northward, with 4 of the 5 proper motions only being traced in two epochs. The average velocity of the association is 72 km s-1 and 14 km s-1. The linear separation between the two associations is 55 AU. UCHII-W1 is about 4300 AU south of MM1B. We detected 48 proper motions, with 37 traced in three epochs. The region has an average velocity of 64 km s-1. There is a small radial velocity gradient with km s-1. It should be noted that the maser spot distribution in this region was very complicated and the tracing of proper motions was difficult. Figure 6 shows the spacial distribution and proper motions of masers in the MM3-UCHII region and a high resolution image of proper motions in UCHII-W1. Our results show a bulk motion to the north.
UCHII-W3 is well south of MM1 ( 2600 AU), corresponding to the edge of a jet traced by a CS (6-5) map from Brogan et al. (2018). We detected 4 proper motions with an average velocity of 89 km s-1 pointing to the south-east. Two maser associations are resolved 43 AU apart, the eastern association has an average velocity of 96 km s-1 and km s-1. The western region has an average velocity of 81 km s-1 and km s-1.
4 Discussion
4.1 VVCM analysis
In order to characterize the proper motions of the outflow, we used the position variance-covariance matrix and velocity variance-covariance matrix (PVCM and VVCM) as described by Bloemhof (1993, 2000) and Chibueze et al. (2012). These matrices provide a robust and objective means of extracting the position and kinematic essentials from maser proper motions. The PVCM and VVCM, , are constructed using:
| (1) |
with iterating over the spatial axes ( for the position variance-covariance matrix) and (, for the velocity variance-covariance matrix), the th of maser spots/proper motions (=186). The bar indicates the average over all proper motions. The diagonal entries of the matrix is the variance of the variable while the off-diagonal entries are the covariance of two variables.
The PVCM gives a 2 2 matrix and using all the regions except UCHII-W1, the PVCM (in units of arcsec2) and its diagonalization was obtained to be:
| (2) |
The corresponding 3 3 VVCM matrix and its diagonalization (in units of km2 s-2) is given by:
| (3) |
Table 2 shows the results of a PVCM and VVCM analyses. In Table 2, indicates the largest eigenvalue of the PVCM/VVCM matrix, the smallest eigenvalue and the middle-valued eigenvalue for the VVCM matrix. The large difference in the magnitudes of the eigenvalues of both position and velocity variance matrices demonstrates the presence of a distinct spatial and kinematic axis in the data. The major axis is defined by the eigenvector corresponding to the largest eigenvalue. The position angle is calculated by projecting the major axis onto the celestial sphere. The axis from the VVCM is plotted on Figure 3 (and its zoom-ins) with a P.A. of -79.4∘ and passing through the position of MM1B from Brogan et al. (2016). The error in the position angle was calculated using a Monte-Carlo error of the velocity vectors. UCHII-W1 was not included as the direction of its motion does not seem to be influenced by the jet from MM1B. It should also be noted that including UCHII-W1 into the calculation makes only a marginal difference in the results (PA , ). The axis derived aligns very well with a bipolar outflow terminating at CM2-W2 and UCHII-W3. Assuming the bow shock in CM2 is symmetric, the inferred inclination angle for this outflow from matrix 2 is
4.2 Jet, cavity and shock structures in MM1
High proper motions of H2O near the path of the radio jet of Cepheus A-HW2 is attributed to the influence of the fast moving jet (Torrelles et al., 2011). Typical proper motions of low velocity outflows and expanding ring/bubble structures are 10 km s-1(Torrelles et al., 2011; Chibueze et al., 2012, 2014). With the mean H2O maser proper motion of 86 km s-1, the masing cloudlets in NGC 6334Iare driven by the jet in MM1.
Our VVCM analysis indicate the northwest-southeast axis of the jet driving the maser proper motions (at least of CM2-W2, MM1-W3, MM1-W1, UCHII-W3) as shown with dotted gray lines in Figure 3. Interestingly, this axis cut through dips in ALMA dust continuum, one in the northwest and the other in the southeast. We interpret these dips as cavities ploughed by the jets and this agrees with the suggested excavated outflow cavity by Brogan et al. (2018).
To test the possibility of precession in the jet motion, we compare the position angle of the VVCM results derived with all maser regions with those of the inner regions. About 10∘ difference is observed between the two position angles. This could be an indication of jet precession. MM1-W1 and MM1-W3 masers are closer to MM1 (driving source of the jet) and assuming a jet velocity of 150 km s-1, it will take 95 years for a jet launched by MM1 to reach the location of CM2.
The synchrotron continuum point source CM2 (Brogan et al., 2018), located north-west of the radio jet of MM1B, host the bright masers in the region and its nature has been discussed in Brogan et al. (2018). The observed proper motions of H2O masers in CM2 is similar to those reported in Burns et al. (2016). In a study of S255IR-SMA1 they reported a bow shock shape traced in H2O masers with a velocity of 20 km s-1, and a gradient throughout the shock. They also reported three distinct ejections, with the most recent ejection being the shock traced in H2O masers with a dynamical timescale years. Ogbodo et al. (2017) also reported a bow-shock structure for IRAS 20231+3440 traced with H2O masers, with an average maser velocity of 14.26 km s-1. These studies report bow-shock maser velocities significantly lower than we found in NGC 6334I. Further studies into the driving mechanisms of the jets and outflows of NGC 6334I and other sources are necessary to explain the bow-shock velocity discrepancies. This and the above mentioned studies (among others) indicate that a high velocity (V 10 km s-1 H2O maser proper motions in a bow-shock shape might be a common tracer for jets in massive protostars.
4.3 Impact of MM3-UCHII on UCHII-W1 maser spatio-kinematics
Brogan et al. (2018) reported a bulk motion of 11212 km s-1for the UCHII-W1 maser group using multi-epoch VLA observations between 2011 (pre-burst) and 2017 (post-burst). They suggested that the H2O masers of the two 2017 epochs are possibly pumped by the beamed radiation from MM1B. The proper motions of UCHII-W1 point northward against the direction of the jet. This suggests that spatio-kinematics of the masing gas in this sub-region is not driven by the jet but by the MM3-UCHII .
We investigated the possibility that the magnetic field reversal reported by Caswell et al. (2011) and Hunter et al. (2018) are responsible for the northward proper motion of UCHII-W1 H2O masers. A reversal in magnetic field is reported in OH masers in UCHII-OH6 (located 0.35 south-west of UCHII-W1) and UCHII-OH7 (located 0.7 south of UCHII-W3) (see Figure 5 and Table 8 of Hunter et al. (2018)). The reversed Zeeman splitted OH masers are 500 au from UCHII-W1 and rather closer to UCHII-W3 and W2 (see Brogan et al. (2018)), therefore may not be responsible for the observed northward proper motions of UCHII-W1 masers. The UCHII-W1 proper motion is likely driven by MM3-UCHII or by the outflow of TPR-9 (with X-ray counterpart, CXOU 172053.21-354726.4) infrared star (Tapia et al., 1996) as suggested by Brogan et al. (2018).
5 Conclusions and summary
We reported for the first time the spatio-kinematic of H2O masers in a massive star-forming region (NGC 6334I) just after an accretion event. The proper motions of the H2O masers in CM2-W2, MM1-W3, MM1-W1, UCHII-W3 are mostly driven by the radio jet of MM1-B. However, some influence from the outflowing gas in MM1 NW-SE bipolar outflow and MM1B NW outflow cannot be completely excluded.
Our results suggested that the motion of the UCHII-W1 H2O maser group is largely driven by the expansion of MM3-UCHII . The significance of impact of the accretion event on the proper motions of the H2O maser, with special consideration of the destruction and re-excitation of the H2O masers in the region, will be presented in Vorster et al. (in prep.), which will compare the pre-burst and post-burst H2O maser proper motions. The impact of a heat wave, such as the one reported in Burns et al. (2020), will be explored with the pre-accretion burst VLBI H2O maser data.
| ID | Region | Offset | Proper Motion | Radial Motion | Detections | ||||||
|---|---|---|---|---|---|---|---|---|---|---|---|
| 1 | 2 | 3 | |||||||||
| (″) | (mas yr-1) | (km s-1) | |||||||||
| CM2-W2 | |||||||||||
| CM2-W2 | |||||||||||
| CM2-W2 | |||||||||||
| CM2-W2 | |||||||||||
| CM2-W2 | |||||||||||
| CM2-W2 | |||||||||||
| CM2-W2 | |||||||||||
| CM2-W2 | |||||||||||
| CM2-W2 | |||||||||||
| CM2-W2 | |||||||||||
| CM2-W2 | |||||||||||
| CM2-W2 | |||||||||||
| CM2-W2 | |||||||||||
| CM2-W2 | |||||||||||
| CM2-W2 | |||||||||||
| CM2-W2 | |||||||||||
| CM2-W2 | |||||||||||
| CM2-W2 | |||||||||||
| CM2-W2 | |||||||||||
| CM2-W2 | |||||||||||
| CM2-W2 | |||||||||||
| CM2-W2 | |||||||||||
| CM2-W2 | |||||||||||
| CM2-W2 | |||||||||||
| CM2-W2 | |||||||||||
| CM2-W2 | |||||||||||
| CM2-W2 | |||||||||||
| CM2-W2 | |||||||||||
| CM2-W2 | |||||||||||
| CM2-W2 | |||||||||||
| CM2-W2 | |||||||||||
| CM2-W2 | |||||||||||
| CM2-W2 | |||||||||||
| CM2-W2 | |||||||||||
| CM2-W2 | |||||||||||
| CM2-W2 | |||||||||||
| CM2-W2 | |||||||||||
| CM2-W2 | |||||||||||
| CM2-W2 | |||||||||||
| CM2-W2 | |||||||||||
| CM2-W2 | |||||||||||
| CM2-W2 | |||||||||||
| CM2-W2 | |||||||||||
| CM2-W2 | |||||||||||
| CM2-W2 | |||||||||||
| CM2-W2 | |||||||||||
| CM2-W2 | |||||||||||
| CM2-W2 | |||||||||||
| CM2-W2 | |||||||||||
| CM2-W2 | |||||||||||
| CM2-W2 | |||||||||||
| CM2-W2 | |||||||||||
| CM2-W2 | |||||||||||
| CM2-W2 | |||||||||||
| CM2-W2 | |||||||||||
| CM2-W2 | |||||||||||
| CM2-W2 | |||||||||||
| CM2-W2 | |||||||||||
| CM2-W2 | |||||||||||
| CM2-W2 | |||||||||||
| CM2-W2 | |||||||||||
| CM2-W2 | |||||||||||
| CM2-W2 | |||||||||||
| CM2-W2 | |||||||||||
| CM2-W2 | |||||||||||
| CM2-W2 | |||||||||||
| CM2-W2 | |||||||||||
| CM2-W2 | |||||||||||
| CM2-W2 | |||||||||||
| CM2-W2 | |||||||||||
| CM2-W2 | |||||||||||
| CM2-W2 | |||||||||||
| CM2-W2 | |||||||||||
| CM2-W2 | |||||||||||
| CM2-W2 | |||||||||||
| CM2-W2 | |||||||||||
| CM2-W2 | |||||||||||
| CM2-W2 | |||||||||||
| CM2-W2 | |||||||||||
| CM2-W2 | |||||||||||
| CM2-W2 | |||||||||||
| CM2-W2 | |||||||||||
| CM2-W2 | |||||||||||
| CM2-W2 | |||||||||||
| CM2-W2 | |||||||||||
| CM2-W2 | |||||||||||
| CM2-W2 | |||||||||||
| MM1-W1 | |||||||||||
| MM1-W1 | |||||||||||
| MM1-W1 | |||||||||||
| MM1-W1 | |||||||||||
| MM1-W1 | |||||||||||
| MM1-W1 | |||||||||||
| MM1-W1 | |||||||||||
| MM1-W1 | |||||||||||
| MM1-W1 | |||||||||||
| MM1-W1 | |||||||||||
| MM1-W1 | |||||||||||
| MM1-W1 | |||||||||||
| MM1-W1 | |||||||||||
| MM1-W3 | |||||||||||
| MM1-W3 | |||||||||||
| MM1-W3 | |||||||||||
| MM1-W3 | |||||||||||
| MM1-W3 | |||||||||||
| MM1-W3 | |||||||||||
| MM1-W3 | |||||||||||
| MM1-W3 | |||||||||||
| MM1-W3 | |||||||||||
| MM1-W3 | |||||||||||
| MM1-W3 | |||||||||||
| MM1-W3 | |||||||||||
| MM1-W3 | |||||||||||
| MM1-W3 | |||||||||||
| MM1-W3 | |||||||||||
| MM1-W3 | |||||||||||
| MM1-W3 | |||||||||||
| MM1-W3 | |||||||||||
| MM1-W3 | |||||||||||
| MM1-W3 | |||||||||||
| MM1-W3 | |||||||||||
| MM1-W3 | |||||||||||
| MM1-W3 | |||||||||||
| MM1-W3 | |||||||||||
| MM1-W3 | |||||||||||
| UCHII-W3 | |||||||||||
| UCHII-W3 | |||||||||||
| UCHII-W3 | |||||||||||
| UCHII-W3 | |||||||||||
| UCHII-W1 | |||||||||||
| UCHII-W1 | |||||||||||
| UCHII-W1 | |||||||||||
| UCHII-W1 | |||||||||||
| UCHII-W1 | |||||||||||
| UCHII-W1 | |||||||||||
| UCHII-W1 | |||||||||||
| UCHII-W1 | |||||||||||
| UCHII-W1 | |||||||||||
| UCHII-W1 | |||||||||||
| UCHII-W1 | |||||||||||
| UCHII-W1 | |||||||||||
| UCHII-W1 | |||||||||||
| UCHII-W1 | |||||||||||
| UCHII-W1 | |||||||||||
| UCHII-W1 | |||||||||||
| UCHII-W1 | |||||||||||
| UCHII-W1 | |||||||||||
| UCHII-W1 | |||||||||||
| UCHII-W1 | |||||||||||
| UCHII-W1 | |||||||||||
| UCHII-W1 | |||||||||||
| UCHII-W1 | |||||||||||
| UCHII-W1 | |||||||||||
| UCHII-W1 | |||||||||||
| UCHII-W1 | |||||||||||
| UCHII-W1 | |||||||||||
| UCHII-W1 | |||||||||||
| UCHII-W1 | |||||||||||
| UCHII-W1 | |||||||||||
| UCHII-W1 | |||||||||||
| UCHII-W1 | |||||||||||
| UCHII-W1 | |||||||||||
| UCHII-W1 | |||||||||||
| UCHII-W1 | |||||||||||
| UCHII-W1 | |||||||||||
| UCHII-W1 | |||||||||||
| UCHII-W1 | |||||||||||
| UCHII-W1 | |||||||||||
| UCHII-W1 | |||||||||||
| UCHII-W1 | |||||||||||
| UCHII-W1 | |||||||||||
| UCHII-W1 | |||||||||||
| UCHII-W1 | |||||||||||
| UCHII-W1 | |||||||||||
| UCHII-W1 | |||||||||||
| UCHII-W1 | |||||||||||
| UCHII-W1 | |||||||||||
| UCHII-W1 | |||||||||||
| UCHII-W1 | |||||||||||
| UCHII-W1 | |||||||||||
| UCHII-W1 | |||||||||||
| UCHII-W1 | |||||||||||
| UCHII-W1 | |||||||||||
| UCHII-W1 | |||||||||||
| UCHII-W1 | |||||||||||
| UCHII-W1 | |||||||||||
Note. — Maser feature ID.
Offsets are with respect to the reference maser at = (1720’52.600”, -35∘46’50.508”)
| Diagonalization of the Position Variance/Covariance Matrices | |||||||
|---|---|---|---|---|---|---|---|
| Matrix No. | PA | ||||||
| (10-6arcsec2) | (10-6arcsec2) | (∘) | |||||
| 1 | 0.897 | 0.003 | 79.3 | ||||
| 2 | 0.545 | 0.002 | 79.0 | ||||
| 3 | 0.152 | 0.0001 | -84.4 | ||||
| Diagonalization of the Velocity Variance/Covariance Matrices | |||||||
| Matrix No. | PA | PA | |||||
| (km2s-2) | (km2s-2) | (km2s-2) | (∘) | (∘) | (∘) | (∘) | |
| 1 | 3511.08 | 452.48 | 201.79 | -79.4 9.2 | 8.8 1.1 | -32.4 3.2 | -2.9 0.3 |
| 2 | 3321.62 | 274.64 | 148.94 | -77.9 10.6 | 11.8 1.5 | -6.0 0.6 | -2.9 0.3 |
| 3 | 2604.80 | 582.89 | 93.42 | -67.1 12.7 | 63.5 12.0 | 42.8 7.6 | 35.1 6.3 |
Note. —
1: CM2-W2, MM1-W1, MM1-W3 & UCHII-W3. All the maser regions associated with the jet.
2: CM2-W2 & UCHII-W3. The maser regions furthest from MM1B
3: MM1-W1 & MM1-W3. The maser regions closest to MM1B
Position angle of the axis with the largest eigenvalue
Position angle of the axis with the second largest eigenvalue
Inclination angle of the axis corresponding to with respect to the sky plane.
Inclination angle of the axis corresponding to with respect to the sky plane.
References
- Bachiller & Cernicharo (1990) Bachiller, R., & Cernicharo, J. 1990, A&A, 239, 276
- Bloemhof (1993) Bloemhof, E. E. 1993, ApJ, 406, L75, doi: 10.1086/186790
- Bloemhof (2000) —. 2000, ApJ, 533, 893, doi: 10.1086/308714
- Breen et al. (2019) Breen, S. L., Sobolev, A. M., Kaczmarek, J. F., et al. 2019, ApJ, 876, L25, doi: 10.3847/2041-8213/ab191c
- Brogan et al. (2016) Brogan, C. L., Hunter, T. R., Cyganowski, C. J., et al. 2016, ApJ, 832, 187, doi: 10.3847/0004-637X/832/2/187
- Brogan et al. (2018) —. 2018, ApJ, 866, 87, doi: 10.3847/1538-4357/aae151
- Brogan et al. (2019) Brogan, C. L., Hunter, T. R., Towner, A. P. M., et al. 2019, ApJ, 881, L39, doi: 10.3847/2041-8213/ab2f8a
- Burns et al. (2016) Burns, R. A., Handa, T., Nagayama, T., Sunada, K., & Omodaka, T. 2016, MNRAS, 460, 283, doi: 10.1093/mnras/stw958
- Burns et al. (2020) Burns, R. A., Sugiyama, K., Hirota, T., et al. 2020, Nature Astronomy, 4, 506, doi: 10.1038/s41550-019-0989-3
- Caratti o Garatti et al. (2017) Caratti o Garatti, A., Stecklum, B., Garcia Lopez, R., et al. 2017, Nature Physics, 13, 276, doi: 10.1038/nphys3942
- Caswell et al. (2011) Caswell, J. L., Kramer, B. H., & Reynolds, J. E. 2011, MNRAS, 414, 1914, doi: 10.1111/j.1365-2966.2011.18510.x
- Chen et al. (2020a) Chen, X., Sobolev, A. M., Ren, Z.-Y., et al. 2020a, Nature Astronomy, doi: 10.1038/s41550-020-1144-x
- Chen et al. (2020b) Chen, X., Sobolev, A. M., Breen, S. L., et al. 2020b, ApJ, 890, L22, doi: 10.3847/2041-8213/ab72a5
- Chibueze et al. (2012) Chibueze, J. O., Imai, H., Tafoya, D., et al. 2012, ApJ, 748, 146, doi: 10.1088/0004-637X/748/2/146
- Chibueze et al. (2014) Chibueze, J. O., Omodaka, T., Handa, T., et al. 2014, ApJ, 784, 114, doi: 10.1088/0004-637X/784/2/114
- Hunter et al. (2006) Hunter, T. R., Brogan, C. L., Megeath, S. T., et al. 2006, ApJ, 649, 888, doi: 10.1086/505965
- Hunter et al. (2017) Hunter, T. R., Brogan, C. L., MacLeod, G., et al. 2017, ApJ, 837, L29, doi: 10.3847/2041-8213/aa5d0e
- Hunter et al. (2018) Hunter, T. R., Brogan, C. L., MacLeod, G. C., et al. 2018, ApJ, 854, 170, doi: 10.3847/1538-4357/aaa962
- Leurini et al. (2006) Leurini, S., Schilke, P., Parise, B., et al. 2006, A&A, 454, L83, doi: 10.1051/0004-6361:20065338
- MacLeod et al. (2018) MacLeod, G. C., Smits, D. P., Goedhart, S., et al. 2018, MNRAS, 478, 1077, doi: 10.1093/mnras/sty996
- MacLeod et al. (2019) MacLeod, G. C., Sugiyama, K., Hunter, T. R., et al. 2019, MNRAS, 489, 3981, doi: 10.1093/mnras/stz2417
- McCutcheon et al. (2000) McCutcheon, W. H., Sandell, G., Matthews, H. E., et al. 2000, MNRAS, 316, 152, doi: 10.1046/j.1365-8711.2000.03487.x
- McGuire et al. (2018) McGuire, B. A., Brogan, C. L., Hunter, T. R., et al. 2018, ApJ, 863, L35, doi: 10.3847/2041-8213/aad7bb
- Meyer et al. (2017) Meyer, D. M. A., Vorobyov, E. I., Kuiper, R., & Kley, W. 2017, MNRAS, 464, L90, doi: 10.1093/mnrasl/slw187
- Moscadelli et al. (2011) Moscadelli, L., Cesaroni, R., Rioja, M. J., Dodson, R., & Reid, M. J. 2011, A&A, 526, A66, doi: 10.1051/0004-6361/201015641
- Moscadelli et al. (2017) Moscadelli, L., Sanna, A., Goddi, C., et al. 2017, A&A, 600, L8, doi: 10.1051/0004-6361/201730659
- Ogbodo et al. (2017) Ogbodo, C. S., Burns, R. A., Handa, T., et al. 2017, MNRAS, 469, 4788, doi: 10.1093/mnras/stx1154
- Qiu et al. (2011) Qiu, K., Wyrowski, F., Menten, K. M., et al. 2011, ApJ, 743, L25, doi: 10.1088/2041-8205/743/1/L25
- Reid et al. (2014) Reid, M. J., Menten, K. M., Brunthaler, A., et al. 2014, ApJ, 783, 130, doi: 10.1088/0004-637X/783/2/130
- Sugiyama et al. (2019) Sugiyama, K., Saito, Y., Yonekura, Y., & Momose, M. 2019, The Astronomer’s Telegram, 12446
- Szymczak et al. (2018) Szymczak, M., Olech, M., Wolak, P., Gérard, E., & Bartkiewicz, A. 2018, A&A, 617, A80, doi: 10.1051/0004-6361/201833443
- Tapia et al. (1996) Tapia, M., Persi, P., & Roth, M. 1996, A&A, 316, 102
- Torrelles et al. (2011) Torrelles, J. M., Patel, N. A., Curiel, S., et al. 2011, MNRAS, 410, 627, doi: 10.1111/j.1365-2966.2010.17483.x
- Torrelles et al. (2014) Torrelles, J. M., Curiel, S., Estalella, R., et al. 2014, MNRAS, 442, 148, doi: 10.1093/mnras/stu847
- Visser et al. (2015) Visser, R., Bergin, E. A., & Jørgensen, J. K. 2015, A&A, 577, A102, doi: 10.1051/0004-6361/201425365
- Volvach et al. (2020) Volvach, A. E., Volvach, L. N., Larionov, M. G., et al. 2020, MNRAS, 494, L59, doi: 10.1093/mnrasl/slaa036
- Wu et al. (2014) Wu, Y. W., Sato, M., Reid, M. J., et al. 2014, A&A, 566, A17, doi: 10.1051/0004-6361/201322765