Predicting Participation in Cancer Screening Programs with Machine Learning
Abstract.
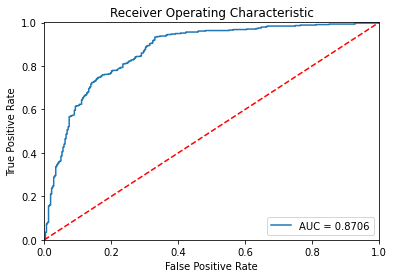
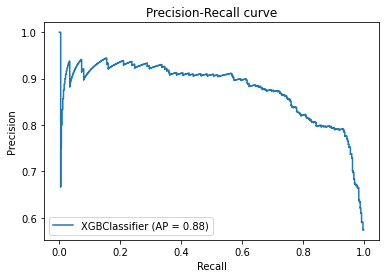
In this paper, we present machine learning models based on random forest classifiers, support vector machines, gradient boosted decision trees, and artificial neural networks to predict participation in cancer screening programs in South Korea. The top performing model was based on gradient boosted decision trees and achieved an area under the receiver operating characteristic curve (AUC-ROC) of 0.8706 and average precision of 0.8776. The results of this study are encouraging and suggest that with further research, these models can be directly applied to Korea’s healthcare system, thus increasing participation in Korea’s National Cancer Screening Program.
1. Introduction
In South Korea, cancer is the leading cause of death. In fact, in 2018, cancer was responsible for 26.5% of all deaths in the country ([9]). As the early detection and diagnosis of cancers increase a patient’s change of survival considerably, the Korean government established a National Cancer Screening Program, covering 6 major cancers, including gastric cancer, colorectal cancer, breast cancer, cervical cancer, liver cancer, and lung cancer. To increase participation in this program, the government offers free screening tests for National Health Insurance (NHI) beneficiaries in the lower 50% income bracket; for those in the upper 50% income bracket, 90% of associated costs are covered by the NHI ([7]).
However, even with such policies, the participation rate in cancer screening programs was 55.6% in 2019 and showed minimal improvement from 50.1% in 2015 ([8]).
In this paper, we aim to expand upon previous research conducted on the factors associated with participation in cancer screening programs by developing machine learning models to predict participation in cancer screening programs.
First, section 2 will discuss related studies and associated factors. Next, section 3 will present the method with utilized data, selected variables, data pre-processing steps, and chosen algorithms. Finally, sections 4 will present experimental results and sections 5 and 6 will discuss the results and any implications of the findings.
2. Related Studies
A number of studies have been conducted on the factors associated with cancer screening participation. With various statistical tools and models, these studies found that factors including education level, income level, and smoking habits are significantly correlated with participation in cancer screening ([6],[2],[3]).
However, very few studies have been conducted on the application of machine learning to predict cancer screening participation. One particular study utilized a hybrid neural network to predict breast screening attendance (breast cancer) in the United Kingdom and achieved 80% accuracy for the algorithm ([1]). Another study utilized machine learning (support vector machines, random forests, etc.) to predict hospital attendance and achieved 0.852 for the area under receiver operating characteristic curve ([4]).
3. Method
3.1. Data
Data was obtained from the Seventh Korea National Health and Nutrition Examination Survey, including data from 2016 2018. 24269 individuals participated in the survey (10611 households) and participants were chosen through stratified cluster sampling. More specifically, primary sampling units were selected based on results from the annual Population and Housing Census.
Available data for the 3 years ranges from demographic information to dietary habits and includes a total of 852 variables ([5]).
3.2. Features/Variables
Variables were selected based on findings from past studies and their relevance were verified with the Chi-Squared test ([6],[2],[3]). The 55 (89 after pre-processing — one-hot encoding) chosen variables are listed below.
| Variable Description | Variable Type |
|---|---|
| Income Level | Ordinal |
| Education Level | Ordinal |
| Self Perception of Health | Ordinal |
| High Blood Pressure Diagnosis | Binary |
| Hyperlipidemia Diagnosis | Binary |
| Stroke Diagnosis | Binary |
| Myocardial Infarction/Angina Pectoris Diagnosis | Binary |
| Myocardial Infarction Diagnosis | Binary |
| Angina Pectoris Diagnosis | Binary |
| Arthritis Diagnosis | Binary |
| Osteoarthritis Diagnosis | Binary |
| Rheumatoid Arthritis Diagnosis | Binary |
| Osteoporosis Diagnosis | Binary |
| Tuberculosis Diagnosis | Binary |
| Asthma Diagnosis | Binary |
| Diabetes Diagnosis | Binary |
| Thyroid Gland disease Diagnosis | Binary |
| Stomach Cancer Diagnosis | Binary |
| Liver Cancer Diagnosis | Binary |
| Colon Cancer Diagnosis | Binary |
| Breast Cancer Diagnosis | Binary |
| Cervical Cancer Diagnosis | Binary |
| Lung Cancer Diagnosis | Binary |
| Thyroid Cancer Diagnosis | Binary |
| Other-1 Cancer Diagnosis | Binary |
| Other-2 Cancer Diagnosis | Binary |
| Depression Diagnosis | Binary |
| Atopic Dermatitis Diagnosis | Binary |
|---|---|
| Allergic Rhinitis Diagnosis | Binary |
| Sinusitis Diagnosis | Binary |
| Otitis Media Diagnosis | Binary |
| Cataract Diagnosis | Binary |
| Glaucoma Diagnosis | Binary |
| Macular Degeneration Diagnosis | Binary |
| Renal Failure Diagnosis | Binary |
| Hepatitis B Diagnosis | Binary |
| Hepatitis C Diagnosis | Binary |
| Liver Cirrhosis Diagnosis | Binary |
| Influenza Vaccination | Binary |
| Regular Health Check-up | Binary |
| Limited Daily/Social Life | Binary |
| Employment | Binary |
| Self Perception of Stress | Ordinal |
| Regular Exercise | Binary |
| Nutrition Education Status | Binary |
| Private Health Insurance | Binary |
| Type of Health Insurance | Nominal |
| Occupation Type | Nominal |
| Region | Nominal |
| Unmet Healthcare Needs | Nominal |
| Causes of Unmet Healthcare Needs | Nominal |
| Self Perception of Body Image | Ordinal |
| Hospital Admission in Past Year | Binary |
| Drinking Level | Ordinal |
| Smoking Level | Ordinal |
3.3. Data Pre-processing
First, all rows containing unavailable (marked as ”unknown”) or missing (null) values were removed from the data-set. Next, all ordinal categorical variables were label encoded and all nominal categorical variables were one-hot encoded. All variables were scaled with Min-Max scaling to a fixed range (0 to 1) as well.
Finally, the dataset was shuffled and split into training and test sets (ratio of 80/20 respectively).
3.4. Algorithms
Algorithms chosen for this task include random forest classifiers, support vector machines, gradient boosted decision trees (XGBoost), and artificial neural networks (with back-propagation).
For all algorithms, grid search and 5-fold cross validation were performed to find optimal hyper-parameters. Each model was then evaluated with the held-out test set. Note that all experiments were conducted via Google Colaboratory.
4. Results
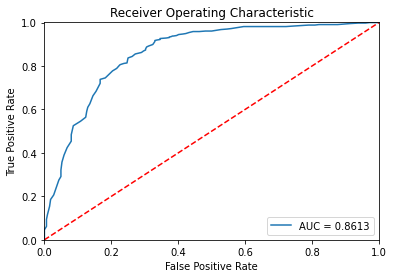
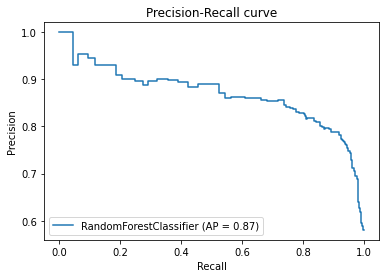
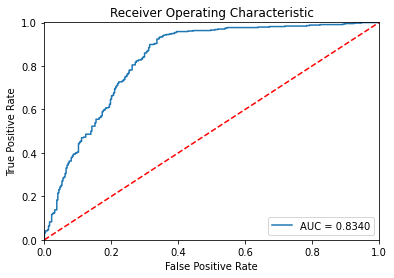
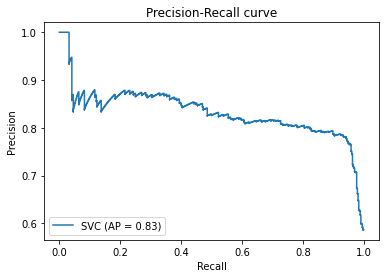
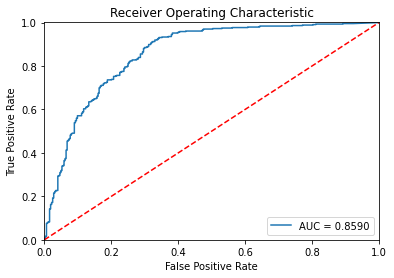
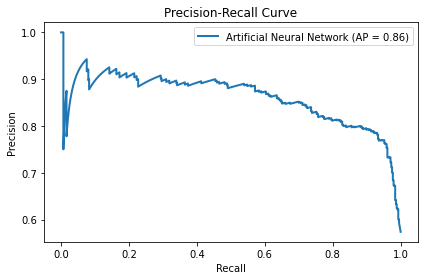
The performance of the 4 algorithms can be found below in Table 2 and corresponding plots for the Receiver Operating Characteristic curve (ROC) and Precision-Recall curve (PR Curve) can be found in Figures 1, 2, 3, and 4.
To evaluate each model, 3 accuracy metrics were chosen: Area under the Receiver Operating Characteristic curve (AUC-ROC), Average Precision (Area under the Precision-Recall curve), and Accuracy. Note that AUC-ROC was used as the accuracy metric for hyper-parameter tuning.
| Algorithm | AUC-ROC | Average Precision | Accuracy |
|---|---|---|---|
| Random Forest | 0.8613 | 0.8694 | 0.8053 |
| Support Vector Machine | 0.8340 | 0.8327 | 0.8118 |
| XGBoost | 0.8706 | 0.8776 | 0.8171 |
| Artificial Neural Network | 0.8590 | 0.8605 | 0.8118 |
5. Discussion
We see that all 4 models achieved scores between 0.8 and 0.9 for the 3 chosen accuracy metrics. The top performing model was based on gradient boosted decision trees (XGBoost) and achieved an AUC-ROC of 0.8706 and average precision of 0.8776.
One point to note is that the 4 models did not differ significantly in terms of achieved scores. As such, one option to improve prediction accuracy would be to incorporate more features/variables from the original dataset to form more complex models.
Furthermore, there was minimal discrepancy between the models’ performance during cross-validation and testing, indicating how over-fitting was avoided.
6. Conclusion
One limitation of the models developed in this paper is that the Korea National Health and Nutrition Examination Survey contains self-reported data. As such, portions of the data used (especially answers to subjective survey questions) may have been erroneous, which would reduce the accuracy of the model.
Nevertheless, the models developed in this paper can be directly applied to Korea’s healthcare system. Regional public health officials could use these models (or variations of these models — depending on data availability) to predict individuals who are likely to not participate in cancer screening programs. Officials could then contact these individuals, informing them of screening locations and dates. Both public and private hospitals could make use of these models as well, depending on the availability of data.
If such a system is implemented, Korea’s National Cancer Screening Program may see a rise in participation.
Further research on this topic with models of greater complexity and additional features may lead to higher prediction accuracy and a rise in overall cancer screening program participation. For instance, varying the total number of features used may lead to more efficient models. The use of complex neural networks with various types of layers may result in models of greater accuracy as well.
References
- [1] Baskaran, V., Guergachi, A., Bali, R.K., & Gorgui-Naguib, R. (2011). Predicting Breast Screening Attendance Using Machine Learning Techniques. IEEE Transactions on Information Technology in Biomedicine, 15, 251-259.
- [2] Hahm MI, Chen HF, Miller T, O’Neill L, Lee HY. Why Do Some People Choose Opportunistic Rather Than Organized Cancer Screening? The Korean National Health and Nutrition Examination Survey (KNHANES) 2010-2012. Cancer Res Treat. 2017;49(3):727-738. doi:10.4143/crt.2016.243
- [3] Kim, D. (2020). Factors involved in Cancer Screening Participation: Multilevel Mediation Model. arXiv preprint arXiv:2008.01600.
- [4] Nelson, A., Herron, D., Rees, G., & Nachev, P. (2019). Predicting scheduled hospital attendance with artificial intelligence. NPJ digital medicine, 2, 26. https://doi.org/10.1038/s41746-019-0103-3
- [5] Seventh Korea Center for Disease Control and Prevention (2016-2018). National Health and Nutrition Examination Survey. Retrieved from http://www.cdc.go.kr/
- [6] Shin, J.-Y., & Lee, D.-H. (2012). Factors Associated with the Use of Gastric Cancer Screening Services in Korea: The Fourth Korea National Health and Nutrition Examination Survey 2008 (KNHANES IV). Asian Pacific Journal of Cancer Prevention, 13(8), 3773–3779. https://doi.org/10.7314/apjcp.2012.13.8.3773
- [7] 국가 암검진 비용 지원. (n.d.). 정부24. https://www.gov.kr/portal/service/serviceInfo/386000000289
- [8] 국민건강보험공단. (2019). 국가 암 조기검진사업 수검률 [Graph and Table]. Retrieved from http://www.index.go.kr/
- [9] 통계청. (2019). 사망원인별 사망률 추이 [Graph and Table] . Retrieved from https://www.index.go.kr/