Linearly controlled arrangement of 13C isotopes in single-wall carbon nanotubes
Abstract
The growth of single wall carbon nanotubes (SWCNT) inside host SWCNTs remains a compelling alternative to the conventional catalyst induced growth processes. It not only provides a catalyst free process but the ability to control the constituents of the inner tube if appropriate starting molecules are used. We report herein the growth of inner SWCNTs from 13C labeled toluene and natural carbon C60. The latter molecule is essentially a stopper which acts to retain the smaller toluene. The Raman spectrum of the inner nanotubes is anomalous as it contains a highly isotope shifted ”tail”, which cannot be explained by assuming a homogeneous distribution of the isotopes. Semi-empirical calculations of the Raman modes indicate that this unsual effect is explicable if small clusters of 13C are assumed. This indicates the absence of carbon diffusion during the inner tube growth. When combined with appropriate molecular recognition, this may enable a molecular engineering of the atomic and isotope composition of the inner tubes.
I Introduction
The growth of carbon nanotubes from carbonaceous materials, which are encapsulated inside host SWCNTs, remains a compelling catalyst free synthesis method of SWCNTs. While the growth was originally discovered from encapsulated fullerenes (peapods) SmithNAT under intensive electron beam irradiation and heating LuzziCPL2000 , it was later shown that the inner tube can proceed from virtually any carbon containing materials SimonCPL2006 including small solvent molecules such as e.g. benzene or toluene, azafullerenes SimonCAR2006 , or coronene KamarasSmall . This synthesis method of SWCNTs have the advantage of allowing a diameter control depending on the diameter of the outer tube and that a catalyst free synthesis is performed, which leads to ultra clean inner tubes PfeifferPRL2003 . Natural disadvantages of the inner tube growth are the hindered ability to remove the inner tubes from the inside in a non-invasive manner, and the lack of control over the possible inner-outer tube chirality pairs, whose presence complicates the Raman analysis PfeifferPRB2005b .
A possible next step to explore the inner tube synthesis from various carbon sources is the combination of several starting components, e.g. the combination of co-encapsulated fullerenes and small organic molecules, which could be used e.g. for the growth of heteroatom containing inner tubes or for their isotope labeling. In principle, the various carbon source molecules would encapsulate in a random fashion. However if some sort of a molecular recognition was present, it would be a possibility to control the arrangement of the various components. In addition, it is also required that little carbon atom diffusion takes place during the inner tube growth in order to fully exploit the molecular recognition. It was reported previously ZolyomiPRB2007 that the carbon diffusion is limited along the inner tube axis: fullerenes of natural carbon and 13C were co-encapsulated and a Raman analysis of the inner tube modes showed a larger than expected inhomogeneity of the 13C isotopes on the resulting inner tubes. A logical continuation of this effort is to co-encapsulate a 13C isotope labeled small organic molecule (benzene or toluene) with fullerenes inside SWCNTs and to study the vibrational modes of the resulting inner tubes.
We report the synthesis and Raman characterization of single-wall carbon nanotubes which are grown inside host nanotubes from fullerenes and other small organic molecules, benzene and toluene. When the latter molecules are 13C isotope labeled, unexpected changes in the Raman spectra are observed: rather than downshifting in a uniform manner (which is expected for homogeneous doping), a tail develops on the small Raman shift side of the Raman modes. This indicates a clustering of the 13C isotopes. This is supported by first principles calculations, where similar features can only be reproduced when a significant clustering of the isotopes is present. This effect is probably related to the clustered nature of the 13C isotopes on the organic rings and it suggests that no carbon diffusion takes place during the inner tube growth.
II Experimental
The starting SWCNT sample was obtained by the arc-discharge method and it was identical to samples as in previous studies SimonCPL2006 with a mean diameter of and a Gaussian distribution varuiance of 0.1 nm. This diameter is suitable for the growth of inner tubes as it can optimally contain the filled in fullerenes. Annealing in air of the SWCNT sample for at opens the nanotubes. Commercial fullerenes (Hoechst, Super Gold Grade , purity ) were used along with and natural (Sigma) and enriched benzene and toluene (Eurisotop, France). We note that for toluene, only the benzyl ring was enriched while the methyl group was of natural carbon. Co-encapsulation of the fullerenes and the benzene or toluene proceeds by sonicating the SWCNTs for 2 hours in the corresponding solvent: solution of . This method is known to result in a clathrate structure where the smaller benzene or toluene molecules occupy half-half of the available inner volume in an alternating fashion SimonCPL2006 ; ZolyomiJPCC2014 . The resulting material was filtered to obtain nanotube bucky-papers and it was rinsed with the corresponding non-enriched solvent (benzene or toluene) to remove any non-encapsulated excess fullerenes from the outside of the nanotubes. This step was followed by the final filtering and drying of the bucky-paper samples under a fume hood. The samples were annealed in dynamic vacuum at for 1 hour. This process is known to yield high quality double-wall carbon nanotubes SimonPRB2005 ; SimonCPL2006 . In the following, we denote double-wall carbon nanotubes grown from and toluene both containing natural carbon as . denotes double wall carbon nanotubes where the inner wall is made of co-encapsulated and 13C benzene and ring-enriched toluene.
Raman spectroscopy was performed with a Dilor xy triple monochromator spectrometer with an excitation lines of an Ar-Kr gas discharge laser. We report data with the line of the Ar ion only; the energetic 2D Raman line of the inner tubes is in resonance with this excitation Pfeiffer2005PRB i.e. its observation is most convenient.
III Raman spectroscopy results
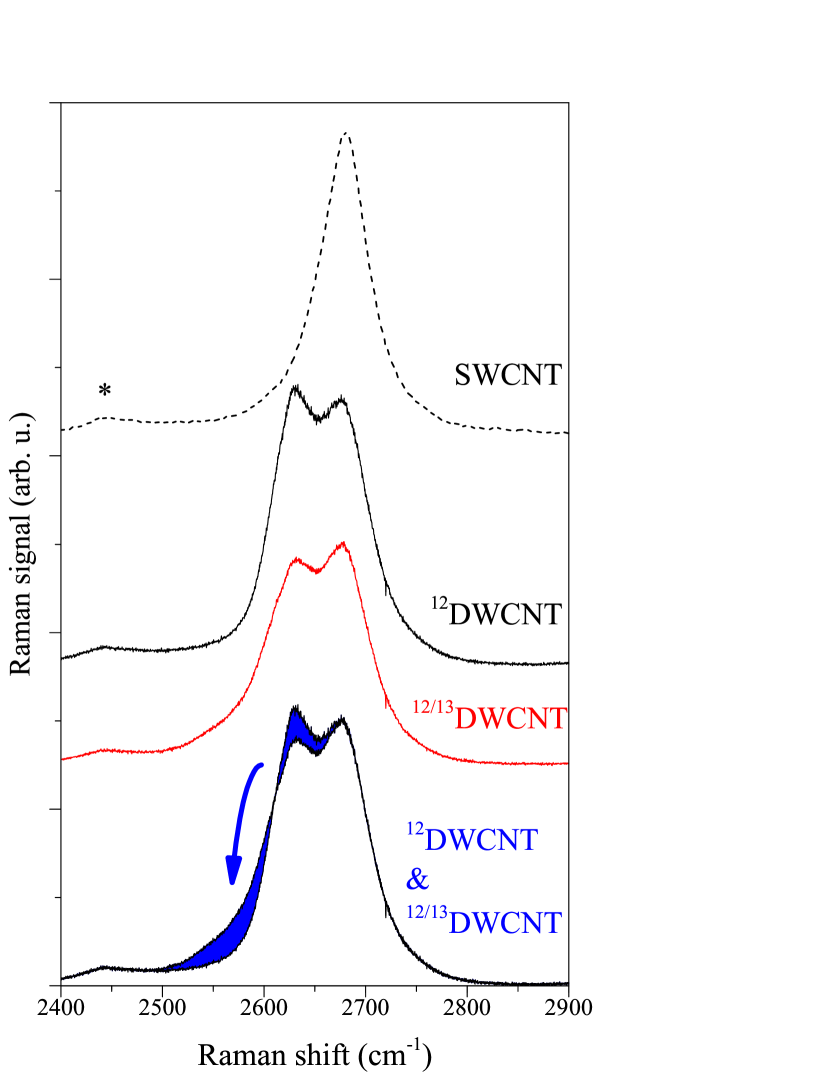
We show the Raman spectra of reference SWCNT, 12DWCNT and 12/13DWCNT samples around the 2D Raman line spectral range. The latter sample was based on a mixture of ring-labelled 13C6H6-CH and natural carbon toluene with a ratio of 84:16. This means that the nominal 13C carbon content in the toluene was 72 %. The DWCNT samples are characterized by the emergence of the lower frequency 2D Raman line which corresponds to the inner tubes Pfeiffer2005PRB . In fact, the inner tube 2D Raman line is twice as strong as the present one for C60 based inner tubes. This is explained by the fact that toluene and benzene are relatively large compared to their nominal carbon content as compared to the fullerenes SimonCPL2006 . It means that they use a significant amount of the available volume while contributing to less carbon atoms to the inner tube growth.
The Raman spectra of 12DWCNT and 12/13DWCNT shows a striking difference which is clearest from the bottommost comparison in Fig. 1 (indicated by a blue arrow in the figure): a sizeable amount of spectral weight is shifted from around the peak of the inner tube 2D Raman line toward lower Raman shifts which forms a ”tail”. This is a surprising observation as a homogeneous downshift of the Raman line is expected from a naive consideration of isotope labeling, rather than the formation of a low Raman frequency ”tail”. Previously, the growth of inner tubes was investigated from 13C enriched fullerenes and therein a uniform downshift was observed with a mean downshift corresponding to the formula SimonPRL2005 ; ZolyomiPRB2007 :
| (1) |
where and are the Raman shifts with and without doping, is the molar mass of natural carbon and it reflects the abundance of in natural carbon and is the concentration. We note that previously a similar, anomalous development of a low Raman frequency tail was observed in isotope labeled benzene based inner tubes in Ref. KoltaiJPCC2016 .
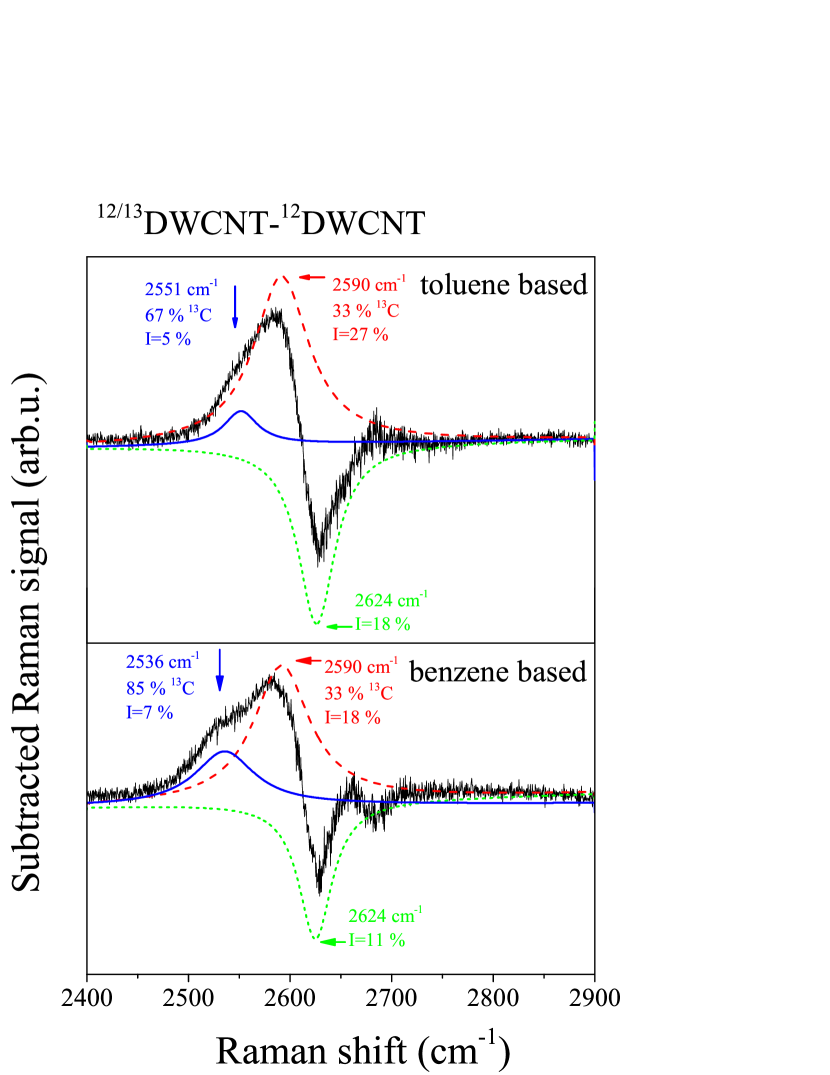
We show in Fig. 2. the spectrum obtained after subtracting the 2D Raman line of the sample from the . We also show for comparison the same kind of data on 13C labeled benzene based DWCNTs from Ref. KoltaiJPCC2016 . The deconvolution of the subtracted spectrum into Lorentzian components reveal three components: a significantly downshifted, low intensity line, a moderately downshifted stronger signal, and a line at the position of the unenriched inner tubes with a negative intensity. The latter corresponds to the spectral weight which is missing in the subtracted spectrum, i.e. it is the spectral weight which is downshifted for the isotope labeled sample in agreement with Fig. 1. The significantly downshifted component corresponds to a 13C isotope enrichment of . This is smaller than the enrichment found for the same line in the benzene based DWCNT in Ref. KoltaiJPCC2016 which may be due to the lower () 13C isotope enrichment of carbon of toluene as compared to in benzene. An interesting observation is that the other downshifted Raman line is found at the same position for both kinds of samples.
It is tempting to associate the significantly downshifted Raman line to a localized cluster or island of 13C isotopes, which assumption is studied further below. The analysis of the Raman intensity shows for both kinds of samples that no Raman spectral weight conservation applies.
IV Theoretical modelling and discussion
We calculated the first order Raman spectrum with the semi-empirical PM3 method as implemented in the Gaussian09 package g09 . We neglected the outer tube and the inner tube was considered as a molecule: a hydrogen-terminated piece of (5,5) armchair type SWCNT consisting of 600 carbon and 20 hydrogen atoms. The structure was first relaxed with the opt=tight option, then we obtained the force constants and the polarizability derivatives. We compared the Raman spectra of various small molecules (methane, benzene, fullerene) calculated with the PM3 method to the first principles based (DFT/B3LYP) results. In general, the frequencies obtained by the semi-empirical method are not very accurate, which could be fixed by rescaling the force constants to fit the experimental (or first principles) value, but we do not bother the absolute position of the calculated Raman peaks, because we always used the same force constant matrix and only changed the masses in the dynamical matrix according to the isotope distribution. However, the Raman intensities calculated with the PM3 method reproduced the results of the more demanding DFT/B3LYP method very well. Using the freqchk utility of Gaussian09 g09 for different distribution of isotope masses the Raman intensities were then evaluated for 2000 random configurations. Two kinds of isotope distribution were considered i) the homogeneous distribution where 60 carbon atoms were selected and replaced individually, and ii) ring arrangement where 10 complete rings of 6 carbon atoms were substituted by isotopes – both resulting in a nominal isotope enrichment.
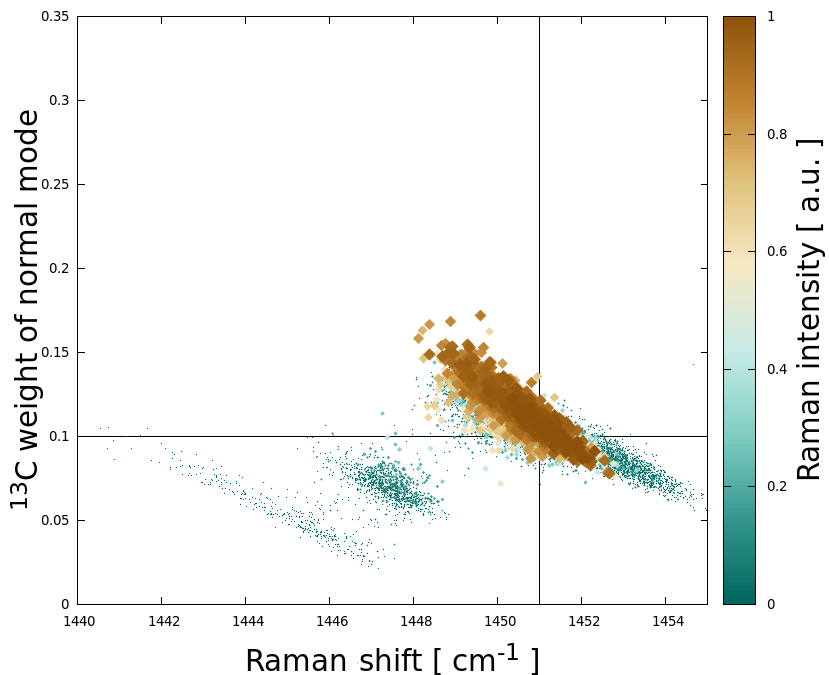
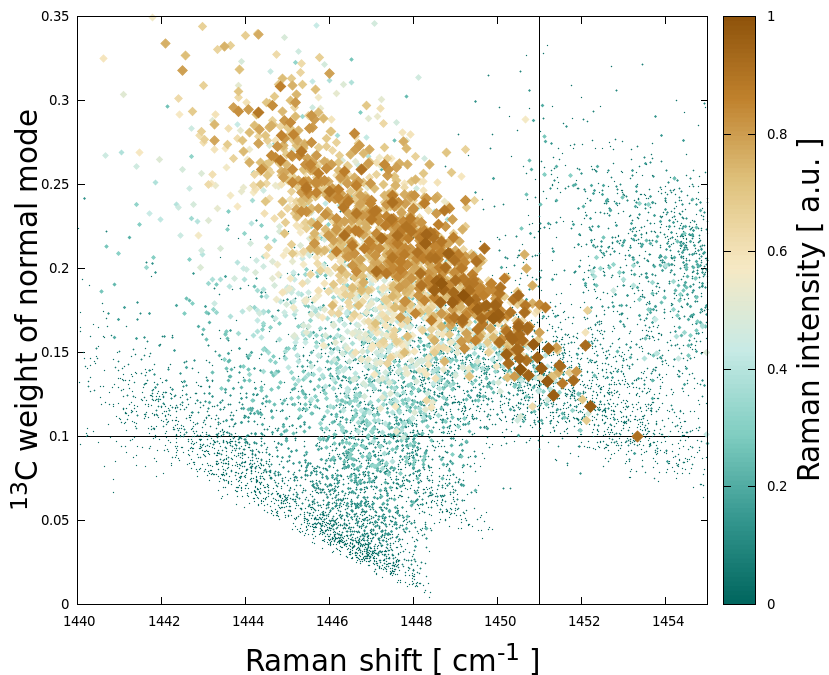
In Figs. 3 and 4 the data of each vibrational mode of every configurations are presented in the G band region for the homogeneous and the clustered distribution, respectively. The colors (and sizes) of symbols correspond to the Raman intensity, the -axis is the usual Raman shift and the -axis is the weight of the substituted carbon atoms movements of the vibration mode. The overall left-top right-bottom trend confirms the naive expectation, that the more dominant the motion of atoms in a normal mode are, the more significant its redshift is. The horizontal solid (black) line marks the position of the isotope-shifted G peak according to Eq. 1 with . In the homogeneous case the shift can be well described with this simple formula, while in the clustered arrangement the shift is clearly larger and could be fitted with an effective enrichment of . The vertical solid (black) line indicates the weight of the 13C substituted carbon atoms () in the normal modes regarding the nominal enrichment. For homogeneous distribution of the isotopes the center of the peaks lies very precisely on this line – to no surprise. However, for the ring configurations there is a convincing deviation from the simple value. This is telling us, that if the 13 substituted carbon atoms are clustered (e.g. in a ring), their presence can give more weight to the normal mode and also to the Raman intensity of the specific normal mode. Therefore they give more weight to the averaged Raman spectrum KoltaiJPCC2016 . This effect might lie behind the anomalous development of a low Raman frequency. It is also worth to note, that this is specific for the G mode, we did not find a similar behavior for the Radial Breathing Mode.
Our theoretical finding supports the experimental observation, that upon clusterization the downshift of the Raman peaks can be higher than the real substitution ratio. However, we did not find as significant downshifts as measured. This might be due to the specific character of the 2D Raman line ThomsenPRL2000 . A similar analysis for the 2D Raman line would be computationally extremely demanding, since there is an additional integration over k-space for the 2D Raman line.
V Conclusions
In conclusion, we presented the synthesis and Raman characterization of carbon nanotubes grown from 13C isotope labeled organic solvent (benzene and toluene) inside host outer tubes. Raman spectroscopy analysis indicates that the 13C isotopes are non uniformly distributed on the inner tube walls. This indicates that little or no carbon diffusion takes places during the inner tube growth. The analysis is supported by semi-empirical calculations of the vibrational modes for clustered 13C isotope rich configurations. The material with 13C isotope rich clusters may find application as local nuclear spin labels or in quantum information storage.
VI Acknowledgement
The Hungarian National Research, Development and Innovation Office (NKFIH) Grants Nr. K108676, K115608, and K119442 are acknowledged for support.
References
- (1) B. W. Smith, M. Monthioux, and D. E. Luzzi, Nature 396, 323–324 (1998).
- (2) B. W. Smith and D. Luzzi, Chem. Phys. Lett. 321, 169–174 (2000).
- (3) F. Simon and H. Kuzmany, Chem. Phys. Lett. 425, 85–88 (2006).
- (4) F. Simon, H. Kuzmany, J. Bernardi, F. Hauke, and A. Hirsch, Carbon 44, 1958–1962 (2006).
- (5) B. Botka, M. E. Fuestoes, H. M. Tohati, K. Nemeth, G. Klupp, Z. Szekrenyes, D. Kocsis, M. Utczas, E. Szekely, T. Vaczi, G. Tarczay, R. Hackl, T. W. Chamberlain, A. N. Khlobystov, and K. Kamaras, SMALL 10(7), 1369–1378 (2014).
- (6) R. Pfeiffer, H. Kuzmany, C. Kramberger, C. Schaman, T. Pichler, H. Kataura, Y. Achiba, J. Kürti, and V. Zólyomi, Phys. Rev. Lett. 90, 225501–1–4 (2003).
- (7) R. Pfeiffer, F. Simon, H. Kuzmany, and V. N. Popov, Phys. Rev. B 72, 161404 –1–4 (2005).
- (8) V. Zólyomi, F. Simon, A. Rusznyák, R. Pfeiffer, H. Peterlik, H. Kuzmany, and J. Kürti, Phys. Rev. B 75, 195419–1–8 (2007).
- (9) V. Zólyomi, H. Peterlik, J. Bernardi, M. Bokor, I. László, J. Koltai, J. Kürti, M. Knupfer, H. Kuzmany, T. Pichler, and F. Simon, J. Phys. Chem. C 118, 30260–30268 (2014).
- (10) F. Simon, A. Kukovecz, C. Kramberger, R. Pfeiffer, F. Hasi, H. Kuzmany, and H. Kataura, Phys. Rev. B 71, 165439–1–5 (2005).
- (11) R. Pfeiffer, H. Kuzmany, F. Simon, S. N. Bokova, and E. Obraztsova, Phys. Rev. B 71, 155409 (2005).
- (12) F. Simon, C. Kramberger, R. Pfeiffer, H. Kuzmany, V. Zólyomi, J. Kürti, P. M. Singer, and H. Alloul, Phys. Rev. Lett. 95, 017401–1–4 (2005).
- (13) J. Koltai, G. Mezei, V. Zólyomi, J. Kürti, H. Kuzmany, T. Pichler, and F. Simon, The Journal of Physical Chemistry C 120(51), 29520–29524 (2016).
- (14) M. J. Frisch, G. W. Trucks, H. B. Schlegel, G. E. Scuseria, M. A. Robb, J. R. Cheeseman, G. Scalmani, V. Barone, B. Mennucci, G. A. Petersson, H. Nakatsuji, M. Caricato, X. Li, H. P. Hratchian, A. F. Izmaylov, J. Bloino, G. Zheng, J. L. Sonnenberg, M. Hada, M. Ehara, K. Toyota, R. Fukuda, J. Hasegawa, M. Ishida, T. Nakajima, Y. Honda, O. Kitao, H. Nakai, T. Vreven, J. A. Montgomery Jr., J. E. Peralta, F. Ogliaro, M. J. Bearpark, J. Heyd, E. N. Brothers, K. N. Kudin, V. N. Staroverov, R. Kobayashi, J. Normand, K. Raghavachari, A. P. Rendell, J. C. Burant, S. S. Iyengar, J. Tomasi, M. Cossi, N. Rega, N. J. Millam, M. Klene, J. E. Knox, J. B. Cross, V. Bakken, C. Adamo, J. Jaramillo, R. Gomperts, R. E. Stratmann, O. Yazyev, A. J. Austin, R. Cammi, C. Pomelli, J. W. Ochterski, R. L. Martin, K. Morokuma, V. G. Zakrzewski, G. A. Voth, P. Salvador, J. J. Dannenberg, S. Dapprich, A. D. Daniels, d. Farkas, J. B. Foresman, J. V. Ortiz, J. Cioslowski, and D. J. Fox, Gaussian 09, Rev B.01, 2009.
- (15) C. Thomsen and S. Reich, Phys. Rev. Lett. 85, 5214–5217 (2000).