Further author information: Send correspondence to C. P.; E-mail: clpoppett@lbl.gov
Performance of the Dark Energy Spectroscopic Instrument (DESI) Fiber System
Abstract
The recently commissioned Dark Energy Spectroscopic Instrument (DESI) will measure the expansion history of the universe using the Baryon Acoustic Oscillation technique. The spectra of 35 million galaxies and quasars over 14000 sq deg will be measured during the life of the experiment. A new prime focus corrector for the KPNO Mayall telescope delivers light to 5000 fiber optic positioners. The fibers in turn feed ten broad-band spectrographs. We describe key aspects and lessons learned from the development, delivery and installation of the fiber system at the Mayall telescope.
keywords:
DESI, fiber system, focal plane, robotic positioners1 INTRODUCTION
The Dark Energy Spectroscopic Instrument (DESI) is a fiber-fed spectroscopic instrument installed on the 4-meter Mayall telescope at Kitt Peak National Observatory (KPNO). During its 5 year survey, DESI will measure the spectroscopic redshift of up to 35 million galaxies and quasars, enabling the completion of the largest 3D map of the universe out to a redshift of 3.5. This unprecedented dataset will be used to measure Baryon Acoustic Oscillations and Redshift Space Distortions leading to a more accurate measurement of the expansion history of the universe and ultimately furthering our understanding of dark energy [1].
The instrument delivers light from the 4-m telescope through a new corrector [2], which provides a 3 degree field of view to the focal plane [3]. The focal plane contains 5,000 optical fibers that are reconfigurable using robotic positioners [4]. These fibers carry the light from the focal plane to ten broad-band spectrographs, sensitive from 360-980nm with a resolution of 2,000-5,000 [5].
The DESI fiber system consists of 5020 custom built positioner fiber assemblies (PFAs) that are installed into 5020 robotic fiber positioners. 5000 of these fibers are used for science and 20 are routed to a sky camera that is used to estimate the exposure times. The 107m core fibers are precision cleaved and then bonded into fused silica ferrules that allow them to be bonded into the positioner. A polyimide tube is bonded into the back of the ferrule to provide strain relief from the positioner as it moves between targets. Finally, an anti-reflection (AR) coating is applied to the front face [6]. The PFA is installed into a positioner and the ferrule is bonded into the ferrule arm after being aligned in focus.
Ten 47.5 m cables run from the focal plane enclosure to spectrograph slits. Each slit consists of 500 fibers in 20 blocks of 25 fibers, where the blocks follow the slit curvature. The cable and slit assembles are connected to the focal plane via fusion splicing. The fusion splice not only facilitates an effective fabrication, integration and testing flow but also allows the system to retain maximum throughput and minimize the focal ratio degradation (FRD). A schematic overview of the DESI fiber system is shown in figure 1.
 |
An international collaboration of institutes worked together with industry to design, produce and test the fiber system. The fiber system was installed at the 4m-Mayall telescope with of fibers intact, fibers with collimated FRD , and throughput delivered from the prime focus corrector to the spectrograph. This high performance is due to many innovations such as precision cleaved front end fibers [6], and fusion splices between the focal plane and spectrograph slit assemblies [7].
In this paper we describe key aspects and lessons learned from the successful development, delivery and installation of the fiber system at the Mayall telescope. This paper will focus on several new topics. In section 2 we discuss the requirements and specifications that drove the testing performed prior to shipping and the performance that was achieved. Section 3 focuses on the installation of the fiber system at the Mayall Telescope as the cables were routed from the focal plane to the spectrograph shack. The final section (4), shows the preliminary performance of the fiber system using on-sky data taken during early commissioning.
2 Fiber system Requirements, Specifications, and Throughput Measurements
As light propagates through an optical fiber, it suffers from fabrication- and stress-induced increases in entropy that manifest as beam attenuation and diffusion of the input entrance angles (modal diffusion). Mechanical fiber stresses can be induced by the fiber termination method, optomechanical bonding method, and other mechanical forces. Broadly speaking, optimizing fiber performance is therefore motivated by controlling the entropy gain in the system by, e.g., minimizing mechanical stresses and/or intentionally scrambling the light path.
The first-order concern when optimizing fiber performance is throughput loss. For an end-to-end system, throughput losses due to the fiber cable can be broken into (1) unavoidable attenuation as the light propagates through the cable (e.g., cladding-mode losses) and (2) losses that occur when attempting to capture the fiber output beam. Fiber manufacturers continue to improve the former with new materials and fabrication techniques. A critical aspect of the latter is the increase in angles from the input to the output beam. This non conservation of étendue is referred to as focal-ratio degradation (FRD) [8].
There are two standard experiments used to characterize fiber FRD: (1) Cone (or solid angle) tests measure the angular diffusion of a fiber by illuminating it with a filled cone of light with constant surface brightness over a specified angle.[9] To better simulate the telescope illumination pattern, scaled obscurations, such as the secondary mirror and support structure, are added to mimic the telescope. Cone tests therefore directly measure how much energy will be enclosed within some -ratio in a fiber, which is the ratio of the focal length to the diameter of the entrance pupil (), for a known input illumination geometry. (2) Ring (or collimated) tests measure FRD by injecting a collimated beam (e.g., from a low-power laser) into the fiber.[10] The fiber azimuthally scrambles the beam to form a ring illumination pattern, recorded by an imaging detector. The diameter of the ring gives a direct measurement of the incidence angle and FRD is measured by the thickness of the ring in the radial direction. Although less direct than the cone test, the ring test is very simple to perform and interpret since there are very few sources of measurement error.
The requirement on the focal ratio degradation (FRD) for the fiber system states that the FRD-induced throughput of the fiber system should be enclosed energy (EE) averaged over all fibers. This requirement must be met within an f/3.57 output beam, illuminated by a uniform f/3.9 (7.3 degree half angle) input beam at a wavelength of 625 nm that includes a scaled Mayall-secondary obstruction (3.46 degree half angle) with a chief ray that is less than 26 arc minutes from the fiber’s optical axis. This requirement is verified through full cone FRD testing as described above. However, since it was impractical to perform a full cone FRD test for every science fiber, it was necessary to find a relationship between full cone FRD and collimated FRD. It was found through testing that at f/in=3.9, a increase in the ring width of a collimated FRD test would result in a 2 loss in throughput to the spectrograph as described in Poppett (2018) [11].
Through multiple tests of splicing fibers with differed FRD performances together we established through that a model that fits the spliced FRD fairly well is given in the following equation:
| (1) |
where is the collimated FRD of the resultant splice, is the collimated FRD of the positioner fiber assembly and is the FRD of the slit and cable.
2.1 FRD Budget
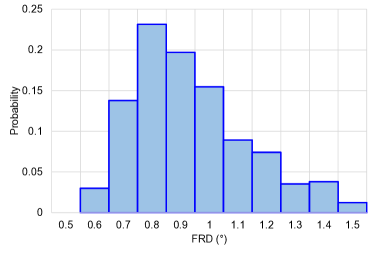
Collimated FRD testing of first 1000 PFAs is shown in figure 2 and allowed us to establish a basline for PFA performance. Any PFA with an FRD greater than 1.5∘ should be rejected. As is shown by this figure, the best fit normal distribution has an average of 0.88∘ and a sigma of 0.18∘, however, the distribution is not normal and has an extended wing with increasing FRD.
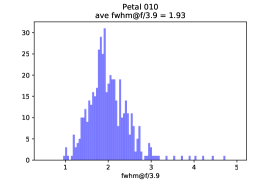
In order to establish the FRD requirements for the fiber cable (fiber in cable with terminated slit) we assumed that the FRD distribution would be a Gaussian. We then ran a Monte Carlo simulation of this Gaussian distribution convolved with the PFA FRD distribution using equation 1 and throughput measurements, obtained from full cone testing during R&D, in order to estimate the distribution of throughputs for the fibers. The FRD mean was varied from 1.2∘ to 2.2∘ and the from 0.2∘ to 0.8∘. The results of a few throughput distributions are plotted in Figure 2.
From this analysis, and since the distribution is not likely to be Gaussian and will have a tail for larger FRDs, it was determined that the fiber cable+slit FRD should have a mean with a in order to meet the FRD budget for the final spliced fiber.

|
2.2 As Delivered Throughput
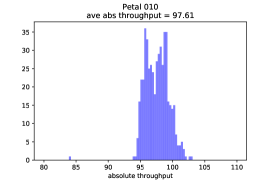
In order to measure the absolute throughput of the full fiber system we combined collimated FRD results with the measured throughput of a calibrated fiber. By comparing the total counts in the FRD image of the spliced fiber with the calibrated fiber it was possible to determine the absolute throughput of the end-to end system. Figure 3 shows the results from the measurements of one petal (1 wedge of the focal plane containing 500 fibers) as an example. All petals met the throughput requirements and the fiber system was delivered with of fibers intact and throughput from the prime focus corrector to the spectrograph.

|
3 Fiber system Installation
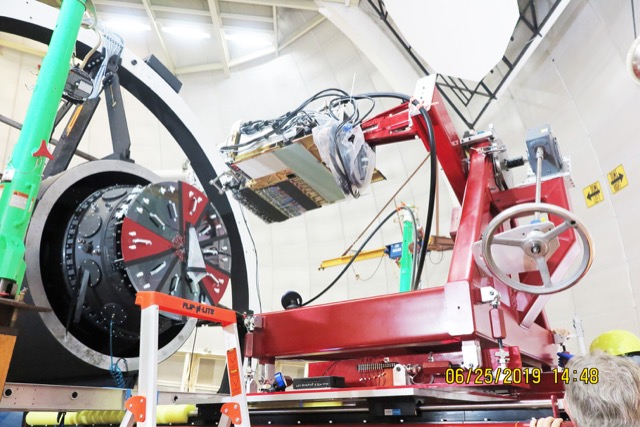
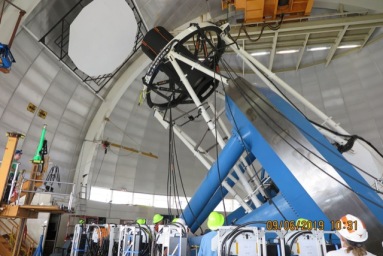
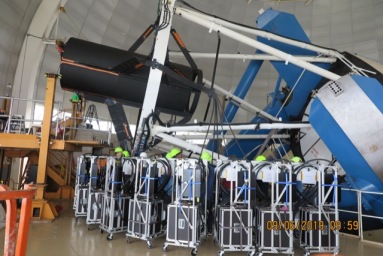
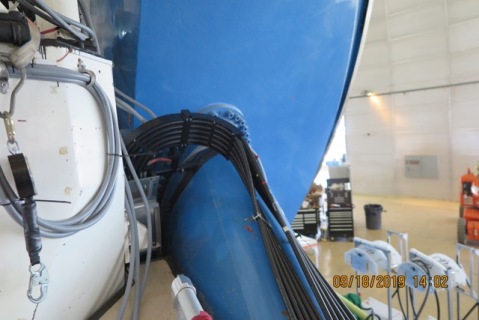
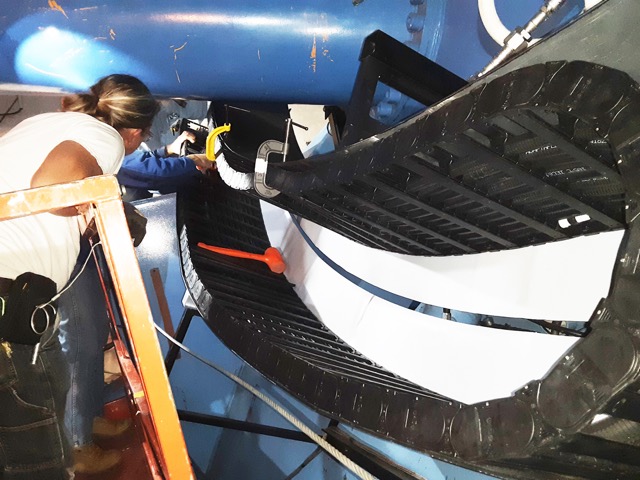
The installation of the fiber system at the Mayall telescope was performed in 2019 in three main stages [12, 13]. The first stage was to install the focal plane system onto the back of the prime focus corrector assembly. In June and July, 2019, the telescope was parked in the southeast annex location in the Mayall telescope dome and the petals were installed using a custom installation system, referred to as the sled, from a platform that enabled the petals to be guided into position. This process is shown in the first two panels of figure 4. The final panel in this figure shows the cable management system, which was designed to route the cables without violating their minimum bend radius of 200 mm whilst retaining the ability to remove any petal without others being affected.
|
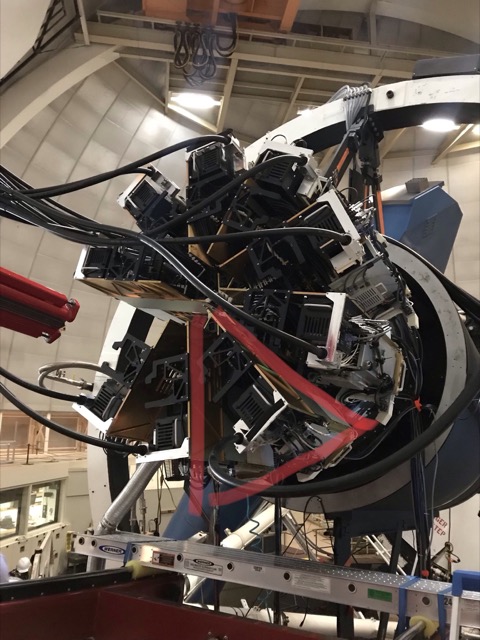
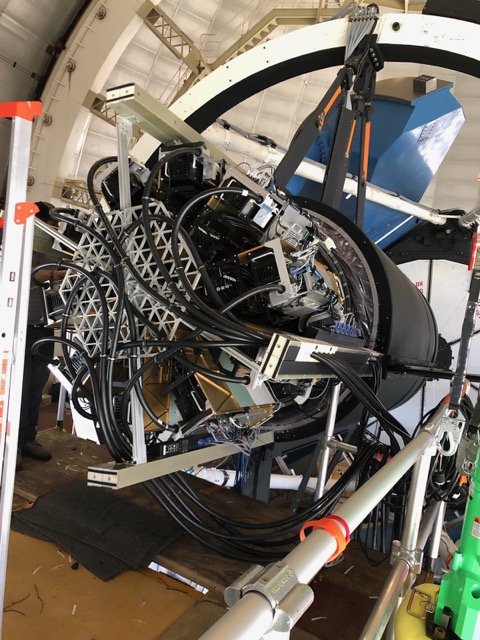
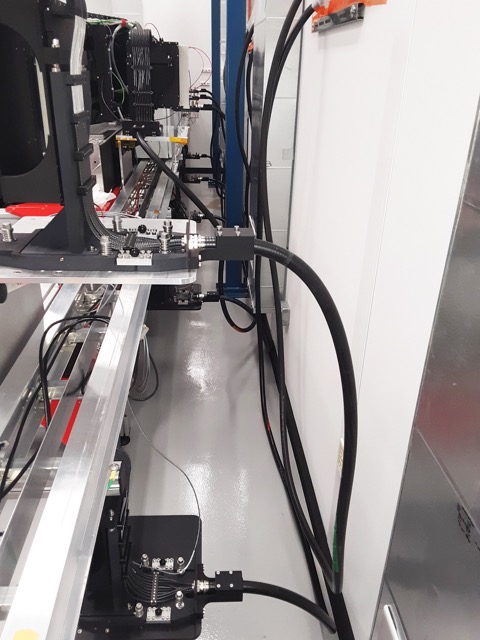
During August and September, 2019, the thermally insulated focal plane enclosure (FPE, from Berkeley Lab) was installed and the fiber cables were routed down the telescope to where the spectrographs are located. The cables and slits were stored on their shipping carts during the focal plane installation and handled by an expert team of NOIRlab engineers (see figure 5).

|
The fiber cables emerge from the FPE and cross to the upper ring, along both the southeast and northeast spider vanes. They are stacked parallel to the optical axis when they cross the spider vanes in order to to minimize obscuration. From the upper ring, the two groups of five cables are constrained by custom hardware designed, built, and installed by NOIRLab. The two sets of cables converge into a single group of ten cables about halfway down the serrurier truss.
The fiber cables then follow an arc-shaped path through the declination and hour axes. They were installed in articulated cable carriers with reversible bend directions to ensure that they do not twist or otherwise violate their minimum bend radius. The bundle of ten cables coming down the telescope truss were loaded into the declination wrap carrier on a bench near the east declination bearing, which was then craned into its custom guides in the gap between the telescope center section and the hour angle “horseshoe” [13].
The bundle of ten cables was strain relieved to the oval tube of the horseshoe, and then the bundle passed into the hour angle cable wrap in one layer, ten cables wide. The fixed end of the hour angle cable wrap was attached to the fixed telescope mount, and from there the cables passed straight through penetrations in the wall of the large coudé room on the main floor to the east of the telescope mount. The cables continue from that wall through penetrations in the DESI spectrograph clean room shack. The penetrations through the walls of the large coudé room and the shack were sized to allow the passage of the slitheads while they were in their protective shipping boxes.
|
4 On Sky Fiber system Performance
On sky fiber system performance was evaluated by measuring the stability of both the bulk throughput and the PSF stability. If the PSF changes from the calibration to the science exposures, this will result in an extraction bias. It was a requirement that the spectroscopic PSF should be characterized for all fibers in each science exposure over the full wavelength range such that the PSF bias did not exceed 1%.
4.1 Fiber Throughput Stability
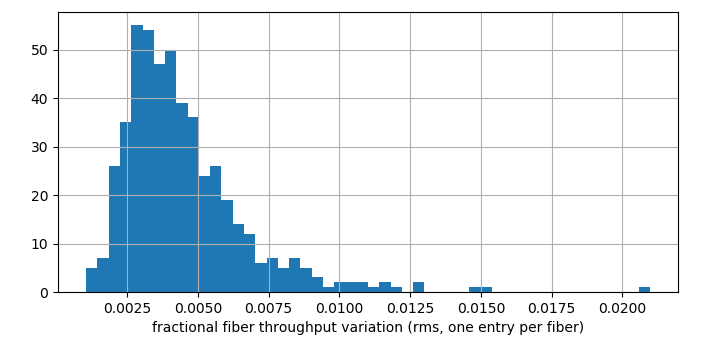
Throughput variations in the fiber system were measured under a variety of conditions. The first test measured throughput variations as the robotic fiber positioners were moved. The measurements were made by moving the telescope from Zenith and pointing instead to the calibration screen in the dome and measuring PSF flux variations in the spectrographs as the positioners moved around their patrol zone. Figure 7 shows that most fibers were found to have a rms flux variation below 1%. Only 3% of fibers have a flux variation that exceeds 1%.
 |
The second test measured the PSF stability under different telescope pointings. This was necessary in order to prove that different bends in the cable did not result in different fiber output distributions. Again, the telescope was pointed to the white spot and then both the dome and telescope were moved through 4 different dome azimuth angles (0, 107, 180, 253 deg). Figure 8 show that the variation in throughput is within 1%, and there is no evidence for an effect of the dome azimuth / telescope pointing on the PSF stability.
 |
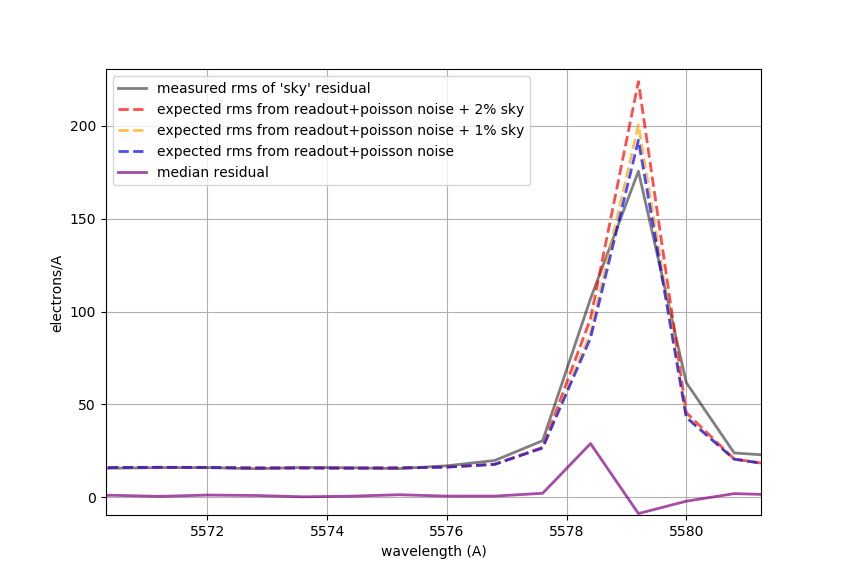
Finally, an analysis of sky residuals was performed on multiple night time exposures taken during early commissioning. When reducing science data, the sky spectrum recorded during each integration is used as the normalization, when considering the residual sky-subtraction error in any given data set [14]. If the PSF is not stable, this error will increase. The results show that the sky residuals RMS on emission lines is CCD noise + 1 % of sky lines. These results are shown in figure 9

|
5 Conclusions
The Dark Energy Spectroscopic Instrument (DESI) is a fiber-fed spectroscopic instrument installed on the 4-meter Mayall telescope at Kitt Peak National Observatory (KPNO). DESI fiber system starts with 5000 custom built positioner fiber assemblies (PFAs) that are installed into 5000 robotic fiber positioners. Ten 47.5 m cables run from the focal plane enclosure to spectrograph slits.
The DESI fiber system was delivered to the 4m-Mayall telescope with of fibers intact and more than throughput delivered from the prime focus corrector to the spectrograph. It was installed on the Mayall telescope at KPNO in 2019. The instrument was commissioned over a 6 month period in 2019/2020 and finished earlier than planned due to the global pandemic of COVID-19. Preliminary analysis from this commissioning data has shown that the PSF stability is 1 % for most fibers. This requirement is met when moving or not the positioners, and as a function of dome azimuth. Finally it has been proven that the PSF stability is sufficient to obtain a sky subtraction precision better than 1%.
Acknowledgements.
This research is supported by the Director, Office of Science, Office of High Energy Physics of the U.S. Department of Energy under Contract No. DE–AC02–05CH1123, and by the National Energy Research Scientific Computing Center, a DOE Office of Science User Facility under the same contract; additional support for DESI is provided by the U.S. National Science Foundation, Division of Astronomical Sciences under Contract No. AST-0950945 to the NSF’s National Optical-Infrared Astronomy Research Laboratory; the Science and Technologies Facilities Council of the United Kingdom; the Gordon and Betty Moore Foundation; the Heising-Simons Foundation; the French Alternative Energies and Atomic Energy Commission (CEA); the National Council of Science and Technology of Mexico; the Ministry of Economy of Spain, and by the DESI Member Institutions. The authors are honored to be permitted to conduct astronomical research on Iolkam Du’ag (Kitt Peak), a mountain with particular significance to the Tohono O’odham Nation.References
- [1] DESI Collaboration, “The DESI Experiment Part I: Science,Targeting, and Survey Design,” arXiv e-prints , arXiv:1611.00036 (Oct. 2016).
- [2] Doel, P., Besuner, R., Brooks, D., Flaugher, B., Gallo, G., Gutierrez, G., Kent, S., Lampton, M., Levi, M., Liang, M., Miller, T., and Sprayberry, D., “The prime focus corrector for dark energy spectroscopic instrument,” in [Ground-based and Airborne Instrumentation for Astronomy VI ], Evans, C. J., Simard, L., and Takami, H., eds., Society of Photo-Optical Instrumentation Engineers (SPIE) Conference Series 9908, 99088D (Aug. 2016).
- [3] Lambert, A. R., Besuner, R. W., Claybaugh, T. M., and Silber, J. H., “DESI focal plate mechanical integration and cooling,” in [Ground-based and Airborne Instrumentation for Astronomy VI ], Evans, C. J., Simard, L., and Takami, H., eds., 9908, 2568 – 2579, International Society for Optics and Photonics, SPIE (2016).
- [4] Schubnell, M., Ameel, J., Besuner, R. W., Gershkovich, I., Hoerler, P., Kneib, J.-P., Heetderks, H. D., Silber, J. H., Tarlé, G., and Weaverdyck, C., “The DESI fiber positioner system,” in [Ground-based and Airborne Instrumentation for Astronomy VI ], Evans, C. J., Simard, L., and Takami, H., eds., 9908, 2715 – 2720, International Society for Optics and Photonics, SPIE (2016).
- [5] Edelstein, J., Jelinsky, P., Levi, M., Tarle, G., and Brooks, D., “The DESI spectrograph system and production,” in [Ground-based and Airborne Instrumentation for Astronomy VII ], Evans, C. J., Simard, L., and Takami, H., eds., 10702, 2255 – 2272, International Society for Optics and Photonics, SPIE (2018).
- [6] Poppett, C., Edelstein, J., Aguilar, J., Jelinsky, S., and McCauley, J., “Design, production, and performance of the DESI front end fiber system,” in [Ground-based and Airborne Instrumentation for Astronomy VII ], Evans, C. J., Simard, L., and Takami, H., eds., Society of Photo-Optical Instrumentation Engineers (SPIE) Conference Series 10702, 107027P (July 2018).
- [7] Fagrelius, P., Poppett, C., and Edelstein, J., “Fusion splicing: a novel approach to fiber connections for the Dark Energy Spectroscopic Instrument,” in [Ground-based and Airborne Instrumentation for Astronomy VI ], Evans, C. J., Simard, L., and Takami, H., eds., 9908, 2268 – 2276, International Society for Optics and Photonics, SPIE (2016).
- [8] Ramsey, L. W., “Focal ratio degradation in optical fibers of astronomical interest.,” in [Fiber Optics in Astronomy ], Barden, S. C., ed., Astronomical Society of the Pacific Conference Series 3, 26–39 (Jan. 1988).
- [9] Belland, B., Gunn, J., Reiley, D., Cohen, J., Kirby, E., Cesar de Oliveira, A., Souza de Oliveira, L., Roberts, M., and Seiffert, M., “Focal Ratio Degradation for Fiber Positioner Operation in Astronomical Spectrographs,” Journal of Astronomical Instrumentation 8, 1950007 (Jan. 2019).
- [10] Finstad, D., Wishnow, E., Poppett, C., Sirk, M., Edelstein, J., Gibson, S., Marcy, G., and Howard, A., “Collimated focal ratio degradation testing for highly multiplexed fiber systems - an improvement to a standard test,” the Optical Society 55, 6829 (Sept. 2016).
- [11] Poppett, C., Sharples, R., Edelstein, J., Schmoll, J., and Bramall, D., “The DESI fiber system,” in [Ground-based and Airborne Instrumentation for Astronomy VII ], Evans, C. J., Simard, L., and Takami, H., eds., 10702, 2345 – 2352, International Society for Optics and Photonics, SPIE (2018).
- [12] Allen, L., Sprayberry, D., Evatt, M., Marshall, R., Abareshi, B., Lavoie, T., Joyce, R., Probst, R., Dey, A., Blum, R., Besuner, R., Jelinsky, P., Silber, J., Claybaugh, T., Poppett, C., Doel, P., Brooks, D., Gutierrez, G., Flaugher, B., Gallo, G., Friend, D., Sharples, R., Bramall, D., Honscheid, K., Martini, P., Derwent, M., and O’Brien, T., “DESI installation: preparations and progress (Conference Presentation),” in [Ground-based and Airborne Telescopes VII ], Marshall, H. K. and Spyromilio, J., eds., 10700, International Society for Optics and Photonics, SPIE (2018).
- [13] Sprayberry, D., Goble, W., Allen, L., Elias, J., Probst, R., Joyce, R., Dey, A., Marshall, R., Evatt, M., Blum, R., Abbott, T. M. C., Walker, A., Muñoz, F., Besuner, R., Sholl, M., Jelinsky, P., Silber, J., Lafever, R., Bebek, C., and Flaugher, B., “Planning the installation of the dark energy spectroscopic instrument on the Mayall Telescope,” in [Ground-based and Airborne Telescopes V ], Stepp, L. M., Gilmozzi, R., and Hall, H. J., eds., 9145, 1421 – 1432, International Society for Optics and Photonics, SPIE (2014).
- [14] Sharp, R. and Parkinson, H., “Sky subtraction at the Poisson limit with fibre-optic multiobject spectroscopy,” Monthly Notices of the Royal Astronomical Society 408, 2495–2510 (10 2010).