VisualMRC: Machine Reading Comprehension on Document Images
Abstract
Recent studies on machine reading comprehension have focused on text-level understanding but have not yet reached the level of human understanding of the visual layout and content of real-world documents. In this study, we introduce a new visual machine reading comprehension dataset, named VisualMRC, wherein given a question and a document image, a machine reads and comprehends texts in the image to answer the question in natural language. Compared with existing visual question answering (VQA) datasets that contain texts in images, VisualMRC focuses more on developing natural language understanding and generation abilities. It contains 30,000+ pairs of a question and an abstractive answer for 10,000+ document images sourced from multiple domains of webpages. We also introduce a new model that extends existing sequence-to-sequence models, pre-trained with large-scale text corpora, to take into account the visual layout and content of documents. Experiments with VisualMRC show that this model outperformed the base sequence-to-sequence models and a state-of-the-art VQA model. However, its performance is still below that of humans on most automatic evaluation metrics. The dataset will facilitate research aimed at connecting vision and language understanding.
Introduction
Creating intelligent agents that can answer questions as well as people can is a long-cherished goal of artificial intelligence. To achieve this goal, machine reading comprehension (MRC), a challenge to enable a machine to read and comprehend natural language texts so that it can answer questions, has received much attention (Rajpurkar et al. 2016; Rajpurkar, Jia, and Liang 2018). The MRC capability can be of value to users if it can be employed by automated assistants such as customer-service chatbots on e-commerce websites (Cui et al. 2017) or assistant systems for reading professional literature (Hong et al. 2019). Here, most real-world documents are provided in non-plain text formats (e.g., HTML and PDF). However, current studies in MRC almost exclusively focus on text-level understanding, while neglecting the visual layout and content (text appearance, tables, charts, etc.) of the documents. Visual question answering (VQA) on images containing a few words (Singh et al. 2019; Biten et al. 2019) has recently been studied as a challenging task that lies at the intersection of vision and language understanding. However, these learning tasks do not focus on document understanding. They cannot be used to develop the ability to make a machine visually read and comprehend real-world documents.

| Q: Who were the winners of the Ig Nobel prize for Biology and Chemistry? |
| A: The winner of the Ig Nobel prize for biology was Dr Johanna van Bronswijk, and the winner for Chemistry was Mayu Yamamoto. |
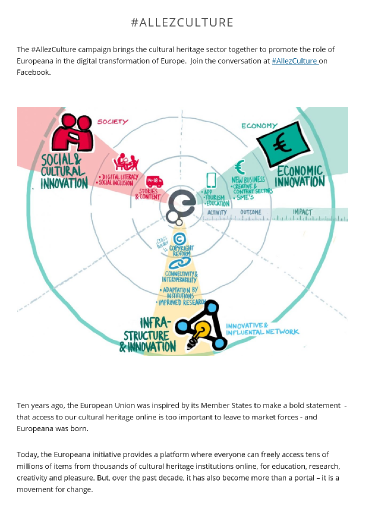
To move towards more advanced vision and language understanding, we have created a new dataset111 We will release further information about this dataset at https://github.com/nttmdlab-nlp/VisualMRC., called Visual Machine Reading Comprehension (VisualMRC), wherein given a question and a document image, a machine reads and comprehends texts in an image to answer the question in natural language. As shown in Figure 1, the task demands a rich set of abilities as varied as understanding the document layout and visual representations of the text and non-text objects and extracting relations between objects, in addition to natural language understanding (NLU) and natural language generation (NLG). Compared with DocVQA (Mathew, Karatzas, and Jawahar 2021), which is a concurrent work of VQA on document images, our dataset differs in that it provides a number of images sourced from various contemporary webpages and it provides long abstractive answers that can be used for evaluating the NLU and NLG abilities on document images.
Our main contributions are as follows.
-
•
We introduce a novel visual machine reading comprehension dataset (VisualMRC) containing QA pairs that require a machine to read and reason about texts in the document image. Our dataset is currently the only one dataset that focuses on generative QA on document images.
-
•
We propose a new model that allows for transferring the NLU and NLG abilities of sequence-to-sequence models, pre-trained on text corpora, to the VisualMRC task.
- •
Existing Vision and Language QA Datasets
VQA on images containing a few words.
VQA, in which a document in MRC takes the form of an image, has been studied intensively (Antol et al. 2015; Goyal et al. 2017). Recently, a number of VQA datasets with text in images, annotated using optical character recognition (OCR), have been released. The focus of most text-based VQA datasets is to reason and answer questions about text in natural daily scenes. VizWiz-VQA (Gurari et al. 2018) consists of questions originating from blind people who each took a picture using a mobile phone. TextVQA (Singh et al. 2019), ST-VQA (Biten et al. 2019), and EST-VQA (Wang et al. 2020) are crowd-sourced datasets on everyday scenes. Moreover, some datasets focus on different types of images. For instance, OCR-VQA (Mishra et al. 2019) is a dataset containing images of book covers; FigureQA (Kahou et al. 2018) and DVQA (Kafle et al. 2018) are datasets containing diagrams and charts. What is most different about our dataset in comparison with the ones mentioned above is that its images contain more words. Our work is focused more on developing the NLU ability on documents in which multiple pieces of text and visual content are laid out.
VQA on document images.
Similarly to VisualMRC, DocVQA (Mathew, Karatzas, and Jawahar 2021) has proposed a dataset for VQA that requires reading and reasoning about document images. However, there are important differences in design choices, as follows: (i) VisualMRC contains a number of different images sourced from multiple domains, while the images of DocVQA are from a single source, the UCSF Industry Documents Library. (ii) VisualMRC consists of contemporary born-digital webpages, while most of the documents in DocVQA are from the 1960–2000 period, containing handwritten or typewritten words. (iii) The images of VisualMRC contain a minimum of three natural language sentences, while there is no guarantee that natural language sentences are included in the images of DocVQA. (iv) VisualMRC provides long abstractive answers, while DocVQA provides SQuAD-like extractive and short answers from a single span of the text in the document image.
Multi-modal question answering.
Multi-modal question answering takes both textual and visual information as input contexts, which is different from text-based VQA that takes only an image as the input context. TQA (Kembhavi et al. 2017) is comprised of middle-school science lessons containing diagrams and text. RecipeQA (Yagcioglu et al. 2018) provides cooking recipes with images and text. The motivation behind these studies is similar to ours, but the visual information in the text such as the document layout is dropped from the text in these datasets. The focus of our research is to enable machines to handle the same visual input as humans do when they read real-world documents.
Moreover, some of these datasets are in the setting of multiple-choice QA that allows for accurate evaluation. However, in terms of application scenarios, it is highly cost to collect answer candidates to answer open-domain questions. For this reason, we believe that generative settings are important, even if they are difficult to evaluate.
The VisualMRC Task and Dataset
We first define the VisualMRC task and then describe the data collection concerning the task’s input and output.
Task Overview
We present VisualMRC, a new vision and language task to read and comprehend texts given as a document image.
First, the end-to-end task is simply defined as:
Task 1 (End-to-end VisualMRC).
Given a question and a document image , a model generates an answer .
The VisualMRC task is a generative MRC task such as NarrativeQA (Kociský et al. 2018), in which the answer is not limited to word spans in the context. The understanding of the image can be decomposed into two sub-tasks:
Subtask 1 (Region-Of-Interest (ROI) detection).
Given an image , a model detects a set of ROIs. Each ROI consists of a bounding box and a semantic class label .
Subtask 2 (OCR).
Given a ROI , a model detects a set of word objects within the region. Each word object consists of a bounding box and a form .
Dataset Collection
We describe how we collected images, ROIs, OCR words, and question-answer pairs. Our dataset provides ground-truth ROIs annotated by humans and OCR words for each ROI as the outputs of Subtasks 1 and 2. It also provides relevant ROIs that are required to answer each question.
Document image collection.
First, we collected 5,599 full screenshots of webpages in 35 domains licensed under creative commons from January to March 2020. Then, we asked 94 crowdworkers to determine if each page included any content that is usable for creating QA pairs and to annotate the content (as a document image ) with a bounding box. They were allowed to annotate multiple pieces of content in a screenshot but were not allowed to overlap the bounding boxes. Finally, seven crowdworkers validated the annotated content. In total, 10,197 images were collected. We defined content that is suitable as a document image as follows. (i) No handwritten text is allowed: only machine-printed text. (ii) The content is preferred to contain both pictures and texts, but this is not strictly required. (iii) The content must contain a minimum of three natural language sentences, preferably no more than 2-3 paragraphs. (iv) The content has to contain information at least two of the classes described in the next subsection.
Ground-truth ROI annotation.
45 crowdworkers were asked to indicate specific objects (ROI in Subtask 1) in the given image by annotating bounding boxes around the objects and classifying them into nine classes . Figure 2 shows a screenshot showing crowdworkers’ ROI annotation by selecting a class among the nine classes for each ROI.
We defined the nine ROI classes as follows.
-
•
Heading/Title The title or caption of a page, chapter, etc.
-
•
Subtitle/Byline The secondary or subordinate title of a page or a line of text giving the author’s name.
-
•
Paragraph/Body The main text that would be read.
-
•
Picture The picture or image that contains no text or data.
-
•
Caption The text placed next an image, data, etc. that provides or explains information about an image or data.
-
•
List Typically bulleted lists, where each bullet is not a full sentence.
-
•
Data Tables, charts, graphs, infographic, or other figures with data or information.
-
•
Sub-data The text placed inside of the Data region.
-
•
Other Any other text that does not fit in the other categories.

OCR execution.
We extracted words (bounding box and form in Subtask 2) from each ROI except the data regions (because we have sub-data regions for texts in a data region) by using the Tesseract OCR system (Smith 2007).
QA pair collection.
495 crowdworkers created three unique questions , and their generative answers for each image , where questions should ask about the written content and there should be only one answer to each question.
Relevant ROI annotation.
The crowdworker that created a question-answer pair also chose the relevant ROIs (required to answer the question) among the ground-truth ROIs. 79 crowdworkers validated the created data.
Data split.
We split the dataset into training, development, and test sets, in terms of URL domain; the datasets contain 21,015, 2,839, and 6,708 questions, respectively.


Statistics and Analysis
We compared our dataset with the two representative VQA datasets with text in images: TextVQA and DocVQA.
| TextVQA | DocVQA | VisualMRC | ||||||
|---|---|---|---|---|---|---|---|---|
| Image type |
|
|
|
|||||
| Num. images | 28,472 | 12,767 | 10,197 | |||||
| Num. questions | 45,536 | 50,000 | 30,562 | |||||
| Uniq. num. questions | 36,593 | 36,170 | 29,419 | |||||
| Perc. uniq. answers | 51.74 | 64.29 | 91.82 | |||||
| Avg. len. questions | 8.12 | 9.49 | 10.55 | |||||
| Avg. len. documents | 12.17 | 182.75 | 151.46 | |||||
| Avg. len. answers | 1.51 | 2.43 | 9.53 |
Questions.
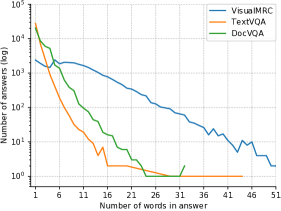
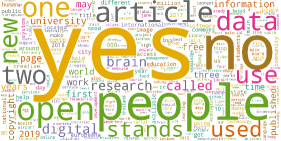
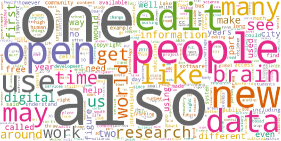
Table 1 shows that the percentage of unique questions in VisualMRC (96.3%) is higher than in TextVQA (80.7%) or DocVQA (72.3%). The average question length in VisualMRC is 10.55 tokens, larger than in TextVQA (8.12) or DocVQA (9.49). Figure 3a shows that the distribution of question lengths is more long-tailed than in TextVQA and DocVQA. Figure 3d shows a word cloud that presents the question space is diverse. Figure 4 shows the first three words of the questions. Compared with TextVQA and DocVQA, we can see that a variety of questions are included in the VisualMRC dataset. Questions often start with “what” (42.0%) and “what is the” (9.5%), while their percentages are significantly lower than those in TextVQA (78.2% and 22.9%) and DocVQA (68.1% and 58.2%). Yes/no questions (starting with ”is” (4.7%), ”are” (2.0%), ”can” (1.8%), ”do” (1.1%), etc.) are also included in the dataset.

Answers.
Table 1 shows that the percentage of questions having unique answers in VisualMRC (91.82%) is significantly higher than those of TextVQA (51.74%) and DocVQA (64.29%). The average answer length in VisualMRC is 9.53 tokens, significantly larger than in TextVQA (1.51) and DocVQA (2.43). Also, answers begin with “yes” in 10.04% and “no” in 2.67% of the whole answers. These percentages are higher than those in TextVQA (4.90% and 0.97%) and DocVQA (0.12% and 0.15%).
Document images.
The average number of OCR words in an image of VisualMRC (151.46) and DocVQA (182.75) is significantly larger than TextVQA (12.17). We also analyzed topics of the documents by using Latent Dirichlet Allocation (LDA) (Blei, Ng, and Jordan 2003), and found that VisualMRC covers a broad range of topics, science, travel, software, health, education, news, government, etc. (see Table 2), while most of the documents in DocVQA relate to food and nutrition (Mathew, Karatzas, and Jawahar 2021).
| # | topic words |
|---|---|
| 1 | brain cells figure people different like called body see children |
| 2 | city understand many area south north world island east park |
| 3 | get bus around road airport city station add listing train take |
| 4 | use software copyright free information content work may |
| 5 | water figure species bacteria plants food called different fish |
| 6 | first university music film years london wikipedia history new |
| 7 | like new people world technology make even time future way |
| 8 | health humanitarian disease medical medicine cancer research |
| 9 | open data digital research community education cc europeana |
| 10 | government people said thailand corruption countries country |

Moreover, unlike DocVQA and TextVQA, VisualMRC provides ROI annotations in images. Figure 5 shows the number of ROIs broken down into the nine semantic classes. The paragraphs and titles tend to be related to the question. Also, 44.8% of the document images contain picture regions and/or data regions such as tables and charts.

Proposed Model
Our model consists of sub-modules for the ROI detection and OCR (Subtasks 1 and 2) and a main module for visual machine reading comprehension. In this section, we first explain the main module and then the sub-modules.
Our main module has a Transformer (Vaswani et al. 2017) architecture (see Figure 6). Following the success of recent pre-trained encoder-decoder models such as BART (Lewis et al. 2020) and T5 (Raffel et al. 2020) in NLG tasks, we extended the models by learning the visual layout and content of the documents in a way that does not cause the forgetting of the pre-trained NLG ability.
The main module maps an input sequence to a sequence of embeddings, which is passed to the encoder. We extended the formalization of the input sequence and embeddings. We also conducted saliency detection to find the tokens relevant to the question.
Input Sequence
The input sequence is formed from the tokenization results of the concatenation of a question and OCR words in ROIs, which are the outputs of the Subtasks 1 and 2. To consider the semantic roles of ROIs, we insert a special token [L] corresponding to the semantic class label of the -th ROI (such as [P/B]; see Figure 6) just before the sequence of OCR tokens in :
where [S] is a ’question:’ (<s>), and [SEP] is a ’context:’ (</s>) in the case we use T5 (BART) as the base model.
Input Embeddings
The input embeddings of the ROI and OCR tokens, which are passed to the encoder, consist of a segment , a location within the image , and an appearance in addition to a token and a position within the input sequence . In total, the fused embedding at the -th position in the sequence, , is given as:
where LN() is a layer normalization (Ba, Kiros, and Hinton 2016). Note that the of T5 is set to a zero vector since T5 uses relative position embeddings in self-attention (Shaw, Uszkoreit, and Vaswani 2018) instead of the absolute position embeddings. Also note that the segment, location, and appearance embeddings are not used by the decoder, and those of the special tokens [S] and [SEP] and question tokens for the encoder are set to zero vectors.
We explain the three additional embeddings below.
Segment embeddings.
To convey the semantics of the document structure to the model more explicitly, we introduce a learnable segment embedding vector for each ROI class, indicating which ROI the -th token in the input sequence comes from.
Location embeddings.
We introduce a location embedding that denotes the relative location of the -th token (corresponding to a ROI or an OCR token) within the input image. We use a 4-dimensional location feature based on the token’s relative bounding box coordinates:
where and are the coordinates of the top-left and bottom-right corners of the -th token’s bounding box, and and are the image width and height, respectively (see Figure 6). is passed to a 1-layer FFN to obtain the locations embedding .
Appearance embeddings.
To consider the appearance of the ROIs and OCR tokens, we incorporate their visual features into the input embeddings. The image corresponding to the bounding box of the -th token is fed into a Faster R-CNN (Ren et al. 2015) to obtain 2048-dimensional fc7 appearance features, . Then, the ReLU activation of the feature is passed to a 1-layer FNN to obtain the appearance embedding .
Saliency Detection
To find the tokens relevant to the question, we calculate the relevance of each token with the outputs of the encoder,
where is the encoder hidden state in the last layer corresponding to (the -th OCR token in the -th ROI). , are learnable weights.
Saliency loss.
We introduce a saliency loss to better supervise the determination of which tokens are required to answer the question. However, a reference label for each token is not given. To deal with this problem, we make pseudo reference labels by aligning the OCR tokens and answers. The reference label is set to 1 if the following two conditions are met: (i) an OCR token exists in the answer, and (ii) an OCR token belongs to the relevant ROIs; otherwise, it is set to 0. The saliency loss is defined as:
Multi-task learning.
Our main module is trained by minimizing the weighted sum of the two losses:
, where is a hyper-parameter to balance the losses, and
is the negative log-likelihood loss in the sequence-to-sequence learning.
Sub-modules for ROI detection and OCR
Using a different Faster R-CNN than the one for appearance embedding, up to 100 detected objects with the highest score are selected for each document image. This sub-module is trained independently of the main module. Also, a built-in OCR system such as Tesseract (Smith 2007) without any fine-tuning is used to extract OCR words from each ROI.
Experiments
| Model | OCR | Q | V | BLEU-1 | BLEU-2 | BLEU-3 | BLEU-4 | METEOR | ROUGE-L | CIDEr | BERTscore |
|---|---|---|---|---|---|---|---|---|---|---|---|
| M4C-Q | ✓ | 20.2 | 13.0 | 8.9 | 6.1 | 9.8 | 20.9 | 58.3 | 85.1 | ||
| M4C-Visual | ✓ | ✓ | 20.7 | 13.3 | 9.2 | 6.3 | 10.1 | 21.8 | 61.0 | 85.3 | |
| M4C-Text | ✓ | ✓ | 26.7 | 17.4 | 11.8 | 8.8 | 11.6 | 26.9 | 88.3 | 85.9 | |
| M4C | ✓ | ✓ | ✓ | 29.2 | 20.1 | 14.4 | 10.3 | 12.8 | 28.1 | 98.6 | 86.1 |
| T5-Q | ✓ | 31.2 | 25.9 | 22.6 | 20.0 | 18.5 | 29.6 | 155.0 | 87.5 | ||
| T5-Text | ✓ | ✓ | 53.0 | 48.2 | 44.5 | 41.5 | 31.7 | 53.0 | 318.6 | 90.5 | |
| BART-Q | ✓ | 31.8 | 25.7 | 21.9 | 19.0 | 15.0 | 27.7 | 140.5 | 73.0 | ||
| BART-Text | ✓ | ✓ | 50.6 | 44.4 | 39.9 | 36.4 | 28.8 | 48.7 | 278.3 | 90.1 | |
| LayoutT5 | ✓ | ✓ | ✓ | 56.0 | 50.8 | 46.7 | 43.4 | 34.6 | 54.6 | 335.9 | 90.8 |
| LayoutT5 w/o Saliency Detection | ✓ | ✓ | ✓ | 55.8 | 50.7 | 46.6 | 43.3 | 34.9 | 54.4 | 335.1 | 90.7 |
| LayoutBART | ✓ | ✓ | ✓ | 53.0 | 46.8 | 42.3 | 38.7 | 31.9 | 52.8 | 309.9 | 90.7 |
| LayoutBART w/o Saliency Detection | ✓ | ✓ | ✓ | 52.0 | 45.8 | 41.3 | 37.7 | 31.3 | 52.8 | 302.8 | 90.6 |
| LayoutT5LARGE | ✓ | ✓ | ✓ | 57.2 | 52.1 | 48.1 | 44.9 | 37.3 | 57.1 | 364.2 | 91.3 |
| LayoutBARTLARGE | ✓ | ✓ | ✓ | 57.2 | 51.2 | 46.7 | 43.0 | 36.1 | 57.0 | 346.0 | 91.5 |
We conducted the evaluation experiments with our VisualMRC dataset. We did not use DocVQA because it does not provide ROI annotations in images and does not focus on generating answers. We used BART (Lewis et al. 2020) and T5 (Raffel et al. 2020) as our initial models of our proposed model. We fine-tuned them with the dataset, calling them LayoutBART and LayoutT5, respectively.
Experimental Setup
Evaluation settings.
In the end-to-end evaluation setting (corresponding to Task 1), we conducted ROI detection with a Faster R-CNN (Subtask 1) and used Tesseract (Smith 2007) to extract OCR words from each ROI (Subtask 2); while in the main evaluation setting, we used the ground-truth ROIs (manually annotated bounding boxes and semantic class labels) and the OCR words for the ROIs provided in the VisualMRC dataset. Our model and the baselines were trained on the ground-truth ROIs for both the evaluation settings. We evaluated our model in the main setting unless otherwise stated. Note that the performance in the end-to-end setting is important for application scenarios in the real-world.
When making comparisons with human performance under the main setting, we first randomly picked 3,000 QA pairs (on 1,000 images) from the test set. Next, one reliable worker answered the questions about the images. Then, another reliable worker validated the correctness of the answers created by the first reliable worker. Finally, we compared the original answers and the answers created and validated by the reliable workers.
Baselines.
We used a state-of-the-art model for text-based VQA, M4C (Hu et al. 2020), that takes OCR tokens, question, and ROI features as input and generates an answer word-by-word sequentially. Note that the whole architecture of M4C except the input embeddings (OCR, question, and ROI) were not pre-trained. In addition, we used the fine-tuned T5 and BART without visual information (T5-Text and BART-Text). They correspond to our models without the segment, location, and appearance embeddings and without saliency detection. We used T5BASE and BARTBASE unless otherwise stated. We also used the ones that take a question only as input (-Q) and that take visual features only as input (-Visual).
Evaluation metrics.
Following the previous generative MRC and image captioning tasks, we used BLEU (Papineni et al. 2002), METEOR (Denkowski and Lavie 2014), ROUGE-L (Lin 2004), and CIDEr (Vedantam, Zitnick, and Parikh 2015) to assess the quality of the generated answers. These scores were calculated with the coco-caption toolkit. We also used the F1 score of BERTScore, which is highly correlated with human judgment (Zhang et al. 2020).
Implementation Details
We implemented all the models in PyTorch and experimented on eight NVIDIA Quadro RTX 8000 GPUs.
Main module.
We implemented our main module based on the BART (Lewis et al. 2020) and T5 (Raffel et al. 2020) of huggingface Transformers (Wolf et al. 2019). We mainly used BARTBASE (six layers with 768 hidden size) and T5BASE (12 layers with 768 hidden size) to initialize our models. The following settings for the BASE version are the same as those for the LARGE version of BART (12 layers with a hidden size of 1024) and T5 (24 layers with a hidden size of 1024).
The balancing parameter was set to . During training, we used a batch size of 32, and trained for a maximum of seven epochs. Our model was trained using the Adam optimizer (Kingma and Ba 2015) with a learning rate of 3e-5. The best model in terms of ROUGE-L was selected using the validation set. When an OCR word is tokenized into sub-word tokens, the bounding box coordinates of a sub-word token are the same as those of its whole word as in LayoutLM (Xu et al. 2020).
For the appearance embeddings, we used a Faster R-CNN (Ren et al. 2015) with a ResNet-101 (He et al. 2016) backbone pre-trained on Visual Genome (Krishna et al. 2017), where we used the code and model of M4C222https://github.com/ronghanghu/pythia (Hu et al. 2020). Then, the fc7 weights of the Faster R-CNN were only fine-tuned during the training of the main module with the VisualMRC dataset. For the saliency detection, we used a label smoothing technique (Szegedy et al. 2016) to smooth positive labels to 0.9.
Sub-module for ROI detection.
We trained another Faster-RCNN with a ResNet-101 backbone with VisualMRC independently of the main module for three epochs, with a batch size of 16 and the Adam optimizer. The starting learning rate was 1e-3. Standard anchor scales of [8, 16, 32] and anchor ratios of [0.5, 1.0, 2.0] were used.
M4C.
We implemented M4C and its variant based on the above-mentioned authors’ code. To enrich the OCR token representation of M4C, we replaced FastText (Bojanowski et al. 2017) with BERTBASE of huggingface Transformers. We used the ROIs of the VisualMRC dataset as the detected objects to be handled in M4C.
Evaluation Results
Do our models outperform other models?
Table 3 shows that our models outperformed the baselines on all metrics. This indicates that the additional learning of the visual layout and content of documents improves performance. M4C, a non pre-trained VQA model, performed significantly worse than BART and T5. This indicates that the transfer of their pre-trained NLG ability to the VisualMRC task is useful in generating answers. Mathew, Karatzas, and Jawahar (2021) also reported that BERT (Devlin et al. 2019) outperformed M4C in the DocVQA task. We also found significant performance improvements on all metrics when the model parameters were increased from BASE to LARGE. Moreover, we noticed that the models that disregarded the visual information and OCR tokens performed worse than the full models.
Does multi-task learning with saliency detection improve the performance?
Table 3 shows that our models (jointly trained with the saliency detector) outperformed the other models that did not have the saliency detector, except METEOR of LayoutT5. The improvements in LayoutT5 were smaller than those in LayoutBART because T5’s pre-training includes an MRC task (Rajpurkar et al. 2016) that is similar to saliency detection in terms of extracting of important pieces from a document.
| Model | BLEU-4 | METEOR | ROUGE-L | CIDEr | BERTscore |
|---|---|---|---|---|---|
| M4C | 10.2 | 12.7 | 28.0 | 97.6 | 86.1 |
| T5-Text | 38.6 | 29.8 | 50.2 | 297.6 | 90.0 |
| w/o ROI det | 37.5 | 28.8 | 48.6 | 284.3 | 89.5 |
| BART-Text | 34.6 | 27.5 | 47.3 | 265.6 | 90.0 |
| w/o ROI det | 33.2 | 27.2 | 46.7 | 258.6 | 89.7 |
| LayoutT5 | 41.0 | 33.2 | 52.2 | 317.9 | 90.3 |
| w/o ROI det | 39.1 | 31.0 | 49.3 | 292.8 | 89.8 |
| LayoutBART | 36.4 | 30.5 | 50.5 | 293.9 | 90.4 |
| w/o ROI det | 33.8 | 29.6 | 48.6 | 277.3 | 90.0 |
Do our models also perform well in the end-to-end setting?
Table 4 shows that our models also outperformed the baselines on all metrics in the end-to-end setting that is important for application scenarios in the real-world. The performances in the end-to-end setting was not significantly decreased compared with those in the main setting. But there is still room for improving ROI detection (the mean Average Precision was 7.86%). This was comparable to the performance of a Faster R-CNN (5.1%) reported by Soto and Yoo (2019) on a document layout analysis dataset (Tkaczyk, Szostek, and Bolikowski 2014).
Furthermore, we compared the models that directly read the images (w/o ROI detection). Table 4 shows that ROI detection was effective. This is because our OCR system fails to read tokens in the correct order when reading complicated (multi-column) documents, and ROI detection enables our model to utilize visual layout information.
| Model | BLEU-4 | METEOR | ROUGE-L | CIDEr | BERTscore |
|---|---|---|---|---|---|
| T5-Text | 41.5 | 31.7 | 53.0 | 318.6 | 90.5 |
| + lbl | 42.9 | 32.5 | 53.2 | 321.0 | 90.5 |
| + seg | 43.6 | 32.8 | 53.3 | 320.7 | 90.5 |
| + loc | 44.1 | 33.5 | 53.7 | 325.2 | 90.5 |
| + app | 43.3 | 34.9 | 54.4 | 335.1 | 90.7 |
| BART-Text | 36.4 | 28.8 | 48.7 | 278.3 | 90.1 |
| + lbl | 37.6 | 30.3 | 50.7 | 293.7 | 90.3 |
| + seg | 37.8 | 30.3 | 50.9 | 296.0 | 90.4 |
| + loc | 38.1 | 30.3 | 51.4 | 296.3 | 90.5 |
| + app | 37.7 | 31.3 | 52.8 | 302.8 | 90.6 |
Is modifying the input sequence and embeddings effective?
Table 5 shows the results of modifying the input sequence and embeddings of the baselines (BART-Text and T5-Text). First, inserting the region class labels (lbl) before the OCR token sequence consistently improved almost all the metrics except BERTscore of T5-Text. Second, adding the segment (seg) and location (loc) embeddings also improved performance. Third, using the appearance embedding (app) improved the performance except in terms of BLEU-4; this observation is in line with previous studies (Le and Hoi 2020; Li et al. 2020b).
| BLEU-4 | METEOR | ROUGE-L | CIDEr | BERTscore | |
|---|---|---|---|---|---|
| Heading/Title | 37.9/42.8 | 29.8/32.5 | 49.9/52.6 | 289.2/315.4 | 89.9/90.3 |
| Paragraph/Body | 42.7/44.1 | 32.3/35.0 | 54.0/55.1 | 328.1/340.9 | 90.6/90.8 |
| Subtitle/Byline | 39.6/46.3 | 29.9/33.8 | 48.0/52.6 | 314.2/353.1 | 90.0/90.8 |
| Picture | 25.9/32.0 | 24.8/29.8 | 44.9/49.0 | 242.6/282.7 | 89.4/90.3 |
| Caption | 31.2/41.1 | 28.0/33.1 | 50.3/55.5 | 289.4/344.0 | 89.6/91.0 |
| List | 35.7/39.0 | 30.4/33.1 | 48.1/50.4 | 282.5/307.0 | 90.0/90.7 |
| Data | 31.8/32.7 | 26.1/29.3 | 42.2/46.4 | 248.5/287.0 | 88.9/89.6 |
| Sub-Data | 30.1/41.4 | 26.4/32.4 | 42.8/50.6 | 236.3/315.8 | 88.9/90.6 |
| Other | 34.1/41.5 | 28.1/32.5 | 48.4/51.7 | 260.6/290.0 | 89.8/90.5 |
On which classes of ROI does our model work well?
Table 6 shows the performance broken down by semantic class according to whether it is included in the relevant ROIs. LayoutT5 performed better than T5-Text on all metrics and all semantic classes. Particularly, LayoutT5 showed significantly improvements on the Picture, Caption, Sub-Data, and Other classes. This indicates that our model was especially effective at understanding vision-related data. However, both T5-Text and LayoutT5 underperformed on the Picture and Data classes compared with the other classes; determining ways of improving performance on these classes will be our future work.
| BLEU-4 | METEOR | ROUGE-L | CIDEr | BERTScore | |
|---|---|---|---|---|---|
| LayoutT5 | 42.1 | 35.6 | 54.5 | 344.1 | 90.9 |
| LayoutBART | 40.6 | 34.6 | 55.2 | 329.1 | 91.2 |
| Human | 39.6 | 41.0 | 57.9 | 370.3 | 91.9 |
| Model | Avg. Time |
|---|---|
| T5-Text | 0.1812 |
| LayoutT5 | 0.2253 |
| LayoutT5LARGE | 0.4489 |
Do our models outperform than humans?
Table 7 compares the performance of our best models (LayoutT5LARGE and LayoutBARTLARGE) with human performance in the end-to-end setting. Our models achieved the highest BLEU-4, but the human level of performance was significantly higher on the other metrics. This indicates that there is still a performance gap between humans and the best machine.
How fast is our model?
Table 8 shows the average time to answer a single question from our models and the baselines with a NVIDIA Quadro RTX 8000 GPU. LayoutT5 needs to obtain a number of appearance embeddings for OCR tokens; however, LayoutT5 did not slow down significantly compared with T5-Text. The Faster R-CNN for appearance embeddings ran fast because it does not need to propose ROIs. LayoutT5LARGE ran much slower because it has about 3.5 times the parameters of LayoutT5.
Output Example
Figure 7 shows an example of answers generated by the baselines and our model. In response to the question about the percentage of the Roman Catholics in Cape Verde, our model was able to understand that the first row of the visual data table contains the information required to answer the question (“77.3%”) and generate the same answer as the ground-truth. T5-Text, which does not take into account the visual layout of the document images, was distracted by another percentage representation (“less than 1 percent”).
Figure 8 shows an incorrect example, where the question is about the color of an object in the diagram. The proposed and baseline models could not identify the object related to the question and correctly answer its color. This indicates that further research should be conducted on detecting objects in diagrams within the document image.
Related Work and Discussion
Transfer learning for vision and language.
Recent Transformer-based vision and language models, pre-trained with large-scale image captioning and VQA datasets, have achieved state-of-the-art performances on vision and language tasks (Chen et al. 2020; Li et al. 2020a; Lu et al. 2020; Zhou et al. 2020). Moreover, as a pre-trained model for document layout analysis, Xu et al. (2020) proposed LayoutLM, which models interactions between text and layout information across grayscale scanned document images. It takes OCR words and their appearance as inputs and performs well in form and receipt understanding and in document image classification. But it cannot consider the appearance of visual content such as charts that can be handled with M4C and our models.
The NLG ability is important for the VisualMRC task, but the above pre-trained vision and language models, including LayoutLM, are not pre-trained on text-to-text tasks. Sequence-to-sequence models pre-trained with large-scale text corpora have been successful in NLG tasks, so we decided to use BART and T5 as the base models and modified them into vision and language models.
Document layout analysis.
Neural networks have been recently used for page segmentation in order to split a document image into ROIs and to recognize the role of each ROI. Yang et al. (2017) treated the task as a pixel-by-pixel classification problem. Katti et al. (2018) treated each document page as a two-dimensional grid of characters and predicted a segmentation mask and bounding boxes. Soto and Yoo (2019) proposed an adaptation of the Faster R-CNN object detection model (Ren et al. 2015), with the addition of contextual features such as page numbers and ROI positions and sizes. We also used a Faster R-CNN to detect the bounding boxes and semantic classes of ROIs. To further improve the accuracy in the end-to-end VisualMRC setting, it will be important to improve the document layout analysis.

| Q: what is the percentage of roman catholics in cape verde? |
| GT: the percentage of roman catholics in cape verde is 77.3%. |
| M4C: the percentage of young women in cape town are about 54% of western somalia |
| T5-Text: percentage of roman catholics in cape verde is less than 1 percent. |
| LayoutT5: the percentage of roman catholics in cape verde is 77.3%. |
| Q: in the graphic, what is the colour of economy? |
| GT: green |
| M4C: the colour of graphics is red. |
| T5-Text: ay |
| LayoutT5: economy is yellow. |
Conclusion
This study posed visual machine reading comprehension as a novel vision and language task. Compared with existing VQA datasets such as TextVQA and DocVQA, our VisualMRC dataset focuses more on developing NLU and NLG abilities on various document images. Our dataset contains 30,000+ questions defined on 10,000+ images of contemporary born-digital webpages on multiple domains. It requires a system to be able to read and reason about multiple pieces of text and non-text data in images and to generate abstractive answers. We believe that this dataset will contribute to the development of intelligent assistant agents that can read real-world documents.
Our visual machine reading comprehension models are based on encoder-decoder models pre-trained on large-scale text corpora, such as BART and T5, and they additionally learn the visual layout and content of document images. Our models outperformed BART and T5 simply fine-tuned with only textual information and M4C, a state-of-the-art model for text-based VQA datasets that takes question, OCR tokens, and visual features of documents. The key to its success is transferring the pre-trained NLG capability to the visual machine reading comprehension task by adding embeddings and an auxiliary saliency detection task for learning visual information in a way that does not cause catastrophic forgetting. Moreover, our approach can be easily applied to other pre-trained encoder-decoder models. Our future work will involve exploring more effective pre-training methods for this task and improving the understanding of data objects such as tables, charts, and diagrams.
References
- Antol et al. (2015) Antol, S.; Agrawal, A.; Lu, J.; Mitchell, M.; Batra, D.; Zitnick, C. L.; and Parikh, D. 2015. VQA: Visual Question Answering. In ICCV, 2425–2433.
- Ba, Kiros, and Hinton (2016) Ba, L. J.; Kiros, R.; and Hinton, G. E. 2016. Layer Normalization. arXiv 1607.06450.
- Biten et al. (2019) Biten, A. F.; Tito, R.; Mafla, A.; i Bigorda, L. G.; Rusiñol, M.; Jawahar, C. V.; Valveny, E.; and Karatzas, D. 2019. Scene Text Visual Question Answering. In ICCV, 4290–4300.
- Blei, Ng, and Jordan (2003) Blei, D. M.; Ng, A. Y.; and Jordan, M. I. 2003. Latent Dirichlet Allocation. J. Mach. Learn. Res. 3: 993–1022.
- Bojanowski et al. (2017) Bojanowski; Piotr; Grave; Edouard; Joulin; Armand; Mikolov; and Tomas. 2017. Enriching word vectors with subword information. TACL 5: 135–146.
- Chen et al. (2020) Chen, Y.; Li, L.; Yu, L.; Kholy, A. E.; Ahmed, F.; Gan, Z.; Cheng, Y.; and Liu, J. 2020. UNITER: Learning UNiversal Image-TExt Representations. In ECCV, to appear.
- Cui et al. (2017) Cui, L.; Huang, S.; Wei, F.; Tan, C.; Duan, C.; and Zhou, M. 2017. SuperAgent: A Customer Service Chatbot for E-commerce Websites. In ACL, 97–102.
- Denkowski and Lavie (2014) Denkowski, M. J.; and Lavie, A. 2014. Meteor Universal: Language Specific Translation Evaluation for Any Target Language. In WMT@ACL, 376–380.
- Devlin et al. (2019) Devlin, J.; Chang, M.; Lee, K.; and Toutanova, K. 2019. BERT: Pre-training of Deep Bidirectional Transformers for Language Understanding. In NAACL-HLT, 4171–4186.
- Goyal et al. (2017) Goyal, Y.; Khot, T.; Summers-Stay, D.; Batra, D.; and Parikh, D. 2017. Making the V in VQA Matter: Elevating the Role of Image Understanding in Visual Question Answering. In CVPR, 6325–6334.
- Gurari et al. (2018) Gurari, D.; Li, Q.; Stangl, A. J.; Guo, A.; Lin, C.; Grauman, K.; Luo, J.; and Bigham, J. P. 2018. VizWiz Grand Challenge: Answering Visual Questions From Blind People. In CVPR, 3608–3617.
- He et al. (2016) He, K.; Zhang, X.; Ren, S.; and Sun, J. 2016. Deep Residual Learning for Image Recognition. In CVPR, 770–778.
- Hong et al. (2019) Hong, Y.; Wang, J.; Jia, Y.; Zhang, W.; and Wang, X. 2019. Academic Reader: An Interactive Question Answering System on Academic Literatures. In AAAI, 9855–9856.
- Hu et al. (2020) Hu, R.; Singh, A.; Darrell, T.; and Rohrbach, M. 2020. Iterative Answer Prediction with Pointer-Augmented Multimodal Transformers for TextVQA. In CVPR, 9992–10002.
- Kafle et al. (2018) Kafle, K.; Price, B. L.; Cohen, S.; and Kanan, C. 2018. DVQA: Understanding Data Visualizations via Question Answering. In CVPR, 5648–5656.
- Kahou et al. (2018) Kahou, S. E.; Michalski, V.; Atkinson, A.; Kádár, Á.; Trischler, A.; and Bengio, Y. 2018. FigureQA: An Annotated Figure Dataset for Visual Reasoning. In ICLR Workshop.
- Katti et al. (2018) Katti, A. R.; Reisswig, C.; Guder, C.; Brarda, S.; Bickel, S.; Höhne, J.; and Faddoul, J. B. 2018. Chargrid: Towards Understanding 2D Documents. In EMNLP, 4459–4469.
- Kembhavi et al. (2017) Kembhavi, A.; Seo, M. J.; Schwenk, D.; Choi, J.; Farhadi, A.; and Hajishirzi, H. 2017. Are You Smarter Than a Sixth Grader? Textbook Question Answering for Multimodal Machine Comprehension. In CVPR, 5376–5384.
- Kingma and Ba (2015) Kingma, D. P.; and Ba, J. 2015. Adam: A Method for Stochastic Optimization. In ICLR.
- Kociský et al. (2018) Kociský, T.; Schwarz, J.; Blunsom, P.; Dyer, C.; Hermann, K. M.; Melis, G.; and Grefenstette, E. 2018. The NarrativeQA Reading Comprehension Challenge. Trans. Assoc. Comput. Linguistics 6: 317–328.
- Krishna et al. (2017) Krishna, R.; Zhu, Y.; Groth, O.; Johnson, J.; Hata, K.; Kravitz, J.; Chen, S.; Kalantidis, Y.; Li, L.; Shamma, D. A.; Bernstein, M. S.; and Fei-Fei, L. 2017. Visual Genome: Connecting Language and Vision Using Crowdsourced Dense Image Annotations. Int. J. Comput. Vis. 123(1): 32–73.
- Kwiatkowski et al. (2019) Kwiatkowski, T.; Palomaki, J.; Redfield, O.; Collins, M.; Parikh, A. P.; Alberti, C.; Epstein, D.; Polosukhin, I.; Devlin, J.; Lee, K.; Toutanova, K.; Jones, L.; Kelcey, M.; Chang, M.; Dai, A. M.; Uszkoreit, J.; Le, Q.; and Petrov, S. 2019. Natural Questions: a Benchmark for Question Answering Research. Trans. Assoc. Comput. Linguistics 7: 452–466.
- Le and Hoi (2020) Le, H.; and Hoi, S. C. H. 2020. Video-Grounded Dialogues with Pretrained Generation Language Models. In ACL, 5842–5848.
- Lewis et al. (2020) Lewis, M.; Liu, Y.; Goyal, N.; Ghazvininejad, M.; Mohamed, A.; Levy, O.; Stoyanov, V.; and Zettlemoyer, L. 2020. BART: Denoising Sequence-to-Sequence Pre-training for Natural Language Generation, Translation, and Comprehension. In ACL, 7871–7880.
- Li et al. (2020a) Li, G.; Duan, N.; Fang, Y.; Gong, M.; and Jiang, D. 2020a. Unicoder-VL: A Universal Encoder for Vision and Language by Cross-Modal Pre-Training. In AAAI, 11336–11344.
- Li et al. (2020b) Li, Z.; Li, Z.; Zhang, J.; Feng, Y.; Niu, C.; and Zhou, J. 2020b. Bridging Text and Video: A Universal Multimodal Transformer for Video-Audio Scene-Aware Dialog. arXiv 2002.00163.
- Lin (2004) Lin, C.-Y. 2004. Rouge: A package for automatic evaluation of summaries. In Text summarization branches out@ACL, 74–81.
- Liu et al. (2020) Liu, D.; Gong, Y.; Fu, J.; Yan, Y.; Chen, J.; Jiang, D.; Lv, J.; and Duan, N. 2020. RikiNet: Reading Wikipedia Pages for Natural Question Answering. In ACL, 6762–6771.
- Lu et al. (2020) Lu, J.; Goswami, V.; Rohrbach, M.; Parikh, D.; and Lee, S. 2020. 12-in-1: Multi-Task Vision and Language Representation Learning. In CVPR, 10437–10446.
- Mathew, Karatzas, and Jawahar (2021) Mathew, M.; Karatzas, D.; and Jawahar, C. V. 2021. DocVQA: A Dataset for VQA on Document Images. In WACV, 2200–2209.
- Mishra et al. (2019) Mishra, A.; Shekhar, S.; Singh, A. K.; and Chakraborty, A. 2019. OCR-VQA: Visual Question Answering by Reading Text in Images. In ICDAR, 947–952.
- Papineni et al. (2002) Papineni, K.; Roukos, S.; Ward, T.; and Zhu, W.-J. 2002. BLEU: a method for automatic evaluation of machine translation. In ACL, 311–318.
- Raffel et al. (2020) Raffel, C.; Shazeer, N.; Roberts, A.; Lee, K.; Narang, S.; Matena, M.; Zhou, Y.; Li, W.; and Liu, P. J. 2020. Exploring the Limits of Transfer Learning with a Unified Text-to-Text Transformer. J. Mach. Learn. Res. 21(140): 1–67.
- Rajpurkar, Jia, and Liang (2018) Rajpurkar, P.; Jia, R.; and Liang, P. 2018. Know What You Don’t Know: Unanswerable Questions for SQuAD. In ACL, 784–789.
- Rajpurkar et al. (2016) Rajpurkar, P.; Zhang, J.; Lopyrev, K.; and Liang, P. 2016. SQuAD: 100,000+ Questions for Machine Comprehension of Text. In EMNLP, 2383–2392.
- Ren et al. (2015) Ren; Shaoqing; He; Kaiming; Girshicka; Ross; Sun; and Jian. 2015. Faster r-cnn: Towards real-time object detection with region proposal networks. In NIPS, 91–99.
- Shaw, Uszkoreit, and Vaswani (2018) Shaw, P.; Uszkoreit, J.; and Vaswani, A. 2018. Self-Attention with Relative Position Representations. In NAACL-HLT, 464–468.
- Singh et al. (2019) Singh, A.; Natarajan, V.; Shah, M.; Jiang, Y.; Chen, X.; Batra, D.; Parikh, D.; and Rohrbach, M. 2019. Towards VQA Models That Can Read. In CVPR, 8317–8326.
- Smith (2007) Smith, R. 2007. An Overview of the Tesseract OCR Engine. In ICDAR, 629–633.
- Soto and Yoo (2019) Soto, C.; and Yoo, S. 2019. Visual Detection with Context for Document Layout Analysis. In EMNLP-IJCNLP, 3462–3468.
- Szegedy et al. (2016) Szegedy; Christian; Vincent, V.; Ioffe; Sergey; Shlens; Jon; Wojna; and Zbigniew. 2016. Rethinking the inception architecture for computer vision. In CVPR, 2818–2826.
- Tkaczyk, Szostek, and Bolikowski (2014) Tkaczyk, D.; Szostek, P.; and Bolikowski, L. 2014. GROTOAP2 - The Methodology of Creating a Large Ground Truth Dataset of Scientific Articles. D Lib Mag. 20(11/12).
- Vaswani et al. (2017) Vaswani, A.; Shazeer, N.; Parmar, N.; Uszkoreit, J.; Jones, L.; Gomez, A. N.; Kaiser, L.; and Polosukhin, I. 2017. Attention is All you Need. In NIPS, 6000–6010.
- Vedantam, Zitnick, and Parikh (2015) Vedantam, R.; Zitnick, C. L.; and Parikh, D. 2015. CIDEr: Consensus-based image description evaluation. In CVPR, 4566–4575.
- Wang et al. (2020) Wang, X.; Liu, Y.; Shen, C.; Ng, C. C.; Luo, C.; Jin, L.; Chan, C. S.; van den Hengel, A.; and Wang, L. 2020. On the General Value of Evidence, and Bilingual Scene-Text Visual Question Answering. In CVPR, 10126–10135.
- Wolf et al. (2019) Wolf, T.; Debut, L.; Sanh, V.; Chaumond, J.; Delangue, C.; Moi, A.; Cistac, P.; Rault, T.; Louf, R.; Funtowicz, M.; Davison, J.; Shleifer, S.; von Platen, P.; Ma, C.; Jernite, Y.; Plu, J.; Xu, C.; Scao, T. L.; Gugger, S.; Drame, M.; Lhoest, Q.; and Rush, A. M. 2019. HuggingFace’s Transformers: State-of-the-art Natural Language Processing. arXiv 1910.03771.
- Xu et al. (2020) Xu, Y.; Li, M.; Cui, L.; Huang, S.; Wei, F.; and Zhou, M. 2020. LayoutLM: Pre-training of Text and Layout for Document Image Understanding. In KDD, 1192–1200.
- Yagcioglu et al. (2018) Yagcioglu, S.; Erdem, A.; Erdem, E.; and Ikizler-Cinbis, N. 2018. RecipeQA: A Challenge Dataset for Multimodal Comprehension of Cooking Recipes. In EMNLP, 1358–1368.
- Yang et al. (2017) Yang, X.; Yumer, E.; Asente, P.; Kraley, M.; Kifer, D.; and Giles, C. L. 2017. Learning to Extract Semantic Structure from Documents Using Multimodal Fully Convolutional Neural Networks. In CVPR, 4342–4351.
- Zhang et al. (2020) Zhang, T.; Kishore, V.; Wu, F.; Weinberger, K. Q.; and Artzi, Y. 2020. BERTScore: Evaluating Text Generation with BERT. In ICLR.
- Zhou et al. (2020) Zhou, L.; Palangi, H.; Zhang, L.; Hu, H.; Corso, J. J.; and Gao, J. 2020. Unified Vision-Language Pre-Training for Image Captioning and VQA. In AAAI, 13041–13049.