X-Ray Emission from the PeVatron-candidate Supernova Remnant G106.3+2.7
Abstract
We report the discovery of diffuse X-ray emission around the supernova remnant (SNR) G106.3+2.7, which is associated with VER J2227+608 and HAWC J2227+610 and is known as a candidate for a PeV cosmic-ray accelerator (PeVatron). We analyze observational data of Suzaku around the SNR and the adjacent pulsar PSR J2229+6114. We find diffuse X-ray emission that is represented by either thermal or nonthermal processes. However, the metal abundance for the thermal emission is , which may be too small in the Milky Way and suggests that the emission is nonthermal. The intensity of the diffuse emission increases toward PSR J2229+6114 in the same way as radio emission, and it is in contrast with gamma-ray emission concentrated on a molecular cloud. The X-ray photon index does not change with the distance from the pulsar and it indicates that radiative cooling is ineffective and particle diffusion is not extremely slow. The X-ray and radio emissions seem to be of leptonic origin and the parent electrons may originate from the pulsar. The gamma-ray emission appears to be of hadronic origin because of its spatial distribution. The parent protons may be tightly confined in the cloud separately from the diffusing electrons.
1 Introduction
The origins of cosmic rays (CRs) are still not fully understood. It is often believed that CRs with energies up to a few PeV (so-called “knee”) originate from sources within the Milky Way. Although it is generally accepted that CRs in the GeV and TeV energy ranges are accelerated by shocks in supernova remnants (SNRs), no SNR has been shown to emit gamma rays to hundreds of TeV as would be indicative of a source capable of accelerating protons to PeV (PeVatron).
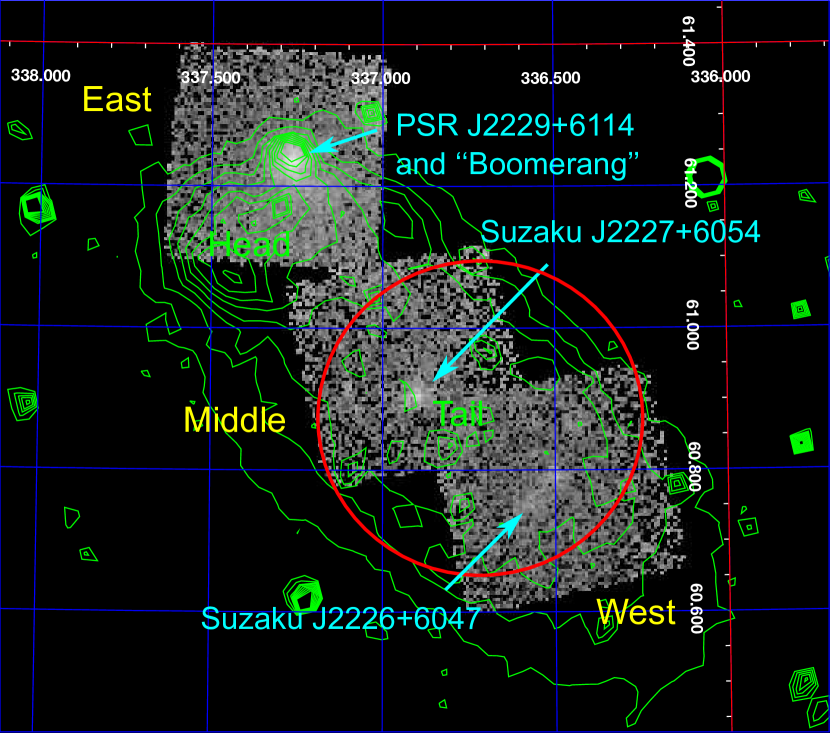
The SNR G106.3+2.7 may be a possible exception. It was discovered by a 408 MHz radio survey (Joncas & Higgs, 1990), and then it was interpreted as an SNR with an unusual head-tail morphology (Pineault & Joncas, 2000). The diffuse radio emission is bright at the “head” that is close to the powerful pulsar PSR J2229+6114 (Figure 1) with a spin-down luminosity of (Halpern et al., 2001a). TeV gamma-ray emission from this region has been discovered by the Milagro collaboration at 20 TeV (Abdo et al., 2007) and 35 TeV (Abdo et al., 2009), and by the VERITAS collaboration at –15 TeV (Acciari et al., 2009). The VERITAS source was named as VER J2227+608. Recently, HAWC identified the object as HAWC J2227+610 at least up to TeV (Albert et al., 2020), which means that the energy of the parent protons should be close up to PeV. It has also been detected in the GeV band with Fermi (Xin et al., 2019). These gamma-ray observations have shown that the emission is concentrated around a molecular cloud, which suggests that the gamma rays are produced through the interaction between CR protons and protons in the molecular cloud ( decay or hadronic origin). The gamma-ray emitting region is located in the “tail” of the diffuse radio emission (Figure 1). The spin axis of PSR J2229+6114 is toward the northwest in contrast with the direction of the tail (southwest; Kothes et al. 2006).
X-ray observations can be used to discuss whether the gamma rays are produced by CR electrons (leptonic origin). Moreover, they are useful to constrain the maximum energy of CR electrons if the X-ray emission is synchrotron (Xin et al., 2019; Liu et al., 2020). However, previous X-ray observations were limited to the emissions from PSR J2229+6114 and its vicinity (Halpern et al., 2001b). In this paper, we report the results of Suzaku observations of G106.3+2.7. The Suzaku X-ray Imaging Spectrometer (XIS) (Koyama et al., 2007) has high sensitivity and stable low background (Yamaguchi et al., 2006), and it is the optimal device to search for diffuse X-ray emission from G106.3+2.7.
This paper is organized as follows. In Section 2, we summarize the Suzaku observations. The data analysis routines are presented in Section 3 and the results are shown in Section 4. The origin of the nonthermal emissions is discussed in Section 5, followed by a summary in Section 6. The errors quoted in the text and tables all represent a confidence level.
2 Observations
We analyzed the archive data of Suzaku XIS that cover three fields around G106.3+2.7. They are called the “East,” “Middle,” and “West,” respectively (Figure 1). Since the possible diffuse X-ray source could cover the entire Suzaku fields, we also use the Suzaku data of a blank field near G106.3+2.7 that is called the “Reference.” From now on, we collectively refer to the East, Middle, and West fields as the “Source” fields. The observation logs are summarized in Table 1. The XIS is composed of four CCD cameras (XIS 0, 1, 2, and 3). XIS 0, 2, and 3 are front-illuminated (FI) CCDs, and XIS 1 is a back-illuminated (BI) CCD. The field of view (FOV) of the XIS is . The entire FOV of XIS 2 and one-fourth of XIS 0 havej been out of function since 2006 November and 2009 June, respectively. We chose cleaned event data that had been screened in standard ways. We used HEASoft 6.25 (Nasa High Energy Astrophysics Science Archive Research Center (2014), Heasarc) for data analysis.
Figure 1 is a mosaic XIS image of G106.3+2.7 in the 1–5 keV band. Vignetting is corrected. The XIS fields fairly cover the TeV gamma-ray emitting region (Acciari et al., 2009; Xin et al., 2019). The bright source around the center of the East field is the pulsar PSR J2229+6114. The Middle and West fields also contain X-ray sources near their centers, respectively. We have checked Chandra and XMM-Newton images and have found that the source in the Middle field (Suzaku J2227+6054) is a compact source. Although that in the West field (Suzaku J2226+6047) appears to be diffuse, it contains a point source.
3 Spectral Analysis
In the spectral analysis, we exclude PSR J2229+6114 and its pulsar wind nebula (PWN) by a radius and remove Suzaku J2226+6047 and Suzaku J2227+6054 by a radius because we are interested in diffuse emission. We also exclude other point sources with fluxes of listed in Chandra Source Catalog 2.0111https://cxc.harvard.edu/csc/ and XMM-DR9 catalog222http://xmmssc.irap.omp.eu/Catalogue/4XMM-DR9/4XMM_DR9.html by a radius. We analyze photons with energies of 0.5–7 keV in the entire fields excluding those point sources.
| Name | ObsID | Date | Position | Exposure |
|---|---|---|---|---|
| (YYYY MM DD) | (J2000) | (ks) | ||
| East | 505054010 | 2010 05 16 | (337.33, 61.23) | 59 |
| Middle | 505072010 | 2010 08 15 | (336.95, 60.94) | 25 |
| West | 505073010 | 2010 08 16 | (336.54, 60.77) | 55 |
| Reference | 501100010 | 2006 06 06 | (347.95, 61.94) | 72 |
| Field (Emission) | /dofg | ||||||
|---|---|---|---|---|---|---|---|
| (keV) | () | (keV) | () | ||||
| East (Nonthermal) | 552.98/433 | ||||||
| East (Thermal) | 546.20/433 | ||||||
| Middle (Nonthermal) | 348.58/241 | ||||||
| Middle (Thermal) | 348.46/241 | ||||||
| West (Nonthermal) | 486.01/386 | ||||||
| West (Thermal) | 486.32/386 | ||||||
| Combined (Nonthermal) | 936.64/834 | ||||||
| Combined (Thermal) | 931.24/834 |
Note. — a Temperature of the diffuse Galactic hot gas (GHG). b Combined absorption column density by the interstellar medium and possible dense gas around G106.3+2.7. c Photon index of the nonthermal emission from G106.3+2.7. d Temperature of the thermal emission from G106.3+2.7. e Metal abundance of thermal emission from G106.3+2.7. f Average surface brightness of the source component in the 2–10 keV band (). g and the degree of freedom for the spectral fit.
The response and auxiliary files were created using xisrmfgen and xissimarfgen (Ishisaki et al., 2007) in the HEADAS package, assuming that the emission uniformly comes from the individual fields. The spectra of both the Source and Reference fields contain the non-X-ray background (NXB) and cosmic X-ray background (CXB). Other background components such as the diffuse Galactic hot gas (GHG) including the local hot bubble (Yoshino et al., 2009) may also need to be considered at keV. The NXB is generated by xisnxbgen (Tawa et al., 2008) and it is applied for both the Source and Reference fields. We assume that HI column density due to the interstellar absorption is (HI4PI Collaboration et al., 2016); the slight variation among the fields () is ignored. For the intrinsic emission from the Source fields, we consider nonthermal or thermal processes. In the former case, the spectrum of the Source fields after subtracting NXB is given by XSPEC (Arnaud, 1996) models:
| (1) | |||||
where phabs is the interstellar absorption (), apec represents the GHG with the solar metal abundance, phabs is the combined absorption by the interstellar medium and possible dense gas around G106.3+2.7 (), pegpwrlw corresponds to the CXB given by a power law, and pegpwrlw is the nonthermal emission from G106.3+2.7. We represent the CXB spectrum () with a power-law model with a fixed photon index of 1.4 and set the normalization free because the intensity of CXB can vary from field to field (Kushino et al., 2002). The photon index of pegpwrlw is given by .
If we instead consider thermal emission from G106.3+2.7, pegpwrlw in equation (1) is replaced by apec, and the spectrum is written as
| (2) | |||||
The temperature and the metal abundance of apec are given by and , respectively.
We simultaneously fit the spectra of the Source fields and that of the Reference field. The spectral parameters of the Reference field, including the normalizations of and , are constrained to be the same as those of the Source fields333The obtained parameters for the Reference field slightly differ among the fits for the three Source fields (e.g. in Table 2). except that the fifth component is zero (pegpwrlw or apec) and . We fit the spectra of XIS 0, 1, and 3 together with the same parameters. We use solar abundances from Lodders et al. (2009).
4 Results
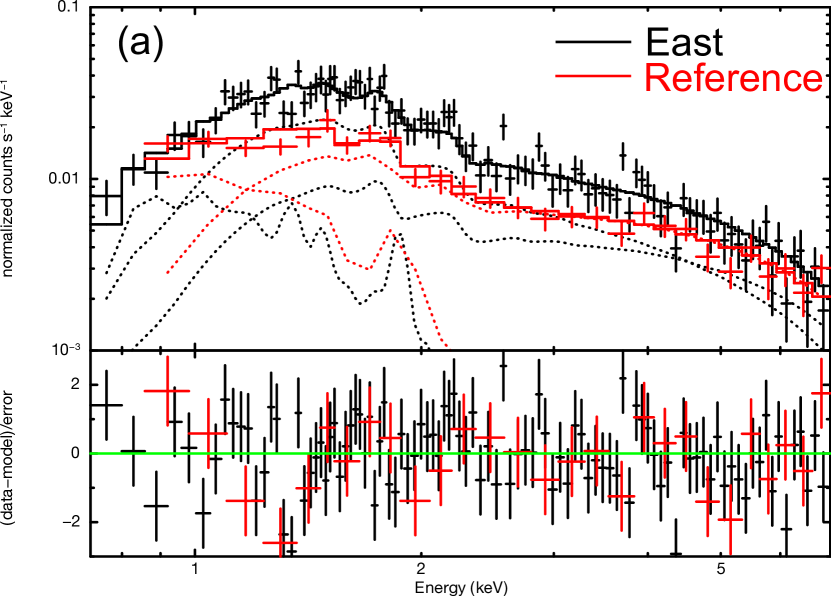
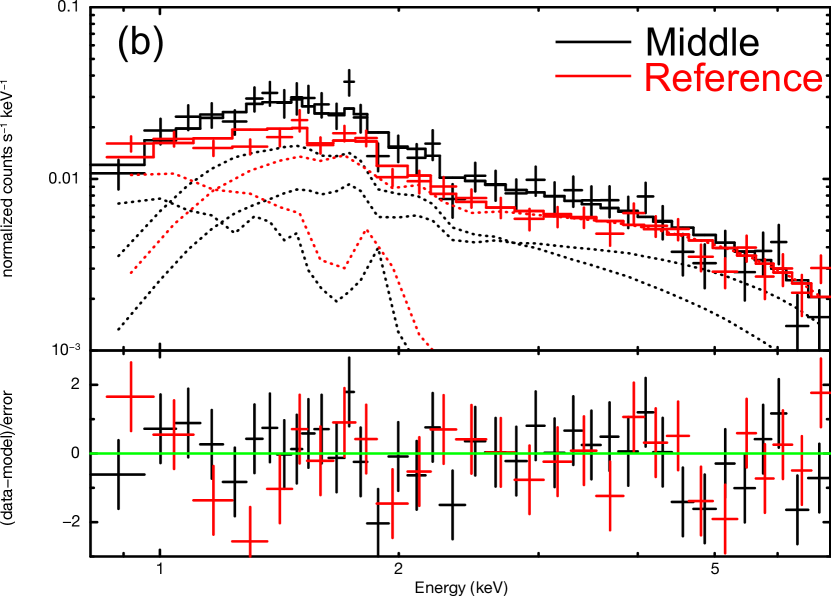
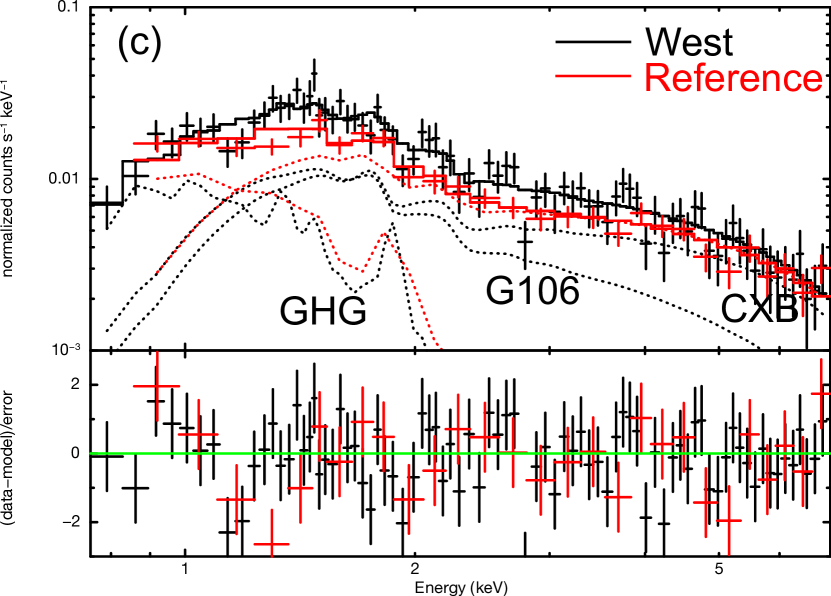
We first study the spectra of individual fields. In Figure 2, we present the XIS spectra of the three Source fields that are fitted with the nonthermal model (equation (1)). We display only XIS 3 spectra for clarity. We also show the spectrum of the Reference field fitted with the model omitting the emission from G106.3+2.7. Table 2 shows the results of the spectral fitting. The temperature of the GHG is represented by and it does not depend much on the fields. We have confirmed that and the flux of the GHG component are consistent with those obtained by the ROSAT All-Sky Survey (Sabol & Snowden, 2019). We have also compared our derived normalizations of the CXB component ( in equation (1)) with the averaged value obtained by a previous study ( for 2–10 keV; Kushino et al. 2002) and found that they are consistent with an error of a few percent. The combined absorption by the interstellar medium and possible dense gas around G106.3+2.7 () is close to that by the interstellar medium alone (). This means that the local absorption around G106.3+2.7 is ignorable. In some cases, is slightly smaller than , which may indicate that varies among fields. We also fit the XIS spectra with the thermal model (equation (2)) and the results are given in Table 2.
Table 2 shows that the variations of (nonthermal) and and (thermal) are small among the fields. The values of in Table 2 indicate that the emission from G106.3+2.7 can be represented by both nonthermal and thermal processes. However, it is notable that is much smaller than regardless of the fields. In order to obtain a stronger constraint, we studied the combined spectrum of the three Source fields assuming that their spectra are the same except for the normalizations. The result shows that (Table 2). Considering that G106.3+2.7 is an object in the Milky Way and also relatively close to the Sun, the abundance is unrealistically small. Thus, we assume that the emission from G106.3+2.7 is nonthermal from now on. The combined flux of the emission (pegpwrlw in equation (1)) from the three fields is in the 2–10 keV band444This value is larger than obtained by Halpern et al. (2001b). This is because Halpern et al. (2001b) set a background region down to a radius of . Our results show that this region still contains diffuse emission from the source. Thus, it is not appropriate to discuss the spectral energy distribution (SED) of G106.3+2.7 based on the results of Halpern et al. (2001b)..
.
5 Discussion
5.1 CR energy spectrum
In Table 2, we present the average surface brightnesses of the source component ( in equation (1) or in equation (2)) in the 2–10 keV band. The brightness decreases from East to West, which means that the diffuse emission becomes weaker as the distance from PSR J2229+6114 increases. We did not study surface brightness distributions within each field because of poor photon statistics. The trend is the same as that for the 1.4 GHz radio continuum (Pineault & Joncas 2000; Kothes et al. 2001; Taylor et al. 2003; see Figure 1), which suggests that the diffuse X-ray emission originates from the pulsar as the radio emission does, and that the density of CRs decreases as they disperse into the interstellar space. On the contrary, the gamma-ray emission is coincident with a molecular cloud that is located around the Middle and West fields (Acciari et al. 2009; Xin et al. 2019; see Figure 1). These may indicate that the gamma-ray emission is due to hadronic processes, while the X-ray and radio emissions are due to leptonic ones.
Based on this idea, we study the spectral energy distribution (SED) of G106.3+2.7. For the energy distribution of particles, we assume an exponential cutoff power-law form:
| (3) |
for both electrons () and protons (). In this equation, is the spectral index, is the particle energy, and is the cutoff energy. The parameters of spectral fit are , , the total energy of particles above 1 GeV (), the magnetic fields (), and the target gas density (). We note that there are many parameters for the fit and some parameters are degenerated. Thus, we focus on the tendency of the SED when the parameters are changed. We calculate radiative processes for electrons using the models by Fang & Zhang (2008) and we derive gamma-ray spectra using the models by Kamae et al. (2006), Kelner et al. (2006), and Karlsson & Kamae (2008).
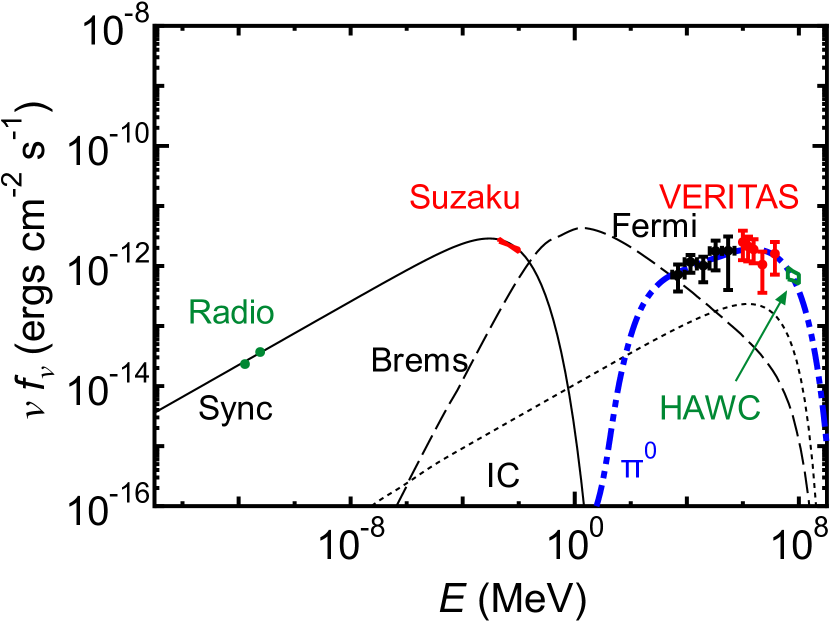
Figure 3 is one example of the fit. We assumed that the distance to G106.3+2.7 is 800 pc (Kothes et al., 2001). Following previous studies (e.g. Xin et al., 2019), the average density of background cloud gas is assumed to be for all regions for the sake of simplicity. In this case, the density cannot be much larger than because Bremsstrahlung emission from electrons becomes prominent in the gamma rays and the shape of the spectrum is inconsistent with the gamma-ray observations. However, we note that if the electrons exist in a lower density region separately from the gamma-ray emitting protons, this constraint is relaxed. The indices and are well-constrained. The cutoff energies are TeV and TeV. The former is broadly determined by our X-ray observations. The magnetic field () and the total electron energy () are degenerated by each other for given synchrotron emission. However, cannot be much smaller than this, because a smaller requires a larger , which leads to larger inverse Compton (IC) scattering from the electrons and invalidates our assumption that the gamma-ray emission is of hadronic origin. For the IC scattering process, an infrared (IR) radiation field ( K and the energy density of ; Moskalenko et al. 2006) is included in addition to the cosmic microwave background (CMB). The total proton energy is . We have confirmed that the emissions from secondary electrons created through the proton-proton interaction are ignorable.
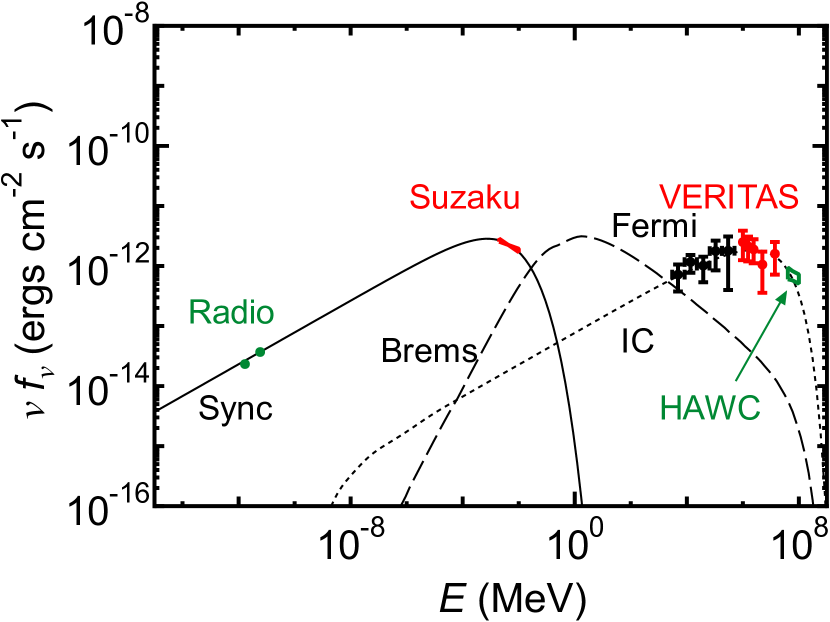
We note that a pure leptonic model can also reproduce the observed SED if we ignore the difference of spatial distributions between gamma rays and other emissions (Figure 4). Assuming that , we obtain , TeV, , and . This means that it is difficult to reject pure leptonic models with one-zone approaches based on the current observational data. However, the difference of the spatial distributions we found shows that the source of the gamma rays is distinguished from that of the radio and X-ray emissions. This supports the idea that the gamma ray is of hadronic origin and that G106.3+2.7 is a PeVatron.
5.2 Origin of the Nonthermal Emissions
Our Suzaku observations show that the diffuse nonthermal X-ray emission is bright around PSR J2229+6114 (section 5.1) and the photon index is almost the same among the three fields (Table 2). These suggest that high-energy electrons ( TeV) are accelerated at the pulsar and they are not affected by radiative cooling before they reach the West field. The synchrotron cooling time of the electrons is given by
| (4) |
and is much shorter than the characteristic age of PSR J2229+6114 ( kyr; Halpern et al. 2001a). The short cooling time suggests that the electrons need to travel fairly fast around the pulsar. This is the same for other old pulsars (Uchiyama et al., 2009; Bamba et al., 2010).
We assume that G106.3+2.7 and PSR J2229+6114 originate from the same supernova explosion and that the electrons propagate through diffusion. The diffusion coefficient of CR particles is given by
| (5) |
where and is the reduction factor (Fujita et al., 2009; Gabici et al., 2009). We assume that equation (5) can be applied to both CR electrons and protons because the diffusion is probably caused by magnetic fluctuations and the gyroradius of relativistic particles does not depend on their mass explicitly. The reduction factor may be associated with the amplification of the magnetic fluctuations (e.g. Fujita et al., 2010, 2011). The characteristic length scale that a diffusing particle of energy travels in time is given by . The apparent distance between PSR J2229+6114 and the West field is pc. Thus, for TeV and , the electrons can travel the distance without cooling if . The lower limit is comparable to the typical one estimated around SNRs (; Fujita et al. 2009). Similar values of could be applied to other pulsars that are not affected by cooling (Uchiyama et al., 2009; Bamba et al., 2010).
Albert et al. (2020) suggested that high-energy protons that are responsible for the gamma-ray emission might be accelerated by the SNR G106.3+2.7. Since the high-energy protons are likely to be accelerated in the very early phase of SNR evolution (e.g. Ptuskin & Zirakashvili, 2005), they must have been confined around the SNR to the present. Assuming that TeV, , and kyr, the proton diffusion length is pc for and it is much larger than the size of the gamma-ray emitting region ( pc). This means that the protons are not confined. Thus, the SNR shock may not be the origin of the protons unless the age is much smaller than 10 kyr. However, this problem may be solved if the gamma-ray emitting cloud is three-dimensionally separated from the synchrotron emitting region and the protons accelerated by the SNR have been trapped in the cloud with an extremely small diffusion coefficient.
Another candidate of the accelerator of the CR protons is PSR J2229+6114 or its PWN (Xin et al. 2019, see also Cheng et al. 1990; Bartko & Bednarek 2008; Guépin et al. 2020). If this is the case, the protons may propagate from the pulsar in the southwest direction in the same way as electrons. Some of them hit the molecular cloud and create the observed gamma rays. However, even if 10% of the spin-down luminosity of the pulsar () is consumed to accelerate protons and all of the protons enter the molecular cloud, the protons have to be confined for kyr to explain the total proton energy in the molecular cloud (). This cannot be realized if we assume the diffusion coefficient discussed above. Thus, we may need to consider some more complicated scenarios (e.g. Bao & Chen, 2021). For example, the interaction between the PWN and the SNR may reaccelerate the CRs (Ohira et al., 2018). Interestingly, another PeVatron candidate HAWC J1825-134 is also associated with two powerful pulsars (Albert et al., 2021).
We note that Kothes et al. (2006) indicated that the radio spectral index of the “Boomerang” PWN of PSR J2229+6114 (Figure 1) is (). The spectrum is much fatter than that of the overall SNR represented by the tail (–0.7; Pineault & Joncas 2000). The radio spectrum of the PWN becomes steeper at larger radii, which may reflect synchrotron cooling (Kothes et al., 2006). In this case, this synchrotron component should disappear outside the cooling radius that is about the size of the PWN (; Halpern et al. 2001b). Since the radio tail extends much beyond the PWN, it seems to be a different component from the PWN. The CR electrons that are associated with the radio and X-ray emissions from the tail may have directly diffused out of the pulsar. It is unlikely that they were accelerated by the SNR when it was young considering the age ( kyr) and the short cooling time of the electrons (equation (4)). Thus, another possibility is that they are currently accelerated in situ, although there is no clear shock-like structure in the middle-aged SNR G106.3+2.7.
6 Summary
We have analyzed the Suzaku XIS data of the SNR G106.3+2.7. We discovered diffuse X-ray emission and found that the brightness increases toward the pulsar PSR J2229+6114. While this trend is the same as that of the radio emission, it is different from that of gamma-ray emission concentrated on a molecular cloud. The X-ray emission can be represented by either thermal or nonthermal processes. However, since the extremely small metal abundance indicated by the thermal model is unrealistic, the emission seems to be nonthermal synchrotron. We found that the photon index of the nonthermal X-ray emission does not change with the distance from the pulsar. This means that the parent electrons are not affected by cooling and their diffusion is not very slow. The parent protons of the gamma-ray emission may be tightly confined in the cloud separately from the diffusing electrons.
References
- Abdo et al. (2007) Abdo, A. A., Allen, B., Berley, D., et al. 2007, ApJ, 664, L91, doi: 10.1086/520717
- Abdo et al. (2009) Abdo, A. A., Allen, B. T., Aune, T., et al. 2009, ApJ, 700, L127, doi: 10.1088/0004-637X/700/2/L127
- Acciari et al. (2009) Acciari, V. A., Aliu, E., Arlen, T., et al. 2009, ApJ, 703, L6, doi: 10.1088/0004-637X/703/1/L6
- Albert et al. (2020) Albert, A., Alfaro, R., Alvarez, C., et al. 2020, ApJ, 896, L29, doi: 10.3847/2041-8213/ab96cc
- Albert et al. (2021) —. 2021, ApJ, 907, L30, doi: 10.3847/2041-8213/abd77b
- Arnaud (1996) Arnaud, K. A. 1996, in Astronomical Society of the Pacific Conference Series, Vol. 101, Astronomical Data Analysis Software and Systems V, ed. G. H. Jacoby & J. Barnes, 17
- Bamba et al. (2010) Bamba, A., Anada, T., Dotani, T., et al. 2010, ApJ, 719, L116, doi: 10.1088/2041-8205/719/2/L116
- Bao & Chen (2021) Bao, Y., & Chen, Y. 2021, arXiv e-prints, arXiv:2103.01814. https://arxiv.org/abs/2103.01814
- Bartko & Bednarek (2008) Bartko, H., & Bednarek, W. 2008, MNRAS, 385, 1105, doi: 10.1111/j.1365-2966.2008.12870.x
- Cheng et al. (1990) Cheng, K. S., Cheung, T., Lau, M. M., Yu, K. N., & Kwok, P. W. 1990, Journal of Physics G Nuclear Physics, 16, 1115, doi: 10.1088/0954-3899/16/7/022
- Fang & Zhang (2008) Fang, J., & Zhang, L. 2008, MNRAS, 384, 1119, doi: 10.1111/j.1365-2966.2007.12766.x
- Fujita et al. (2010) Fujita, Y., Ohira, Y., & Takahara, F. 2010, ApJ, 712, L153, doi: 10.1088/2041-8205/712/2/L153
- Fujita et al. (2009) Fujita, Y., Ohira, Y., Tanaka, S. J., & Takahara, F. 2009, ApJ, 707, L179, doi: 10.1088/0004-637X/707/2/L179
- Fujita et al. (2011) Fujita, Y., Takahara, F., Ohira, Y., & Iwasaki, K. 2011, MNRAS, 415, 3434, doi: 10.1111/j.1365-2966.2011.18980.x
- Gabici et al. (2009) Gabici, S., Aharonian, F. A., & Casanova, S. 2009, MNRAS, 396, 1629, doi: 10.1111/j.1365-2966.2009.14832.x
- Ge et al. (2020) Ge, C., Liu, R.-Y., Niu, S., Chen, Y., & Wang, X.-Y. 2020, arXiv e-prints, arXiv:2012.11531. https://arxiv.org/abs/2012.11531
- Guépin et al. (2020) Guépin, C., Cerutti, B., & Kotera, K. 2020, A&A, 635, A138, doi: 10.1051/0004-6361/201936816
- Halpern et al. (2001a) Halpern, J. P., Camilo, F., Gotthelf, E. V., et al. 2001a, ApJ, 552, L125, doi: 10.1086/320347
- Halpern et al. (2001b) Halpern, J. P., Gotthelf, E. V., Leighly, K. M., & Helfand, D. J. 2001b, ApJ, 547, 323, doi: 10.1086/318361
- HI4PI Collaboration et al. (2016) HI4PI Collaboration, Ben Bekhti, N., Flöer, L., et al. 2016, A&A, 594, A116, doi: 10.1051/0004-6361/201629178
- Ishisaki et al. (2007) Ishisaki, Y., Maeda, Y., Fujimoto, R., et al. 2007, PASJ, 59, S113. https://arxiv.org/abs/astro-ph/0610118
- Joncas & Higgs (1990) Joncas, G., & Higgs, L. A. 1990, A&AS, 82, 113
- Kamae et al. (2006) Kamae, T., Karlsson, N., Mizuno, T., Abe, T., & Koi, T. 2006, ApJ, 647, 692, doi: 10.1086/505189
- Karlsson & Kamae (2008) Karlsson, N., & Kamae, T. 2008, ApJ, 674, 278, doi: 10.1086/524353
- Kelner et al. (2006) Kelner, S. R., Aharonian, F. A., & Bugayov, V. V. 2006, Phys. Rev. D, 74, 034018, doi: 10.1103/PhysRevD.74.034018
- Kothes et al. (2006) Kothes, R., Reich, W., & Uyanıker, B. 2006, ApJ, 638, 225, doi: 10.1086/498666
- Kothes et al. (2001) Kothes, R., Uyaniker, B., & Pineault, S. 2001, ApJ, 560, 236, doi: 10.1086/322511
- Koyama et al. (2007) Koyama, K., Tsunemi, H., Dotani, T., et al. 2007, PASJ, 59, 23, doi: 10.1093/pasj/59.sp1.S23
- Kushino et al. (2002) Kushino, A., Ishisaki, Y., Morita, U., et al. 2002, PASJ, 54, 327, doi: 10.1093/pasj/54.3.327
- Liu et al. (2020) Liu, S., Zeng, H., Xin, Y., & Zhu, H. 2020, ApJ, 897, L34, doi: 10.3847/2041-8213/ab9ff2
- Lodders et al. (2009) Lodders, K., Palme, H., & Gail, H. P. 2009, LanB, 4B, 712, doi: 10.1007/978-3-540-88055-4_34
- Moskalenko et al. (2006) Moskalenko, I. V., Porter, T. A., & Strong, A. W. 2006, ApJ, 640, L155, doi: 10.1086/503524
- Nasa High Energy Astrophysics Science Archive Research Center (2014) (Heasarc) Nasa High Energy Astrophysics Science Archive Research Center (Heasarc). 2014, HEAsoft: Unified Release of FTOOLS and XANADU. http://ascl.net/1408.004
- Ohira et al. (2018) Ohira, Y., Kisaka, S., & Yamazaki, R. 2018, MNRAS, 478, 926, doi: 10.1093/mnras/sty1159
- Pineault & Joncas (2000) Pineault, S., & Joncas, G. 2000, AJ, 120, 3218, doi: 10.1086/316863
- Ptuskin & Zirakashvili (2005) Ptuskin, V. S., & Zirakashvili, V. N. 2005, A&A, 429, 755, doi: 10.1051/0004-6361:20041517
- Sabol & Snowden (2019) Sabol, E. J., & Snowden, S. L. 2019, sxrbg: ROSAT X-Ray Background Tool. http://ascl.net/1904.001
- Tawa et al. (2008) Tawa, N., Hayashida, K., Nagai, M., et al. 2008, PASJ, 60, S11. https://arxiv.org/abs/0803.0616
- Taylor et al. (2003) Taylor, A. R., Gibson, S. J., Peracaula, M., et al. 2003, AJ, 125, 3145, doi: 10.1086/375301
- Uchiyama et al. (2009) Uchiyama, H., Matsumoto, H., Tsuru, T. G., Koyama, K., & Bamba, A. 2009, PASJ, 61, S189, doi: 10.1093/pasj/61.sp1.S189
- Xin et al. (2019) Xin, Y., Zeng, H., Liu, S., Fan, Y., & Wei, D. 2019, ApJ, 885, 162, doi: 10.3847/1538-4357/ab48ee
- Yamaguchi et al. (2006) Yamaguchi, H., Nakajima, H., Koyama, K., et al. 2006, Proc. SPIE, 6266, 626642, doi: 10.1117/12.672183
- Yoshino et al. (2009) Yoshino, T., Mitsuda, K., Yamasaki, N. Y., et al. 2009, PASJ, 61, 805. https://arxiv.org/abs/0903.2981