Raman Spectroscopy and Aging of the Low-Loss Ferrimagnet Vanadium Tetracyanoethylene
Abstract
Vanadium tetracyanoethylene (V[TCNE]x, ) is an organic-based ferrimagnet with a high magnetic ordering temperature , low magnetic damping, and growth compatibility with a wide variety of substrates. However, similar to other organic-based materials, it is sensitive to air. Although encapsulation of V[TCNE]x with glass and epoxy extends the film lifetime from an hour to a few weeks, what is limiting its lifetime remains poorly understood. Here we characterize encapsulated V[TCNE]x films using confocal microscopy, Raman spectroscopy, ferromagnetic resonance and SQUID magnetometry. We identify the relevant features in the Raman spectra in agreement with ab initio theory, reproducing vibrational modes. We correlate changes in the effective dynamic magnetization with changes in Raman intensity and in photoluminescence. Based on changes in Raman spectra, we hypothesize possible structural changes and aging mechanisms in V[TCNE]x. These findings enable a local optical probe of V[TCNE]x film quality, which is invaluable in experiments where assessing film quality with local magnetic characterization is not possible.
I Introduction
In the field of coherent magnonics, where function is derived through the creation and manipulation of long-lived spin wave modes, yttrium iron garnet (YIG) is the prototype material due to its exceptionally low damping at room temperature. However, it is difficult to integrate with other materials, requiring deposition on a lattice matched substrate, e.g. gadolinium gallium garnet, and a synthesis temperature above 800∘C Hauser2016 ; Sun2012 ; Liu2014 . In comparison, vanadium tetracyanoethylene (V[TCNE]x, ) is a low loss organic-based material with intrinsic damping comparable to YIG, and it can be grown as a film with chemical vapor deposition at a mild temperature (50∘C) and on nearly arbitrary substrates Yu2014 ; Zhu2016 . Furthermore, V[TCNE]x can be patterned using electron-beam lithography lift-off techniques while retaining its low magnetic loss Franson2019 . Hence it is an attractive alternative for magnonics. In particular, it is a candidate for coupling spin wave modes to isolated defect centers vanderSar2015 ; Andrich2017 ; Candido2020 ; Bertelli2020 . The ability to shape magnon modes with small volumes allows the realization of strong defect spin-magnon coupling Candido2020 .
A practical challenge in working with V[TCNE]x is that, like many organic-based and monolayer materials, it is air sensitive. The recent development of encapsulation techniques, similar to those used to protect organic light emitting diodes (OLEDs) Choi2008 ; Chwang2003 ; Subbarao2010 ; Grover2011 , can extend its lifetime at room temperature and in ambient atmosphere from an hour to a few weeks Froning2015 . However, the limitations in the lifetime of V[TCNE]x and its associated aging mechanisms are not well understood. For example, one aging mechanism is the chemical reaction with oxygen and water, which turns a V[TCNE]x film from blue-green opaque to transparent Froning2015 . This is not the only mechanism, as evidenced by aging observed in samples stored in an argon glove box and the slow change in the magnetic properties of encapsulated samples that remain opaque. Another piece of evidence is the slowing down of aging when the sample is stored at low temperature (-30∘C) in argon, suggesting an internal change being the next dominant aging mechanism.
First we study accelerated aging through laser heating, which provides a clean condition where reactions with oxygen and water are absent. Studying sample response to high intensity laser illumination is also of particular relevance to proposed quantum interfaces between spin waves and isolated defects, which are probed with a focused laser beam. We observe a nonlinear dependence of laser damage on optical power, which is consistent with a heating-based laser damage mechanism. Instead of being merely a nuisance, this local laser damage opens up a new avenue of V[TCNE]x patterning, which is an alternative to electron-beam patterning Franson2019 . We show preliminary results on laser patterning of V[TCNE]x and discuss its resolution limit.
To better deploy V[TCNE]x outside of a pristine environment, e.g. inert atmosphere, we need a better understanding of its aging mechanisms. V[TCNE]x is amorphous with a local structural order Haskel2004 , making Raman spectroscopy an effective method for studying its structural properties locally, at the micron scale. In addition to this optical probe, we concurrently measure magnetic properties using ferromagnetic resonance (FMR) and superconducting quantum interference device (SQUID) magnetometry to correlate changes in chemical properties with changes in magnetic properties.
The paper is structured as follows. We first describe sample fabrication and then explain the measurement procedures for confocal microscopy, micro-focused Raman spectroscopy, FMR, and SQUID magnetometry. Next, we characterize V[TCNE]x using the above methods. In particular, we show Raman spectra and explain the associated vibrational modes and their relation to chemical structure. Next we study laser damage in detail, monitoring how photoluminescence and Raman spectra change with laser exposure. We show proof-of-concept patterning examples using laser damage to selectively remove magnetism. After measuring the optical and magnetic properties of pristine V[TCNE]x, we next study its aging by monitoring how the above properties change in time. In particular, we observe aged samples are more susceptible to laser damage. We also identify Raman peaks observed in pristine samples which are absent in aged or laser damaged samples.
II Methods
II.1 Sample growth
V[TCNE]x films are grown by chemical vapor deposition, similar to previous reports Yu2014 . We examine 4 samples in the main text. The first sample (sample 1) is a uniform 400 nm V[TCNE]x film with 73 nm of aluminum deposited with an evaporator, encapsulated with epoxy and a glass cover slip. V[TCNE]x thickness is estimated from growth time. The aluminum layer is designed to prevent the laser light from exciting epoxy, ensuring we are only probing V[TCNE]x Raman spectra and photoluminescence.
Sample 2 is a 1.6 m thick sample. Sample 3 and 4 are 400 nm thick samples grown in the same batch. All three samples are encapsulated with glass and epoxy only.
II.2 Ab initio calculations
The electronic structure and phonon modes of V[TCNE]x are calculated using the Vienna ab initio Simulation Package (VASP) (version 5.4.4) with a plane wave basis and projector-augmented-wave pseudopotentials Kresse1993 ; Kresse1994 ; Kresse1996 ; KressePRB1996 . These pseudopotentials use the generalized gradient approximation (GGA) of Perdew, Burke, and Ernzerhof (PBE) Perdew1996 . A Hubbard constant U=4.19, determined via a linear response method Cococcioni2005 , was used in the phonon calculations. The hybrid functional Heyd–Scuseria–Ernzerhof (HSE) Heyd2003 with the standard range separation parameter =0.2 was also tested for this system and showed consistent results with the PBE+U approach.
II.3 Optical and Magnetic Measurements
Optical measurements including micro-focused Raman spectroscopy and photoluminescence are performed in a homebuilt confocal microscope with a 532 nm continuous wave laser. Integrated light collected from the sample is detected using a single photon counting module, whereas Raman spectra are recorded using a Princeton Instruments spectrometer and low dark count camera.
We measure angle-resolved, field modulated FMR in a homebuilt spectrometer. The setup consists of a microwave signal generator, an electromagnet, a pair of modulation coils, a microwave diode detector and a lock in amplifier. Film magnetization is measured using a Quantum Design MPMS 3 SQUID magnetometer. Applied magnetic field is in plane.
III Raman spectroscopy
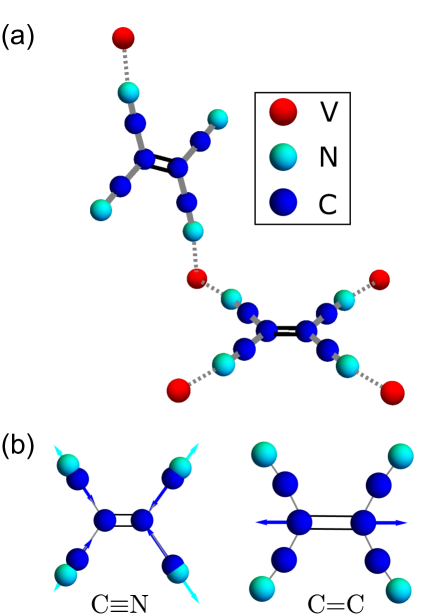
We measure Raman spectra to characterize V[TCNE]x chemical bonds and structure. To better understand the Raman spectrum, we also perform density functional theory (DFT) calculations using VASP code. We show the calculated V[TCNE]x structure in figure 1(a), where the geometry agrees with previous DFT studies Fusco2009 ; Cimpoesu2014 ; Frecus2014 . In figure 2, we plot the experimental Raman spectrum with DFT phonon density of states. Based on comparison with DFT calculations, we assign 1300-1500 Raman peaks to stretching modes, and 2200 Raman peaks to stretching modes. Example vibrational modes are shown in figure 1(b), displaying modes with dominant or bond stretching.
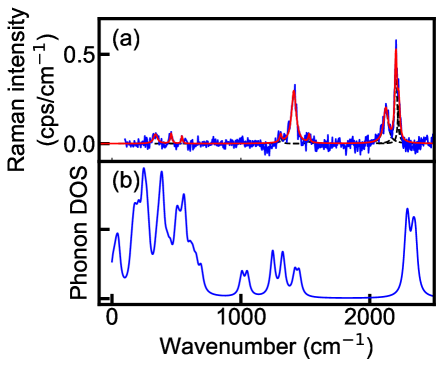
Next, we explain the fine Raman features and compare them with previous studies. Fine features near 2202, 2225 are in agreement with previous IR studies 2194, 2214 Froning2015 ; Pokhodnya2000 . We observe 2121 in Raman spectroscopy, while previous IR spectroscopy only observed a peak at 2155 Froning2015 , which could be explained by different IR and Raman activities of these vibrational modes. The Raman peaks at 1308, 1411, 1530 are absent in IR spectrum, suggesting vanadium atoms are more symmetrically bonded to the center bond, leading to low IR activity Pokhodnya2000 . We attribute low wavenumber peaks at 336, 457, 543 to low energy TCNE vibration modes and stretching modes.
Here we have characterized Raman spectra of pristine encapsulated V[TCNE]x and assigned Raman peaks to particular vibrational modes. Low wavenumber modes are particularly relevant for magnetism as they are influenced by V–N bonds. In subsequent sections, we measure how these Raman peaks evolve under aging and laser heating induced damage, and show how Raman spectra could be used to assess film quality.
IV Photoluminescence and laser damage susceptibility
In the following section, we study laser damage in a pristine encapsulated V[TCNE]x film (sample 2). Using laser-induced damage allows us to study aging in the absence of oxygen and water. There is also independent interest in studying V[TCNE]x under focused laser intensity, in particular in relation to experiments coupling V[TCNE]x with defect centers Candido2020 . The goal here is to gain insights on the nature of aging and a quantitative measure of laser damage susceptibility. We note that the quantitative laser damage susceptibility is sample and encapsulation dependent and we focus on reproducible trends across samples and relative changes.
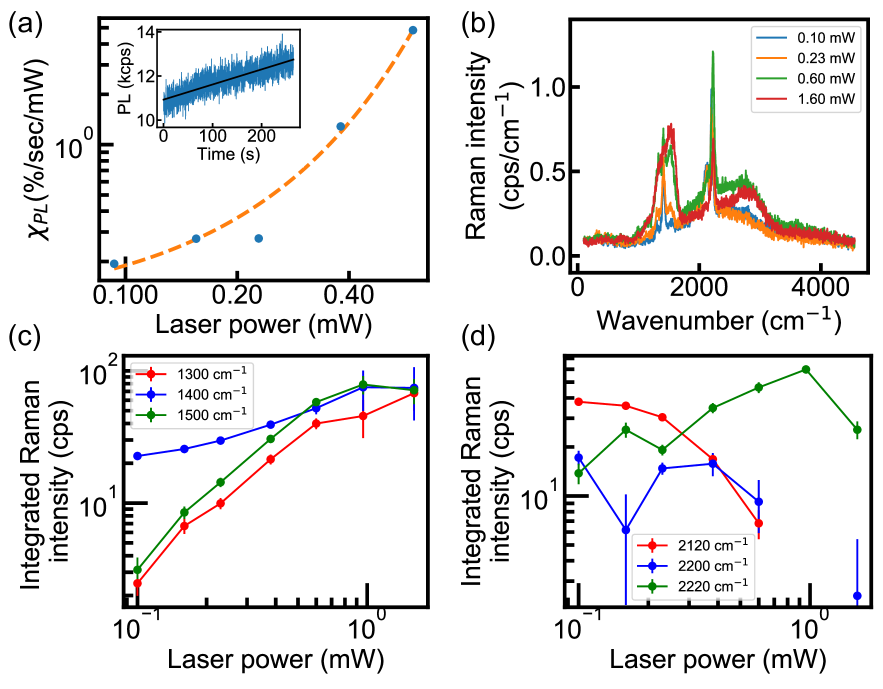
Because the laser light is tightly focused, local temperature can be large enough to cause degradation. Indeed, photoluminescence increases under continuous illumination, which is accompanied by the V[TCNE]x film turning transparent. Here we characterize laser damage susceptibility as the fractional rate of change in photoluminescence per unit optical power, namely
| (1) |
where is the photoluminescence, is the incident laser power. We linear fit the initial photoluminescence increase (Fig. 3(a) inset) and extract .
Laser damage susceptibility increases nonlinearly in optical power, with a threshold near 0.25 mW (Fig. 3(a)). A nonlinear laser damage susceptibility is consistent with a laser heating damage mechanism. While the temperature rise is proportional to laser power, chemical reaction rates increase nonlinearly with temperature, causing more rapid aging at a high optical power.
Next we quantify how laser damage alters the Raman spectra. All measurements are done in a local area 20 m 20 m, where the film is uniform. We successively illuminate different spots with different optical power for 4 minutes, and then measure Raman spectra with a low laser power (93 W) for 4 minutes, with a peak laser intensity . As the spot is exposed to higher laser power, the Raman intensity near 2121 decreases with a corresponding increase in the 2202, 2225 features (Fig. 3(b)). The side peaks at 1308, 1530 of C=C bond increase in intensity and linewidth. The lower wavenumber peaks disappear. In addition, the total fluorescence background increases with increasing laser power. The quantitative changes in Raman intensity are shown in figure 3(c,d). Focusing on qualitative features, the disappearance of low wavenumber () and the 2121 Raman peaks are clear, qualitative signatures of film aging. In particular, low wavenumber vibrational modes have significant V–N stretching components, therefore the disappearance of those peaks suggest a reduction in vanadium bonding to TCNE groups. Likewise, the 2121 Raman peak corresponds to a vibrational modes, which is sensitive to vanadium nitrogen bonding and is relevant for magnetic ordering in V[TCNE]x.
Instead of merely being a nuisance, laser damage could also be used for patterning with micron-scale spatial extent. We next explore using laser damage to pattern a V[TCNE]x film. If thermal degradation is nonlinear with local temperature rise, the attainable feature size could be much smaller than the diffraction limit Tong2016 .
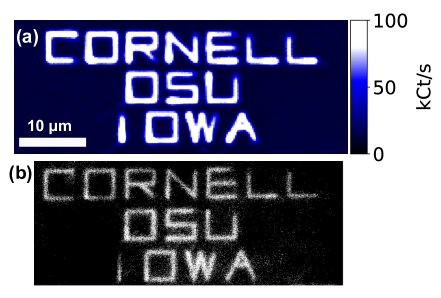
We show a proof-of-concept demonstration by laser patterning the authors’ affiliations on a V[TCNE]x film (Fig. 4(a)), where laser written area is damaged, producing a much higher photoluminescence rate. Based on the photoluminescence map and the optical image, the laser patterned feature size is on the order of 1 m. Note the photoluminescence map only measures optical properties, and the magnetic properties of laser patterned samples, e.g. magnetization profile, supported spin wave modes, will be the topic of a future study.
V Ferromagnetic resonance
We next measure the effective magnetization by angle-resolved FMR. The resonance frequency with an external field much greater than the effective field of the material () is Yu2014
| (2) |
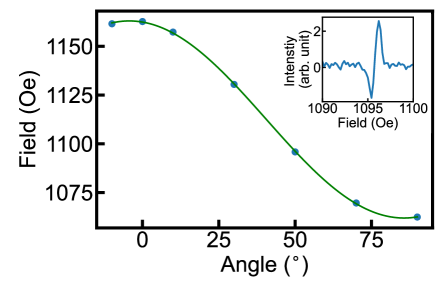
where is the gyromagnetic ratio, is the external magnetic field, is the angle of the external field with respect to the film normal, , which is a combination of the saturation magnetization and the anisotropy field. One possible origin of the anisotropy field is from strain due to differential thermal expansion of V[TCNE]x and the underlying substrate Chilcote2019 ; Yusuf2020 . In figure 5, we show a field-modulated FMR signal measured at 3 GHz. Fitting angle-resolved FMR, we extract an effective field . The FWHM linewidth is 1.1 Oe, which is comparable to previously reported values Franson2019 .
VI Aging
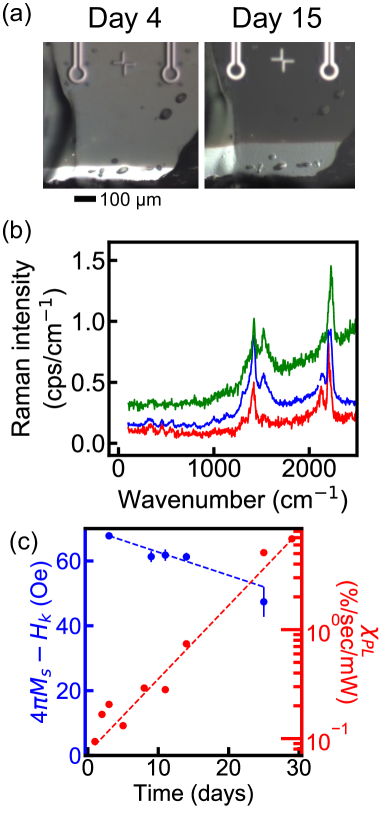
Having characterized pristine encapsulated V[TCNE]x, we next monitor its properties as it ages at room temperature in ambient atmosphere. First, we note a visual change in V[TCNE]x, beginning at the sample edge and propagating under the glass coverslip. This material is dark grey-black as deposited. As it ages, a transparency front propagates from the sample edges (Fig. 6(a)). We attribute this chemical change to reaction with diffused oxygen and water across the epoxy encapsulation barrier at sample edges.
In contrast, V[TCNE]x far from the edges does not show a strong color change with time, However, the lack of an apparent color change does not mean no changes occur. We next characterize sample photoluminescence and Raman spectra at the center of the sample and show how they change in time. Raman spectra show an increase in the fluorescence background and an increase in the Raman intensity near 1300 - 1500 as a function of time (Figure 6(b)). In addition, peaks near 1300, 1500 increase in Raman intensity compared to the center 1400 peak. Looking at an even longer timescale (89 days), the low wavenumber peaks (336, 457, 543 ) vanish, and the 2120 peak further diminishes. These features are qualitatively similar to those observed in laser damaged samples, with the strongest changes appearing in V–N and bonding. This suggests that the slow processes present in room temperature aging are similar to the chemical reactions accelerated by laser damage.
A more drastic signature of aging is an increase in laser damage susceptibility , which increases exponentially in time as the sample ages (Fig. 6(c)). Concurrently, the effective magnetization , as measured from angle-resolved FMR, decreases over time (Fig. 6(c)). This establishes a link between optical properties and magnetic properties, indicating optical measurements could be a local probe of V[TCNE]x film quality.
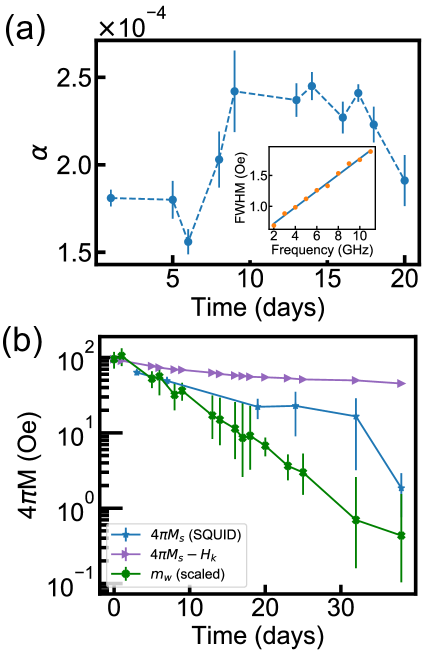
One limitation of the angle-resolved FMR is that it only measures an intensive quantity , which is a sum of shape anisotropy and other anisotropy, e.g. strain induced anisotropy Yusuf2020 . Moreover, it is not sensitive to the total magnetic moment of the sample. To disentangle these contributions and understand the total reduction of magnetic material, we monitor aging of another 400 nm thick V[TCNE]x film (sample 3) with SQUID magnetometry and FMR.
Here we compare 3 quantities, total magnetic moment measured by SQUID magnetometry, effective magnetization () and weighted total moment measured by angle-resolved FMR. Since and are extensive quantities while is an intensive quantity, we explain below in detail the measurement procedure for each quantity and how we compare them.
We compute saturation magnetization from SQUID magnetometry data by normalizing the total moment to the V[TCNE]x film volume. The volume has an uncertainty of up to 20%, which is dominated by the thickness uncertainty. This study lacks a direct measure of the sample thickness for each sample, and there is growth-to-growth variation in the nominal deposition rate as well as variation of growth rate across different positions in the growth chamber. Nonetheless, we are most interested in how changes in the aging process, which is less dependent on initial sample volume. We also note that the volume of ferrimagnetic V[TCNE]x is not constant as the sample ages due to the oxidation front that propagates from sample edge to center (see Fig. 6(a)), resulting in a 33% reduction in opaque area over 32 days. In figure 7(b), we plot the moment normalized to the initial V[TCNE]x volume. We denote this quantity as and we interpret it as a scaled total ferrimagnetic moment.
Next we discuss FMR measurements. We note the sample has a low loss fraction throughout the course of the experiment, with a Gilbert damping varies from to from day 1 to day 20 (Fig. 7(a)). We can unambiguously detect a resonance line shape and the typical uncertainty in is near 1 Oe. Because we measure FMR with field modulation, we are insensitive to high damping magnetic material, which will appear as a broad background.
This weighted moment is computed based on FMR signal strength. With a microwave drive below saturation and a low modulation field, the double integrated signal is proportional to total magnetic moment Poole1967 ; Wien2010 . For an absorption derivative line shape , this double integrated signal is proportional to the product of signal amplitude and FWHM . We normalize to microwave power and modulation amplitude (see SI) to compute , which is proportional to the magnetic moment. Because the sample (2450 m) is several times wider than the microwave waveguide (430 m), FMR sensitivity is non-uniform across the sample. Hence we note is a measure of weighted magnetic moment and is more sensitive to the sample portion closer to the microwave waveguide. Moreover, the sample has been remounted multiple times as we alternate between the SQUID and FMR setup, so the coupling between the V[TCNE]x film and the microwave waveguide varies, which contributes an uncertainty of nearly a factor of 2. With the above subtleties pointed out, we use FMR intensity to estimate weighted magnetic moment with low damping.
Over the course of the study (38 days), and reduces by nearly 2 orders of magnitude (Fig. 7(b)). In comparison, only changes from Oe to Oe. These findings suggest an aging process where the magnetic portion shrinks while remaining low damping. This is consistent with an aging front propagating from sample edge to center, where the center is relatively pristine. These measurements suggest intrinsic aging due to internal chemical reaction at room temperature does not increase damping significantly over 20 days.
To summarize the results of this section over several observations, we find a qualitative correlation between magnetic properties and optical properties of V[TCNE]x. Namely, a decrease in correlates with the disappearance of Raman features (300-600 ) involving V–N bonds and an increase in laser damage susceptibility. DC magnetometry, in combination with FMR, reveals non-uniform aging resulting in a large decrease in total magnetic moment. The combination of optical and magnetic measurements allow a comprehensive study of V[TCNE]x properties, relating change in chemical properties and magnetic properties.
VII Conclusion
We characterize pristine encapsulated V[TCNE]x thin films using confocal microscopy, micro-focused Raman spectroscopy, FMR and SQUID magnetometry. Through comparison with ab initio calculations, we associate the experimentally observed Raman peaks with particular stretching modes. We measure how the sample photoluminescence depends on laser power and observe that laser damage susceptibility has a nonlinear dependence on laser power, which is consistent with a heating based laser damage mechanism. We further explore laser damage as a means of patterning. Studying the spatial profile of laser damaged V[TCNE]x and their spin waves mode is a subject for future studies.
We identify changes in Raman features and laser damage susceptibility as sample ages. Low wavenumber (300-600 ) Raman features associated with V–N bonds vanish as sample ages, suggesting changes in bonding between vanadium and TCNE. These findings show that optical measurement is a local probe of V[TCNE]x film magnetic quality and could assess magnetic microstructure quality.
The existence of a narrow FMR response in encapsulated V[TCNE]x over 20 days under ambient conditions suggests that intrinsic aging (e.g. not oxidation) does not increase damping over this time interval. This is promising for coherent magnonics using V[TCNE]x microstructures that are positioned far from encapsulation edges. For quantum applications that use V[TCNE]x at cryogenic temperatures, one expects that the damping properties will be preserved over an even longer timescale.
VIII Acknowledgements
Optical Raman experiments, optical writing experiments, waveguide FMR studies of aging, first principles theory, and sample growth of aging study samples were supported by the US Department of Energy Office of Science, Office of Basic Energy Sciences under Award DE-SC0019250. Control sample growth and cavity FMR characterization, as well as growth of 2–4 year old samples were supported by NSF DMR-1808704 and DMR-1507775. We acknowledge use of the facilities of the Cornell Center for Materials Research, which is supported through the NSF MRSEC program (DMR-1719875), and the Cornell NanoScale Facility, which is a member of the National Nanotechnology Coordinated Infrastructure and supported the NSF (NNCI-2025233). We acknowledge helpful discussions with Brendan McCullian. We thank Hong Tang and Na Zhu for providing 2–4 year old V[TCNE]x reference samples.
References
- [1] Christoph Hauser, Tim Richter, Nico Homonnay, Christian Eisenschmidt, Mohammad Qaid, Hakan Deniz, Dietrich Hesse, Maciej Sawicki, Stefan G. Ebbinghaus, and Georg Schmidt. Yttrium iron garnet thin films with very low damping obtained by recrystallization of amorphous material. Scientific Reports, 6(1):20827, Feb 2016.
- [2] Yiyan Sun, Young-Yeal Song, Houchen Chang, Michael Kabatek, Michael Jantz, William Schneider, Mingzhong Wu, Helmut Schultheiss, and Axel Hoffmann. Growth and ferromagnetic resonance properties of nanometer-thick yttrium iron garnet films. Applied Physics Letters, 101(15):152405, 2012.
- [3] Tao Liu, Houchen Chang, Vincent Vlaminck, Yiyan Sun, Michael Kabatek, Axel Hoffmann, Longjiang Deng, and Mingzhong Wu. Ferromagnetic resonance of sputtered yttrium iron garnet nanometer films. Journal of Applied Physics, 115(17):17A501, 2014.
- [4] H. Yu, M. Harberts, R. Adur, Y. Lu, P. Chris Hammel, E. Johnston-Halperin, and A. J. Epstein. Ultra-narrow ferromagnetic resonance in organic-based thin films grown via low temperature chemical vapor deposition. Applied Physics Letters, 105(1):012407, 2014.
- [5] Na Zhu, Xufeng Zhang, I. H. Froning, Michael E. Flatté, E. Johnston-Halperin, and Hong X. Tang. Low loss spin wave resonances in organic-based ferrimagnet vanadium tetracyanoethylene thin films. Applied Physics Letters, 109(8):082402, 2016.
- [6] Andrew Franson, Na Zhu, Seth Kurfman, Michael Chilcote, Denis R. Candido, Kristen S. Buchanan, Michael E. Flatté, Hong X. Tang, and Ezekiel Johnston-Halperin. Low-damping ferromagnetic resonance in electron-beam patterned, high-q vanadium tetracyanoethylene magnon cavities. APL Materials, 7(12):121113, 2019.
- [7] Toeno van der Sar, Francesco Casola, Ronald Walsworth, and Amir Yacoby. Nanometre-scale probing of spin waves using single electron spins. Nature Communications, 6(1):7886, Aug 2015.
- [8] Paolo Andrich, Charles F. de las Casas, Xiaoying Liu, Hope L. Bretscher, Jonson R. Berman, F. Joseph Heremans, Paul F. Nealey, and David D. Awschalom. Long-range spin wave mediated control of defect qubits in nanodiamonds. npj Quantum Information, 3(1):28, Jul 2017.
- [9] Denis Ricardo Candido, Greg D Fuchs, Ezekiel Johnston-Halperin, and Michael Flatté. Predicted strong coupling of solid-state spins via a single magnon mode. Materials for Quantum Technology, 2020.
- [10] Iacopo Bertelli, Joris J. Carmiggelt, Tao Yu, Brecht G. Simon, Coosje C. Pothoven, Gerrit E. W. Bauer, Yaroslav M. Blanter, Jan Aarts, and Toeno van der Sar. Magnetic resonance imaging of spin-wave transport and interference in a magnetic insulator. Science Advances, 6(46), 2020.
- [11] Myeon-Cheon Choi, Youngkyoo Kim, and Chang-Sik Ha. Polymers for flexible displays: From material selection to device applications. Progress in Polymer Science, 33(6):581 – 630, 2008.
- [12] Anna B. Chwang, Mark A. Rothman, Sokhanno Y. Mao, Richard H. Hewitt, Michael S. Weaver, Jeff A. Silvernail, Kamala Rajan, Michael Hack, Julie J. Brown, Xi Chu, Lorenza Moro, Todd Krajewski, and Nicole Rutherford. Thin film encapsulated flexible organic electroluminescent displays. Applied Physics Letters, 83(3):413–415, 2003.
- [13] S. P. Subbarao, M. E. Bahlke, and I. Kymissis. Laboratory thin-film encapsulation of air-sensitive organic semiconductor devices. IEEE Transactions on Electron Devices, 57(1):153–156, 2010.
- [14] Rakhi Grover, Ritu Srivastava, Omwati Rana, D. S. Mehta, and M. N. Kamalasanan. New organic thin-film encapsulation for organic light emitting diodes. Journal of Encapsulation and Adsorption Sciences, 01(02):23–28, 2011.
- [15] I. H. Froning, M. Harberts, Y. Lu, H. Yu, A. J. Epstein, and E. Johnston-Halperin. Thin-film encapsulation of the air-sensitive organic-based ferrimagnet vanadium tetracyanoethylene. Applied Physics Letters, 106(12):122403, 2015.
- [16] D. Haskel, Z. Islam, J. Lang, C. Kmety, G. Srajer, K. I. Pokhodnya, A. J. Epstein, and Joel S. Miller. Local structural order in the disordered vanadium tetracyanoethylene room-temperature molecule-based magnet. Phys. Rev. B, 70:054422, Aug 2004.
- [17] G. Kresse and J. Hafner. Ab initio molecular dynamics for liquid metals. Phys. Rev. B, 47:558–561, Jan 1993.
- [18] G. Kresse and J. Hafner. Ab initio molecular-dynamics simulation of the liquid-metal–amorphous-semiconductor transition in germanium. Phys. Rev. B, 49:14251–14269, May 1994.
- [19] G. Kresse and J. Furthmüller. Efficiency of ab-initio total energy calculations for metals and semiconductors using a plane-wave basis set. Computational Materials Science, 6(1):15 – 50, 1996.
- [20] G. Kresse and J. Furthmüller. Efficient iterative schemes for ab initio total-energy calculations using a plane-wave basis set. Phys. Rev. B, 54:11169–11186, Oct 1996.
- [21] John P. Perdew, Kieron Burke, and Matthias Ernzerhof. Generalized gradient approximation made simple. Phys. Rev. Lett., 77:3865–3868, Oct 1996.
- [22] Matteo Cococcioni and Stefano de Gironcoli. Linear response approach to the calculation of the effective interaction parameters in the method. Phys. Rev. B, 71:035105, Jan 2005.
- [23] Jochen Heyd, Gustavo E. Scuseria, and Matthias Ernzerhof. Hybrid functionals based on a screened coulomb potential. The Journal of Chemical Physics, 118(18):8207–8215, 2003.
- [24] Giulia C. De Fusco, Leonardo Pisani, Barbara Montanari, and Nicholas M. Harrison. Density functional study of the magnetic coupling in . Phys. Rev. B, 79:085201, Feb 2009.
- [25] Fanica Cimpoesu, Bogdan Frecus, Corneliu I. Oprea, Petre Panait, and Mihai A. Gîrţu. Disorder, exchange and magnetic anisotropy in the room-temperature molecular magnet v[tcne]x – a theoretical study. Computational Materials Science, 91:320 – 328, 2014.
- [26] Bogdan Frecus, Corneliu I. Oprea, Petre Panait, Marilena Ferbinteanu, Fanica Cimpoesu, and Mihai A. GîrŢu. Ab initio study of exchange coupling for the consistent understanding of the magnetic ordering at room temperature in v[tcne]x. Theoretical Chemistry Accounts, 133(5):1470, Mar 2014.
- [27] K. I. Pokhodnya, A. J. Epstein, and J. S. Miller. Thin-film v[tcne]x magnets. Advanced Materials, 12(6):410–413, 2000.
- [28] Quang Cong Tong, Dam Thuy Trang Nguyen, Minh Thanh Do, Mai Hoang Luong, Bernard Journet, Isabelle Ledoux-Rak, and Ngoc Diep Lai. Direct laser writing of polymeric nanostructures via optically induced local thermal effect. Applied Physics Letters, 108(18):183104, 2016.
- [29] Michael Chilcote, Megan Harberts, Bodo Fuhrmann, Katrin Lehmann, Yu Lu, Andrew Franson, Howard Yu, Na Zhu, Hong Tang, Georg Schmidt, and Ezekiel Johnston-Halperin. Spin-wave confinement and coupling in organic-based magnetic nanostructures. APL Materials, 7(11):111108, 2019.
- [30] Huma Yusuf, Michael Chilcote, Denis R. Candido, Seth W. Kurfman, Donley S. Cormode, Yu Lu, Michael E. Flatté, and Ezekiel Johnston-Halperin. Temperature dependent anisotropy and linewidth in the high-q ferrimagnet v(tcne)x, 2020.
- [31] Charles P. Poole. Electron spin resonance: a comprehensive treatise on experimental techniques. Interscience Publishers, New York, 1967.
- [32] Gareth R. Eaton, Sandra S. Eaton, David P. Barr, and Ralph Thomas Weber, editors. Quantitative EPR. Springer, Wien ; New York, 2010. OCLC: ocn310400817.
- [33] Hakan Urey. Spot size, depth-of-focus, and diffraction ring intensity formulas for truncated gaussian beams. Appl. Opt., 43(3):620–625, Jan 2004.
- [34] Princeton Instruments. IntelliCal FAQ, 9 2012.
- [35] Sung-June Baek, Aaron Park, Young-Jin Ahn, and Jaebum Choo. Baseline correction using asymmetrically reweighted penalized least squares smoothing. Analyst, 140:250–257, 2015.
- [36] C. Le Losq. Rampy.
- [37] G Kresse and J Hafner. Norm-conserving and ultrasoft pseudopotentials for first-row and transition elements. Journal of Physics: Condensed Matter, 6(40):8245–8257, oct 1994.
- [38] G. Kresse and D. Joubert. From ultrasoft pseudopotentials to the projector augmented-wave method. Phys. Rev. B, 59:1758–1775, Jan 1999.
- [39] Sangita S. Kalarickal, Pavol Krivosik, Mingzhong Wu, Carl E. Patton, Michael L. Schneider, Pavel Kabos, T. J. Silva, and John P. Nibarger. Ferromagnetic resonance linewidth in metallic thin films: Comparison of measurement methods. Journal of Applied Physics, 99(9):093909, 2006.
- [40] E. R. J. Edwards, A. B. Kos, M. Weiler, and T. J. Silva. A microwave interferometer of the michelson-type to improve the dynamic range of broadband ferromagnetic resonance measurements. IEEE Magnetics Letters, 8:1–4, 2017.
- [41] TJ Silva, HT Nembach, JM Shaw, B Doyle, K Oguz, K O’brien, and M Doczy. Characterization of magnetic nanostructures for spin-torque memory applications with macro-and micro-scale ferromagnetic resonance. In Characterization and Metrology for Nanoelectronics. Singapore: Pan Stanford Publishing, 2016.
- [42] Hoosung Lee. Rapid measurement of thermal conductivity of polymer films. Review of Scientific Instruments, 53(6):884–887, 1982.
- [43] Shouhang Li, Xiaoxiang Yu, Hua Bao, and Nuo Yang. High thermal conductivity of bulk epoxy resin by bottom-up parallel-linking and strain: A molecular dynamics study. The Journal of Physical Chemistry C, 122(24):13140–13147, 2018.
- [44] Quantum Design. Correcting for the Absolute Field Error using the Pd Standard, 3 2018. Rev. A0.
IX Supplemental Information
IX.1 Confocal measurement
V[TCNE]x samples are measured in a homebuilt confocal microscope with a 532 nm continuous wave laser filtered with a bandpass filter (Iridian 532 BPF, ZX000163). It is focused with a 50x, 0.7 NA objective (Olympus LCPLFLN50xLCD) on the sample. Reflection and fluorescence from the sample is collected and then filtered by a long pass filter (Iridian 532 LPF nano cutoff, ZX000850). This light is split between a silicon avalanche photodiode (Excelitas SPCM-AQRH-13-FC) and a spectrometer (Princeton Acton SP-2500, focal length 500 nm with a 300 g/mm grating) with a low dark count camera (PyLoN 100 BR).
An incident laser beam of 5 mm diameter illuminates the objective back aperture (5 mm diameter). At this truncation ratio, the diffraction limited beam diameter is 700 nm [33]. At a laser power 500 W, peak laser intensity is .
IX.2 Raman spectroscopy
The spectrometer is calibrated with IntelliCal wavelength source and intensity source [34]. Absolute Raman spectra wavelength accuracy is limited by excitation laser wavelength accuracy, which limits the Raman spectroscopy accuracy to 4-8 .
For samples that are more susceptible to laser damage, we reduce laser power and raster scan across 100 to reduce accumulated laser damage.
We remove cosmic rays from Raman spectra by removing data points that have counts higher than its neighbor above a threshold. The Raman baseline is fitt with asymmetrically reweighted penalized least squares smoothing [35] with the implementation in the Python module Rampy [36]. Processed Raman spectra are fitted with Lorentzian peaks.
IX.3 Ab initio calculations
The electronic structure and phonon modes of V[TCNE]x are calculated using the Vienna ab initio Simulation Package (VASP) (version 5.4.4) , which uses a plane-wave basis and pseudopotentials [17, 18, 19, 20]. The pseudopotentials we used are default options from VASP’s official PAW potential set, with 5 valance electrons per V, 4 valance electrons per C, and 5 valance electrons per N atom [37, 38].
These pseudopotentials use the generalized gradient approximation (GGA) of Perdew, Burke, and Ernzerhof (PBE) [21]. A PBE+U approach with U=4.19 was used in the phonon calculation; with U determined via a linear response method [22]. This approach is chosen as simple GGA calculations fail to capture the d-orbital behavior of the V atom in our electronic structure calculations. Hybrid functional Heyd–Scuseria–Ernzerhof (HSE) [23] with standard range separation parameter =0.2 was also tested for this system and showed consistent results with this PBE+U approach. For the rest of the calculation, we used 400 eV for the energy cutoff, and a -centered k-mesh sampling.
The geometry of V[TCNE]x is consistent with the work of De Fusco et al. [24]. The unit cell has a triclinic structure and consists of 1 V atom, 12 C atoms and 8 N atoms. The structure used in the phonon calculation is our own relaxed system under the same set of parameters.
IX.4 Ferromagnetic resonance
Sample 1 is placed on a 50 inner diameter loop antenna. A microwave signal is applied to the antenna with a signal generator (Anristu MG3692C). The reflected signal is routed by a circulator (Narda-MITEQ Model 4923, 2 - 4 GHz) to a diode detector (Herotek DHM185AB). We sweep the magnetic field at a fixed microwave frequency (3 GHz typical) and modulate an external field at a modulation frequency of 587 Hz. Detected power is fed into a lock in amplifier (Signal Recovery 7265) and detected at the modulation frequency.
Sample 3 is placed on a microstrip test board (Southwest Microwave B4003-8M-50). We launch microwave signal at one end and do lock in detection of the transmitted microwave power.
As the sample ages, we increase modulation field amplitude and microwave power to maintain a large enough signal to noise.
IX.5 FMR data analysis
The spectra are fitted with sums of Lorentzian derivatives, each having an absorptive and a dispersive part [39].
| (3) | ||||
| (4) |
where is the full-width at half-maximum of the Lorentzian.
In angle-resolved FMR, we fit with the following function, using set as free parameters.
| (5) |
where is the gyromagnetic ratio, is the effective magnetization, and is a constant offset between the real film normal with respect to the nominal film normal.
Next we explain the procedure of extracting the total magnetic moment from the FMR signal strength. The change in waveguide transmission parameter on magnetic resonance is [40, 41]
| (6) |
where is the film length along the transmission line, is the film thickness, is the characteristic impedance of the transmission line, and is the Gilbert damping. At a fixed resonance field, the absorption curve FWHM is . Hence the integrated area under the absorption curve with respect to external field is proportional to a weighted magnetic moment, independent of damping.
From the absorption derivative term , we extract an equivalent area as an estimate of the total magnetic moment.
We adjust for microwave power by normalizing the detected signal to microwave power () and the power-to-voltage conversion factor ((V/mW)) of the diode detector. Namely, the normalized signal is
| (7) |
In modulation detection, when modulation field is much smaller than linewidth, the lock in detected signal is proportional to a derivative of a Lorentzian absorption. When modulation field is comparable to linewidth, detected signal is no longer a simple derivative and we correct for that by modeling the line shape.
Note the FMR line shape has both an absorptive derivative and a dispersive derivative. Here we only use the absorptive derivative to extract the total magnetic moment.
IX.6 Laser heating
In this section, we estimate local temperature rise due to laser heating of a V[TCNE]x film grown on a glass substrate. We approximate the glass substrate thermal conductivity to be . We approximate V[TCNE]x and epoxy to have a similar thermal conductivity [42, 43].
Because the laser spot size (350 nm) is much smaller than the epoxy thickness (5-10 m), we model both the substrate and V[TCNE]x plus epoxy as semi-infinite. The temperature rise profile for a point heat source at the interface is
| (8) |
where , assuming temperature is fixed at 0 at infinity.
We model the actual heat source as a surface Gaussian heat source
| (9) |
where is the beam radius.
The maximum temperature rise occurs at the interface along the beam center,
| (10) |
At 0.7 NA, beam radius . 100 W of power causes a local temperature rise of 70 K.
A more realistic estimate takes into account of the finite absorption depth of V[TCNE]x, which is of the order 100-400 nm. As this is comparable to the beam size, the peak temperature rise is of the same order of magnitude.
IX.7 Long term aging
Visual inspection provides preliminary information on V[TCNE]x film quality, but it is neither a quantitative nor a definitive measure. While discolored V[TCNE]x is almost certainly aged, even fully opaque film can be magnetically inactive[15].
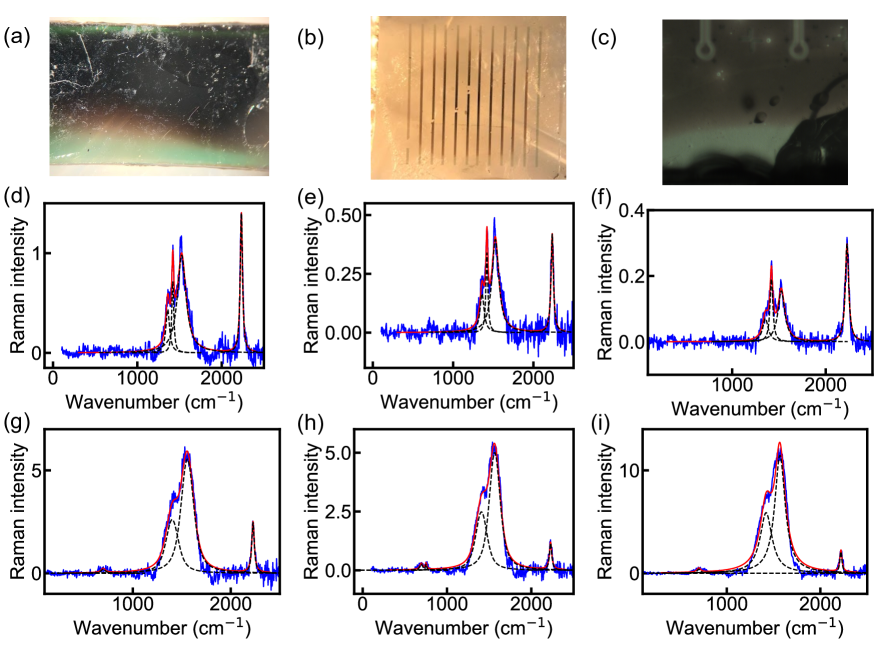
To better understand long term degradation, we examine 2 other V[TCNE]x samples. One is a 4 year old uniform film, the other is a 2 year old, patterned 100 wide bars. Both of them are nominal 1 m thick, estimated from growth time. Both of them are visually opaque and yet are magnetically inactive.
The samples show qualitatively similar peaks (Fig. 8), with 3 peaks near 1300-1500 and a single peak near 2200 . Under strong laser illumination, 3 peaks 1300-1500 merge into 2 peaks, and become brighter than the 2200 peak. Crucially, the spectra differ significantly from aged V[TCNE]x. Degraded samples don’t have low wavenumber peaks (300-600 ) and the small 2120 peak as seen in pristine samples, further supporting a link between these fine features with good magnetic properties.
IX.8 SQUID magnetometry
We measure a 400 nm thick V[TCNE]x film (sample 3) in a Quantum Design MPMS 3 SQUID magnetometer in the vibrating sample magnetometer (VSM) mode. The sample is mounted to a quartz holder with a small dab of GE varnish. We measure moment vs. field at 300 K in a four-quadrant sweep, from –20,000 Oe to +20,000 Oe back to –20,000 Oe. We use a palladium reference to correct for the absolute field error [44]. The applied field is in the plane of the V[TCNE]x film.
We normalize the measured magnetic moment to the initial film volume, which is estimated from the opaque film area (7.27 ) and the nominal film thickness 400 nm.
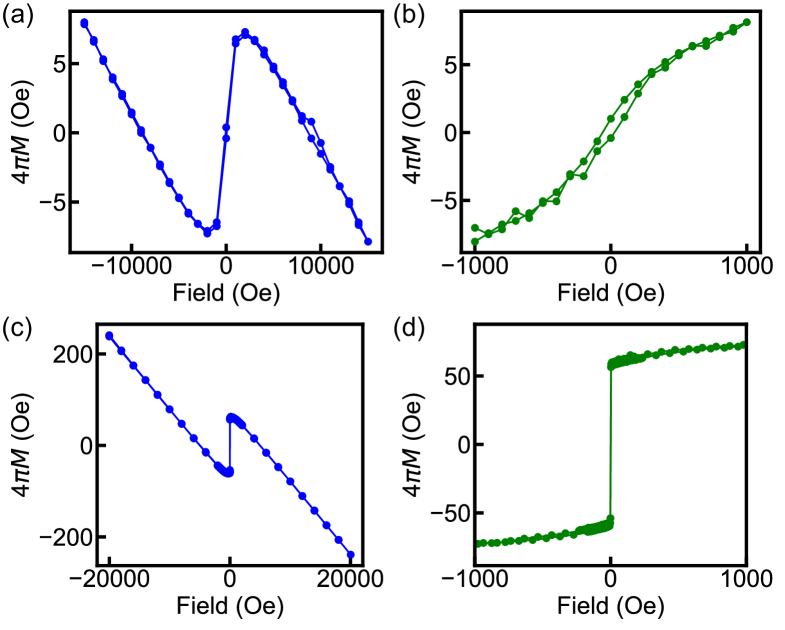
The magnetization vs. field data has a large diamagnetic background (Fig. 9(c)), which we subtracted away by fitting to a linear background at fields 2000 Oe. We also measure the magnetic response GE varnish, which has a small diamagnetic and ferromagnetic component (Fig. 9(a,b)). The magnetic moment of GE varnish is normalized to the same initial V[TCNE]x volume. Note that this is an equivalent V[TCNE]x magnetization error due to GE varnish background but not the physical GE varnish magnetization. As the amount of GE varnish applied in different runs varies, one cannot simply subtract a fixed background from the data. We note GE varnish has a gradual moment vs. field dependence over –1000 Oe to +1000 Oe (Fig. 9(b)). Because the applied field is in plane, V[TCNE]x should be close to fully magnetized at 200 Oe. Therefore, we estimate V[TCNE]x to be the magnetization at 200 Oe, where background magnetization is small. We estimate the uncertainty as the difference between magnetization at 200 Oe and 500 Oe.