A Lyman- PROTOCLUSTER AT REDSHIFT 6.9
Abstract
Protoclusters, the progenitors of the most massive structures in the Universe, have been identified at redshifts up to 6.6 [refs[1, 2, 3, 4, 5, 6]]. Besides exploring early structure formation, searching for protoclusters at even higher redshifts is particularly useful to probe the reionization. Here we report the discovery of the protocluster LAGER-7OD1 at redshift of 6.93, when the universe was only 770 million years old and could be experiencing rapid evolution of the neutral hydrogen fraction in the intergalactic medium[7, 8]. The protocluster is identified by an overdensity of 6 times the average galaxy density, and with 21 narrowband selected Ly galaxies, among which 16 have been spectroscopically confirmed. At redshifts similar to or above this record, smaller protogroups with fewer members have been reported[9, 10]. LAGER-7OD1 shows an elongated shape and consists of two sub-protoclusters, which would have merged into one massive cluster with a present-day mass of solar masses. The total volume of the ionized bubbles generated by its member galaxies is found to be comparable to the volume of the protocluster itself, indicating that we are witnessing the merging of the individual bubbles and that the intergalactic medium within the protocluster is almost fully ionized. LAGER-7OD1 thus provides a unique natural laboratory to investigate the reionization process.
CAS Key Laboratory for Research in Galaxies and Cosmology, Department of Astronomy, University of Science and Technology of China, Hefei, Anhui 230026, China; urverda@mail.ustc.edu.cn, jxw@ustc.edu.cn
School of Astronomy and Space Science, University of Science and Technology of China, Hefei 230026, China
Las Campanas Observatory, Carnegie Institution of Washington, Casilla 601, La Serena, Chile
Astrophysics Science Division, Goddard Space Flight Center, 8800 Greenbelt Road, Greenbelt, Maryland 20771, USA
CAS Key Laboratory for Research in Galaxies and Cosmology, Shanghai Astronomical Observatory, Shanghai 200030, China
Instituto de Astrofísica, Facultad de Física, Pontificia Universidad Católica de Chile, Santiago, Chile
School of Earth and Space Exploration, Arizona State University, Tempe, AZ 85287, USA
European Southern Observatory, Alonso de Cordova 3107, Casilla 19001, Santiago, Chile
Núcleo de Astronomía de la Facultad de Ingeniería y Ciencias, Universidad Diego Portales, Av. Ejército Libertador 441, Santiago, Chile
Community Science and Data Center/NSF’s NOIRLab, 950 N. Cherry Ave., Tucson, AZ 85719, USA
Cerro Tololo Inter-American Observatory, NSF’s NOIRLab, Casilla 603, La Serena, Chile
Purple Mountain Observatory, Chinese Academy of Sciences, Nanjing 210023, China
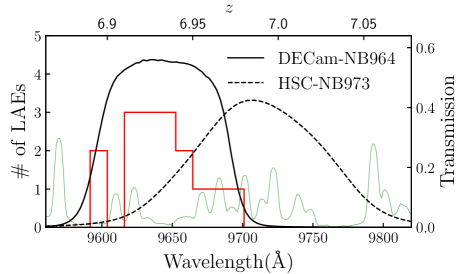
High redshift Lyman- (Ly)-emitting galaxies (LAEs) are star-forming galaxies with strong Ly lines, which can be effectively selected with narrowband imaging surveys[11, 12, 13]. Aiming to build a statistical sample of LAEs at redshift 7, we are carrying out a deep narrowband imaging survey, Lyman Alpha Galaxies in the Epoch of Reionization (LAGER), utilizing the Dark Energy Camera (DECam, with a field of view of deg2) on Cerro Tololo Inter-American Observatory (CTIO) Blanco 4m Telescope and a customized narrowband filter DECam-NB964. The central wavelength and full-width half-maximum of the filter are Å and 92 Å (see Fig. 1), corresponding to a redshift range of 6.89 – 6.97 and a line-of-sight (LOS) scale of 26 cMpc. See Methods for more details. In the LAGER COSMOS field, we obtained 47.25 hours narrowband exposure reaching a 5 detection limit of 25.2 magnitude and a Ly sensitivity of erg s-1. Combining the deep narrowband image with the ultra deep broadband images from the Hyper Suprime-Cam Subaru Strategic Program (HSC SSP), we uniformly selected 49 LAEs[13]. See Methods and papers[11, 13] (hereafter Z17 and H19, respectively) for more details about the LAE selection.
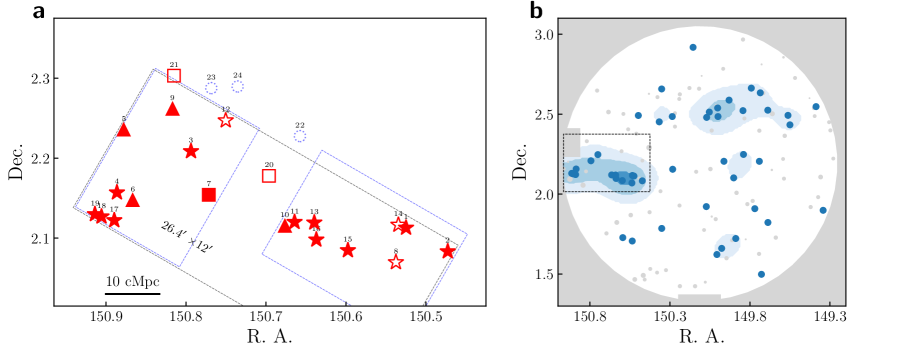
As narrowband imaging can constrain the redshift of LAEs to a very narrow range 0.1, corresponding to a line-of-sight (LOS) distance of 30 – 45 cMpc at – 8, it is also a promising approach to search for overdense structures, for example, protoclusters, in the early Universe[1, 2, 3, 4, 5, 6]. Fig. 2b shows the spatial distribution (blue circles) and number density (blue contours) of 49 LAGER LAEs in the whole COSMOS field as presented in H19. A high number density region (as marked by black dashed rectangle) is clearly revealed, containing 14 uniformly selected LAEs in H19 (see Suppl. Tab. 1 for the catalog). This overdense region (LAGER-7OD1) has a scale of , and a three-dimensional volume of cMpc3. We calculate the galaxy overdensity of LAGER-7OD1 following , where and are the average number densities of LAEs in the LAGER-7OD1 and the COSMOS field, respectively. We obtain the galaxy overdensity of LAGER-7OD1 to be , which indicates LAGER-7OD1 is a heavily overdense region, compared with the average galaxy number density. See Methods for more details. Up to now, candidate LAEs have been selected in four LAGER fields, that is COSMOS, CDFS, WIDE12, and GAMA15A (Z17, H19, Wold et al. in preparation). Among them, COSMOS is the unique one showing clear overdense region(s).
The same field was also observed with another narrowband filter HSC-NB973[12], the bandpass of which partially overlaps with that of DECam-NB964 (see Fig. 1). A hint of overdensity around LAGER-7OD1 is also visible among the HSC-NB973 selected LAEs[12], but not as strong as that seen in DECam-NB964. We stacked the DECam-NB964 image and HSC-NB973 image to improve the depth of the narrowband image and selected three more members of LAGER-7OD1. We also plot in Fig. 2a four more members, which were selected as lower-grade candidates (compared with those presented in H19) but were later spectroscopically confirmed (see next paragraph). Note these 7 additional member galaxies are only used to illustrate the spatial profile of LAGER-7OD1 (but not to calculate the overdensity), as they were not selected in a uniform and unbiased approach. See Methods for details.
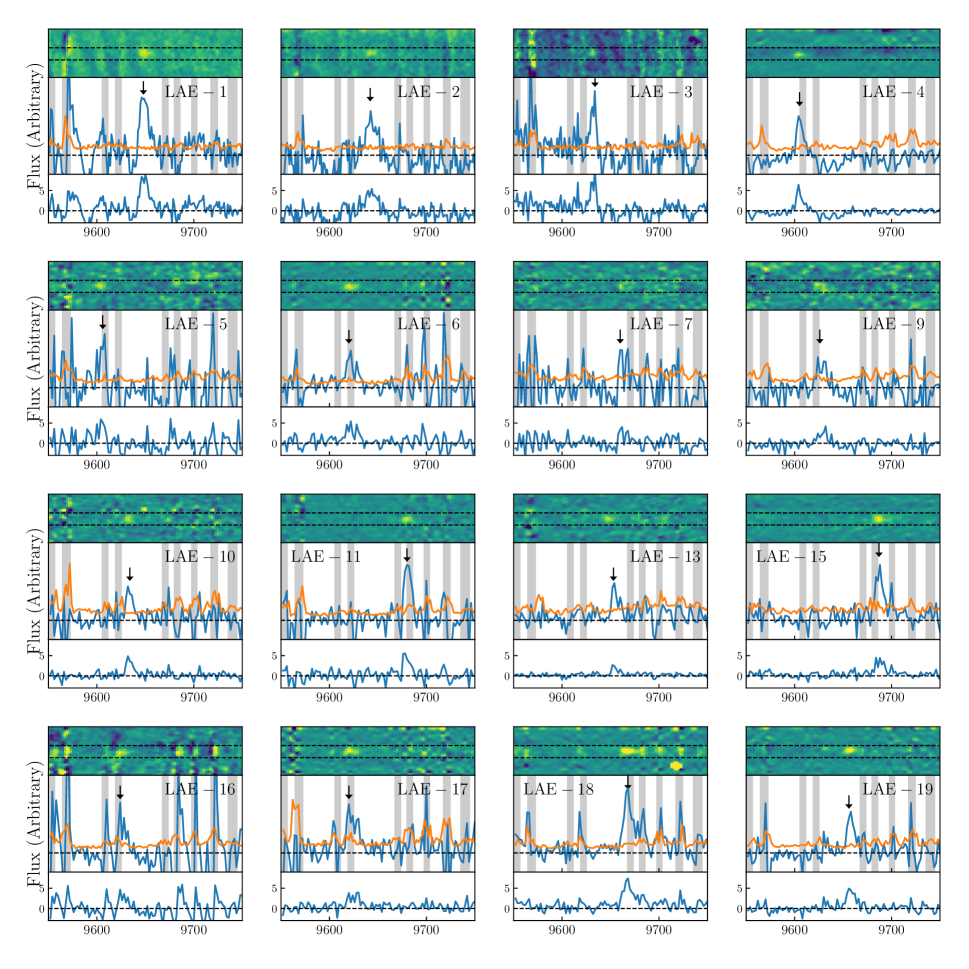
Spectroscopic observations have been conducted to confirm the member LAEs, measure their redshifts, and remove potential contaminants which may show continuum or emission lines at blueward of 9600 Å. Three members have been confirmed in a previous study[14]. We carried out new spectroscopic followups using the Inamori Magellan Areal Camera and Spectrograph (IMACS) at the 6.5m Magellan I Baade Telescope (Feb. 6-8, 2017 and Feb. 21-23, 2018), and the Low Dispersion Survey Spectrograph 3 (LDSS3) at the 6.5m Magellan II Clay Telescope (January 10-11 and December 29-31, 2019). The average seeing during the observations was . We carefully reduced the observed data and ruled out foreground identifications for member galaxies. Details of the data reduction are presented in Methods and a dedicated spectroscopic paper in preparation (along with identifications of LAEs outside of LAGER-7OD1 and in other fields). In total, we have obtained spectroscopic confirmations for 16 member LAEs (red solid symbols in Fig. 2a). Ly lines were not detected in three additional members which were put on masks, however we are unable to rule them out as their Ly lines might incidentally overlap with sky lines, or their Ly line width be too broad to be detected[14] ( 500 km s-1). The two- and one-dimensional spectra of the confirmed LAEs are presented in the Suppl. Fig. 1 and the redshift distribution in Fig. 1.
The scale ( cMpc3), overdensity (), and LOS velocity dispersion of spectroscopic confirmations ( km s-1) of our protocluster LAGER-7OD1 are similar to those of the previously detected protoclusters at redshift of 5.7 – 6.6 [refs[4, 5]] and simulation predictions[15, 16]. We estimate the total present-day cluster mass of LAGER-7OD1 following the widely used formula[16]: , where is the volume of the protocluster, ( cMpc-3) is the mean matter density of the universe, and the mass overdensity. is related to the observed galaxy overdensity through: , where is the bias parameter and the correction factor for the redshift space distortion. For at , we find and . The present-day mass of LAGER-7OD1 is estimated to be , comparable to the mass of nearby COMA cluster[17] (). See Methods for details.
The 3D distribution of the spectroscopic confirmations is shown in Fig. 3. LAGER-7OD1 shows an elongated shape and consists of two sub-protoclusters. The overdensities of two sub-protoclusters are (left) and (right), respectively, where the boundaries of the two substructures are defined as the blue squares in Fig 2. If we treat the two substructures as isolated, their present-day masses are expected to be and , respectively.
We further explore whether the protocluster LAGER-7OD1 would collapse into a single cluster. Similar to previous works[18, 19], we estimate the linear overdensity of LAGER-7OD1 to be at (Equation 18 of ref.[20]). As the growth of linear perturbation is proportional to , will be larger than the threshold at , where is the critical value of linear overdensity of a spherical perturbation at the time it collapses[21]. Thus, we expect LAGER-7OD1 collapses into a cluster at lower redshift. The discovery of LAGER-7OD1 indicates that the formation of such large-scale structure had already begun by redshift 7.0, making it an ideal laboratory for understanding galaxy formation and large-scale structure formation.
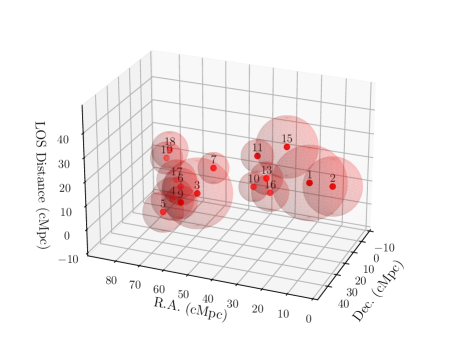
During the EoR, the hard UV photons that escaped from a galaxy could ionize the IGM and generate a HII region. The HII regions could gradually grow and merge with adjacent ones into sufficiently large ionized bubbles[10, 9, 22, 23], which can reduce resonant scattering of Ly photons in the neutral IGM[24, 25]. The protoclusters in the EoR may lead the production of such bubbles because of their high number density of galaxies. On the basis of the relation between the bubble size and Ly luminosity in a simulation of reionization work[26], we show the predicted bubbles in Fig. 3 and the bubble sizes in Suppl. Tab. 1. The summed volume of the ionized bubbles of all 21 LAEs is cMpc3, with the 4 most luminous ones (with erg s-1, i.e., LAE 1,2,3,15) contributing of the total ionized volume. This total ionized volume is even slightly larger than the volume of LAGER-7OD1 ( cMpc3). This demonstrates significant overlaps between individual bubbles, indicating the individual bubbles are in the act of merging into one or two giant bubbles (see Fig. 3). As a comparison, the total predicted volume of all the 49 uniformly selected LAEs in COSMOS field is cMpc3, corresponding to of the total volume surveyed by DECam-NB964. See Methods for details. Such predicted giant bubbles are large enough to be resolved by future 21-cm programs, e.g., SKA1-Low with resolution of arcmin at [ref.[27]], corresponding to cMpc.
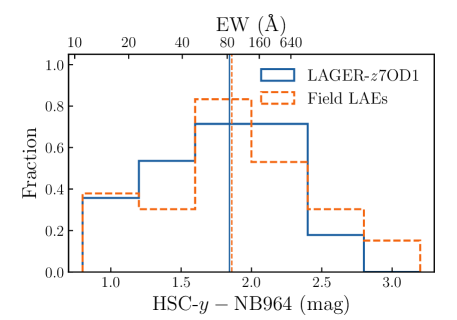
The merged bubble (with predicted size of cMpc) could significantly increase the IGM transmission, and thus enhance the Ly visibility of member LAEs[25]. Note Z17 and H19 have revealed a bright-end excess in the Ly luminosity function in COSMOS field, also suggesting the existence of big ionized bubbles at that reduce the opacity of neutral IGM around the luminous LAEs. Meanwhile, if the Ly transmission through the IGM has been significantly boosted in most LAEs in LAGER-7OD1, it may lead to larger Ly equivalent widths (EWs) of LAEs in the protocluster. However, the expected larger Ly EWs is not seen, compared with the field LAEs in COSMOS (see Methods and Extended Data Fig. 1 for details), though the large uncertainties in the EW measurements and the small sample size prevent us from reaching a robust conclusion. One possibility is that high-redshift protoclusters are highly biased regions and might contain LAEs with physical properties deviating substantially from the field LAEs[5, 28]. It is yet unclear if the intrinsic Ly escape (prior to IGM scattering) in clustered LAEs is the same as that in field LAEs.
Moreover, the expected excess of close companions due to potentially enhanced Ly transmission, in or behind the large bubbles of the luminous LAEs ( erg s-1, i.e., LAE 1,2,3,15), is not seen (see Fig. 2a and 3). This is likely in part due to the possibility that while the biased dark matter halos can increase the galaxy merger/interaction, and thus enhance the star formation in the overdense region[5, 29], the feedback from the UV background may suppress the star formation in the nearby fainter galaxies[30].
The discovery of the protocluster LAGER-7OD1 provides an excellent opportunity to probe the rise and merging of ionized bubbles around the midpoint of EoR. Future deep and multi-band (HST, JWST, ALMA, etc) observations could reveal the detailed reionization processes, e.g., through searching for undetected Ly fainter galaxies partially responsible for the ionization budget, better constraining the Ly line EWs and the Ly profiles, measuring the Ly velocity offsets relative to their system redshifts, and mapping the star formations histories of the galaxies.
should be addressed to W. Hu and J. Wang (e-mail: urverda@mail.ustc.edu.cn, jxw@ustc.edu.cn).
We appreciate the anonymous referees for the valuable comments and Zhen-Yi Cai, Zheng Cai, and Linhua Jiang for the informative discussions. The work is supported by National Science Foundation of China (grants No. 11421303 11890693 11773051 12022303), CAS Frontier Science Key Research Program (QYZDJ-SSW-SLH006), and CAS Pioneer Hundred Talents Program. US investigators on this work have been suppported by the US National Science Foundation through NSF grant AST-1518057; and NASA, through WFIRST Science Investigation Team contract NNG16PJ33C.
This project used the data obtained with the Dark Energy Camera (DECam), which was constructed by the Dark Energy Survey (DES), and public archival data from the Dark Energy Survey (DES).
Based on observations at Cerro Tololo Inter-American Observatory at NSF’s NOIRLab (NOIRLab Prop. ID: 2016A-0386, 2017B-0330; PI: Malhotra S.; CNTAC Prop. ID: 2016A-0610 ; PI: Infante L.), which is managed by the Association of Universities for Research in Astronomy (AURA) under a cooperative agreement with the National Science Foundation.
This work includes data collected at the 6.5m Magellan Telescopes located at Las Campanas Observatory, Chile. We thank the scientists and telescope operators at Magellan telescope for their help.
This paper makes use of software developed for the Large Synoptic Survey Telescope. We thank the LSST Project for making their code available as free software at http://dm.lsst.org
Based [in part] on data collected at the Subaru Telescope and retrieved from the HSC data archive system, which is operated by Subaru Telescope and Astronomy Data Center at National Astronomical Observatory of Japan.
Facilities: Magellan:Baade (IMACS), Magellan:Clay (LDSS3), Blanco (DECam), Subaru (HSC)
W.H. and J.W designed the layout of this paper. W.H. reduced the data, performed scientific analysis and wrote the manuscript. J.W. co-led the scientific interpretation and manuscript writing. L.I. led the observing proposals which yielded new spectroscopic identifications presented in this work. W.H., L.I., H.Y., J. G. & G.P. conducted these observations. All authors discussed the results and commented on the manuscript.
The authors declare that they have no competing financial interests.
The candidate selection is based on the following images in COSMOS field: DECam-NB964 (NOIRLab Prop. ID: 2016A-0386, 2017B-0330; CNTAC Prop. ID: 2016A-0610), HSC SSP program, and HSC-NB973 (Prop. ID: S16B-001I), which are available at http://archive1.dm.noao.edu/, https://hsc-release.mtk.nao.ac.jp/doc/, and https://hsc-release.mtk.nao.ac.jp/doc/index.php/chorus/, respectively. The spectroscopic datasets and the datasets generated or analysed during this study are available from the corresponding author upon reasonable request. The LAE catalog for LAGER-7OD1 used in this study has been published in the Supplementary Information.
Codes used in this study are not publicly released yet but are available from the corresponding author on reasonable request.
References
- [1] Ouchi, M. et al. The Discovery of Primeval Large-Scale Structures with Forming Clusters at Redshift 6. ApJ 620, L1–L4 (2005).
- [2] Wang, J. X., Malhotra, S. & Rhoads, J. E. An Overdensity of Ly Emitters at Redshift z5.7 near the Hubble Ultra Deep Field. ApJ 622, L77–L80 (2005).
- [3] Malhotra, S. et al. An overdensity of galaxies at z= 5.9 0.2 in the hubble ultra deep field confirmed using the ACS grism. ApJ 626, 666–679 (2005).
- [4] Jiang, L. et al. A giant protocluster of galaxies at redshift 5.7. Nat. Astron. 2, 962–966 (2018).
- [5] Harikane, Y. et al. SILVERRUSH. VIII. Spectroscopic Identifications of Early Large-scale Structures with Protoclusters over 200 Mpc at z 6–7: Strong Associations of Dusty Star-forming Galaxies. ApJ 883, 142 (2019).
- [6] Calvi, R. et al. MOS spectroscopy of protocluster candidate galaxies at z = 6.5. MNRAS 489, 3294–3306 (2019).
- [7] Robertson, B. E., Ellis, R. S., Furlanetto, S. R. & Dunlop, J. S. Cosmic Reionization and Early Star-forming Galaxies: A Joint Analysis of New Constraints from Planck and the Hubble Space Telescope. ApJ 802, L19 (2015).
- [8] Kulkarni, G. et al. Large Ly opacity fluctuations and low CMB in models of late reionization with large islands of neutral hydrogen extending to z 5.5. MNRAS 485, L24–L28 (2019).
- [9] Castellano, M. et al. Spectroscopic Investigation of a Reionized Galaxy Overdensity at z = 7. ApJ 863, L3 (2018).
- [10] Tilvi, V. et al. Onset of Cosmic Reionization: Evidence of an Ionized Bubble Merely 680 Myr after the Big Bang. ApJ 891, L10 (2020).
- [11] Zheng, Z.-Y. et al. First Results from the Lyman Alpha Galaxies in the Epoch of Reionization (LAGER) Survey: Cosmological Reionization at z 7. ApJ 842, L22 (2017).
- [12] Itoh, R. et al. CHORUS. II. Subaru/HSC Determination of the Ly Luminosity Function at z = 7.0: Constraints on Cosmic Reionization Model Parameter. ApJ 867, 46 (2018).
- [13] Hu, W. et al. The Ly Luminosity Function and Cosmic Reionization at z 7.0: A Tale of Two LAGER Fields. ApJ 886, 90 (2019).
- [14] Hu, W. et al. First Spectroscopic Confirmations of z 7.0 Ly Emitting Galaxies in the LAGER Survey. ApJ 845, L16 (2017).
- [15] Overzier, R. A. et al. CDM predictions for galaxy protoclusters - I. The relation between galaxies, protoclusters and quasars at z 6. MNRAS 394, 577–594 (2009).
- [16] Chiang, Y.-K., Overzier, R. & Gebhardt, K. Ancient Light from Young Cosmic Cities: Physical and Observational Signatures of Galaxy Proto-clusters. ApJ 779, 127 (2013).
- [17] Merritt, D. The Distribution of Dark Matter in the Coma Cluster. ApJ 313, 121 (1987).
- [18] Cai, Z. et al. Mapping the Most Massive Overdensities through Hydrogen (MAMMOTH). II. Discovery of the Extremely Massive Overdensity BOSS1441 at z = 2.32. ApJ 839, 131 (2017).
- [19] Chanchaiworawit, K. et al. Physical Properties of a Coma-analog Protocluster at z = 6.5. ApJ 877, 51 (2019).
- [20] Mo, H. J. & White, S. D. M. An analytic model for the spatial clustering of dark matter haloes. MNRAS 282, 347–361 (1996).
- [21] Jenkins, A. et al. The mass function of dark matter haloes. MNRAS 321, 372–384 (2001).
- [22] Gnedin, N. Y. Cosmological Reionization by Stellar Sources. ApJ 535, 530–554 (2000).
- [23] Rodríguez Espinosa, J. M. et al. An ionized superbubble powered by a protocluster at z = 6.5. MNRAS 495, L17–L21 (2020).
- [24] Malhotra, S. & Rhoads, J. E. The Volume Fraction of Ionized Intergalactic Gas at Redshift z=6.5. ApJ 647, L95–L98 (2006).
- [25] Dijkstra, M., Lidz, A. & Wyithe, J. S. B. The impact of The IGM on high-redshift Ly emission lines. MNRAS 377, 1175–1186 (2007).
- [26] Yajima, H., Sugimura, K. & Hasegawa, K. Modelling of Lyman-alpha emitting galaxies and ionized bubbles at the epoch of reionization. MNRAS 477, 5406–5421 (2018).
- [27] Wyithe, S., Geil, P. & Kim, H. Imaging HII Regions from Galaxies and Quasars During Reionisation with SKA. Proc. Sci. AASKA14, 015 (2015).
- [28] Yajima, H., Shlosman, I., Romano-Díaz, E. & Nagamine, K. Observational properties of simulated galaxies in overdense and average regions at redshifts z 6–12. MNRAS 451, 418–432 (2015).
- [29] Lee, C. T. et al. Properties of dark matter haloes as a function of local environment density. MNRAS 466, 3834–3858 (2017).
- [30] Maio, U., Petkova, M., De Lucia, G. & Borgani, S. Radiative feedback and cosmic molecular gas: the role of different radiative sources. MNRAS 460, 3733–3752 (2016).
Throughout this study, we adopt the recent Planck cosmological parameters[1]: , and km s-1 Mpc-1, where and are the densities of total matter and dark energy and is the Hubble constant.
Lyman Alpha Galaxies in the Epoch of Reionization (LAGER) survey:
LAEs are promising probes for characterizing the cosmic reionization[2, 3, 4, 5, 6, 11, 7, 8, 9, 12, 13, 10, 11, 12].
We are carrying out a large-area narrowband imaging survey, Lyman Alpha Galaxies in the Epoch of Reionization (LAGER), to search for the LAEs at , using the Dark Energy Camera (DECam) installed on the Cerro Tololo Inter-American Observatory (CTIO).
We designed and procured a narrowband filter (DECam-NB964) for the LAGER survey, with a central wavelength of Å and FWHM of 92 Å to avoid the atmospheric absorption and strong OH emission lines.
The filter DECam-NB964 was installed on the DECam system in December 2015.
Owing to the large FoV ( deg2 ) and red-sensitive camera, LAGER is one of the most efficient surveys in searching for LAEs in the EoR. See the filter design paper[13] for more details.
We adopt a ”wedding cake” observing strategy with two deep fields aiming to discover faint LAEs and several shallower fields aiming to discover numerous luminous LAEs.
Up to now, candidate LAEs have been selected in 4 fields, including COSMOS, CDFS, WIDE12, and GAMA15A.
LAGER-7OD1 member galaxies:
a. Member galaxies from H19:
The 14 LAEs from H19 were selected by narrowband technique.
This technique is widely used in literature and has been proven effective at searching for LAEs.
Briefly, the selection criteria in H19 include:
(1) the signal-to-noise ratio (S/N) of DECam-NB964 signal is larger than 5;
(2) DECam-NB964 excess over the underlying broadband to ensure the rest frame equivalent width (EW) of Ly is larger than 10 Å;
(3) non-detection in bluer broadbands (we adopt the recently release HSC SSP ultradeep broadband images[14]).
We visually inspected each LAE candidate to remove possible foreground galaxies and spurious objects, such as satellite trails, cosmic rays, etc.
Finally, we obtained a clean sample of 49 LAEs in COSMOS field and a clear overdense region is revealed with 14 LAEs.
b. Additional members:
The same field was also observed with another narrowband filter HSC-NB973[12], the bandpass of which partially overlaps with that of DECam-NB964 (see Fig. 1).
A hint of over-density around LAGER-7OD1 is also visible among the HSC-NB973 selected LAEs[12], but not as strong as that seen in DECam-NB964.
Among the 8 HSC-NB973 selected LAEs in the area, four (LAE-1,2,11,15) were detected in DECam-NB964 and presented by H19.
An additional source (LAE-20) shows tentative signal () in DECam-NB964 image (see also next paragraph), while the remaining 3 (LAE-22,23,24; blue dashed circles in Fig. 2; namely HSC-z7LAE24,6,16 respectively in ref.[12]) are invisible in DECam-NB964.
The latter three had not been spectroscopically observed, and are candidate LAEs likely at slightly higher redshifts beyond the probe of NB964 (see Fig. 1).
At the current stage, we do not consider these 3 LAEs as member galaxies of LAGER-7OD1 as they may locate at slightly but sufficiently higher redshifts than that of the structure.
We further stack the DECam-NB964 and HSC-NB973 images to search for fainter LAEs located within the common volume sampled by two filters, and include three more candidates (LAE-7, LAE-20 and LAE-21).
We also plot in Fig. 2a four more DECam-NB964 LAEs (LAE-5, 6, 9, 10) which were selected as lower grade candidates (comparing with those presented in H19) but were later spectroscopically confirmed.
The overdensity in LAGER-7OD1:
We estimate the overdensity as defined by , where and are the average LAE number densities in the LAGER-7OD1 and the COSMOS field, respectively. The number density of LAEs in the COSMOS is arcmin-2 (49 over 1.9 deg2) and the number density of LAEs in the LAGER-7OD1 is arcmin-2 (14 over 0.088 deg2). The errors are calculated based on the Poisson errors of the LAE sample size. The galaxy overdensity of LAGER-7OD1 is thus . The LAE sample suffers incompleteness during the detection and selection procedures (see H19 for details). However, as the narrow- and broad-band images utilized for LAE detection and selection have rather uniform depths throughout the COSMOS field, the incompleteness is constant over the field, and thus, cancels out in the calculation of the overdensity. Note we use only the LAE sample in COSMOS field from H19 for the calculation of overdensity. The additional members to LAGER-7OD1 aforementioned were excluded from such analyses as they were not uniform selected.
We adopt an enclosing rectangle as the boundary of the LAGER-7OD1 (see the gray dashed rectangle in Fig. 2a) to calculate its volume and overdensity. However, the selection of the boundary is kind of arbitrary and may differ from the intrinsic shape of the protocluster. This could introduce systematic errors to the estimations of the volume thus overdensity and present-day mass. For instance, we do not see member LAEs in the lower-right region of the rectangle (see Fig. 2a) but this region contributes of the volume. If we exclude this void region, the overdensity would be increased to 7.73. Moreover, we simply calculate the overdensity using the light-of-sight scale (26 cMpc) probed by NB964, and the protocluster may have more members out of that range. Nevertheless, the effect of the boundary selection on the present-day mass estimation is moderate, as further discussed below.
As aforementioned, the COSMOS field is unique among four LAGER fields, showing clear overdense region(s). The average LAE number density in the COSMOS field could be biased by cosmic variance, and such effect may also affect the calculation of the overdensity. We compare the luminosity function (LF) of LAEs in the COSMOS field with those in other three LAGER fields and find the LFs to agree within Poisson errors (Wold et al. in preparation). We integrate the LFs in the luminosity range of erg s-1 and find the derived average LAE densities from the four fields agree within . Thus the field-to-field variation has no significant effect on the calculation of overdensity.
We finally note that we can not rule out the possibility that a small fraction of the uniformly selected 49 candidate from H19 are actually not real LAEs, but contaminants (such as noise spikes in narrowband image, variable sources, or foreground emission line galaxies). The total number of contaminated foreground emission line galaxies (H, [OIII] and [OII]) was estimated to be 0.82 in COSMOS, thanks to the ultradeep broadband images available[13].
Considering the contaminants are unlikely spatially associated with the protocluster and should distribute randomly, excluding such contaminants (even if possible) from the calculation would yield even higher overdensity.
Spectroscopic observation and data reduction:
The three brightest LAEs in LAGER-7OD1 have been spectroscopically confirmed with IMACS on February 6-8, 2017 [ref.[14]]. We carried out spectroscopic followups for more LAEs in LAGER-7OD1 using IMACS at the 6.5m Magellan I Baade Telescope (February 21-23, 2018), and LDSS3 at the 6.5m Magellan II Clay Telescope (January 10-11 and December 29-31, 2019). For IMACS observations, we used the f/2 camera (with a FoV of diameter) and the 300-line red-blazed grism. For LDSS3, we used VPH-Red grism and OG590 filter to eliminate second order contamination. Comparing with IMACS, LDSS3 has a smaller FoV ( diameter) but relatively higher efficiency at 9600 – 9700 Å. Slitwidth of was adopted for both instruments. The spectral reduction was performed using COSMOS3[15, 16] and the single-epoch spectra are average with weights selected to maximize the of the coadded spectra.
The result 1D spectra (both IMACS and LDSS3) have spectral resolution of 6 Å. We carefully examine the 2D spectra of all spectroscopic targets and identify 13 sources as LAEs based on single line detections. Including the three previous confirmations[14], we now have spectroscopic confirmations for 16 member LAEs in LAGER-7OD1 (red solid symbols in Fig. 2a). The spectra of these 16 LAEs are presented in Suppl. Fig. 1.
Single line detections (no other lines, no continuum) might still be contaminated by foreground strong emission line galaxies, e.g., H, [OIII], and [OII]. Due to the limited spectral quality (and partial overlap with sky lines for some of them) we are unable to secure the characteristic asymmetric line profile[17] (with a red wing) of high-z Ly lines for many sources. Meanwhile while some lines are too narrow to be [OII] doublet, for some broader ones [OII] can not be completely ruled out based on the line profile alone[14]. However, the contamination rate is expected to be low. For example, recent spectroscopic survey of high-redshift LAEs at reports a low contamination rate of in their spetroscopic detections[18]. Even we consider a contamination rate of 10%, our single line identifications would be reliable for most sources. More critically and fortunately, in COSMOS ultra deep broadband images are available to rule out almost all low-z interlopers of emission line galaxies, and we expect the sample of H19 include only 0.14 ([OII]), 0.52 ([OIII]), and 0.16 (H) low-z emission line galaxies over the whole COSMOS field[13].
LAE-8, 12, and 14 were also spectroscopically observed, but not yet confirmed.
The non-detections of the Ly in their spectra do not necessarily rule them out, as their Ly lines might incidentally overlap with sky lines, or the velocity dispersions of their Ly lines could be too broad to be detected ( 500 km s-1). Note we do not detect either any signals (lines, continuum) indicative of foreground sources in their spectra.
These candidates which are spatially associated with the protocluster are more likely real LAEs instead of contaminations (such as variable sources or noise spikes in the narrowband image).
This is because the area of LAGER-7OD1 is only 1/21 of the whole COSMOS filed, thus even if a small fraction of the 49 candidates selected over the whole field are indeed contaminants, we would expect no more than one of them within the area of LAGER-7OD1 (assuming the contaminants randomly distribute over the field).
Therefore we opt to keep all three of them as valid candidates.
We further note that even if we were able to secure all such contaminations over the whole field, excluding such contaminations from the calculation would yield even higher overdensity.
Present-day mass of LAGER-7OD1:
We estimate the total present-day cluster mass of LAGER-7OD1 following the widely used formula[16, 19]: , where is the volume of the protocluster, ) is the mean matter density of the universe, and is the mass overdensity.
is related to the observed galaxy overdensity through: , where is the bias parameter and the correction factor for the redshift space distortion, and .
The bias parameter is assumed to be (measured using LAEs[20]). For at , we find and .
Thus, the present-day mass of LAGER-7OD1 is estimated to be (where the errors are derived through simulating the fluctuations of the galaxy overdensity and bias parameter ).
As aforementioned, the selection of the boundary is kind of arbitrary and could introduce as much as uncertainty to the overdensity estimation. However, this effect is moderate when estimating the present-day mass of the LAGER-7OD1. Decreasing the volume by would yield a lower and increasing the volume by would yield a higher .
The bias parameter might have been underestimated since we adopted the value at , and specifically, an increase of from 4.5 to 5.5 will result in a decrease of the estimated .
Bubble size estimation:
Previous studies[26] presented a semi-numerical simulation to investigate the relation between the bubble size and Ly luminosity of high-redshift LAEs in EoR. In the simulation, the star formation rate (SFR) was assumed proportional to the growth rate of the dark matter halo, the escape fraction of ionizing photons was assumed to be 0.2, and the ionizing photon emissivity was calculated based on the star formation history of the galaxy using the population synthesis code STARBURST99[21]. Finally, the evolution of ionized bubble and Ly luminosity (derived from the ionizing photons which do not escape) were obtained after calculating the radiative transfer in the IGM. Based on the relation between the bubble size and Ly luminosity (at , Fig. 15 in ref.[26]), we show the predicted bubble (as translucent spheres) in Fig. 3 and the predicted bubble size in Suppl. Tab. 1 for the spectroscopically confirmed LAEs in LAGER-7OD1.
Note the derived bubble sizes are model dependent. Ref.[26] has assumed a constant mean IGM density outside an HII bubble with a clumping factor of = 3 considered to take account of the density fluctuation. While increasing the clumpiness would not significantly decrease the bubble size[22], ref.[26] has pointed out that the higher IGM density near the virial radius may reduce the predicted bubble sizes. The predicted bubble size is sensitive to the Lyman continuum escape fraction which was assumed to be a constant of 0.2 in ref.[26]. But note the observational results at suggest that only a small fraction of galaxies has a high escape fraction of [23, 24, 25], and the ionizing continuum escape fraction could be mass-dependent[26, 27]. Moreover, in the model of ref.[26], the Ly escape fraction was assumed to be a constant of 0.6, and both the bubble size and Ly luminosity tightly correlate with galaxy stellar mass. However, it is known that high redshift LAEs on average are low mass and young galaxies, i.e., the Ly escape fraction is mass and stellar age dependent (e.g. refs[28, 29, 30]). Consequently, our LAEs could be significantly less massive and younger than the model predictions of ref.[26], and thus would be expected to have considerably smaller bubble sizes.
Nevertheless, considering the mean neutral hydrogen fraction at ( 0.2 – 0.4, H19) and the significant overdensity of LAGER-7OD1, it is reasonable to believe that the IGM in LAGER-7OD1 was close to fully ionized at .
However, it is yet uncertain whether the member LAEs we detected alone can produce such a giant bubble, as their predicted bubble sizes are remarkably model dependent.
In the cases aforementioned, more undetected Ly fainter galaxies (with lower star formation rates and/or Ly escape fraction) could have contributed to the reionization around LAGER-7OD1.
EW/color distribution:
The Ly EWs of narrowband selected LAEs can be well represented by the color between narrowband and the underlying broadband. For LAEs with spectroscopic redshifts one could derive more precise Ly EW measurements, after correcting for the wavelength dependence (non-boxcar shape) of the narrowband transmission and the redshift dependence of continuum contribution to narrowband photometry (see Fig. 2 of H19). As not all LAEs (particularly those field LAEs) have spectroscopic redshifts, here, we simply use the HSC- – DECam-NB964 color as an indicator of Ly EW and compare the color distribution of LAEs inside the LAGER-7OD1 with those field LAEs (Extended Data Fig. 1). Kolmogorov–Smirnov test shows no statistical difference between two samples.
References
- [1] Planck Collaboration et al. Planck 2018 results. VI. Cosmological parameters. A&A 641, A6 (2020).
- [2] Malhotra, S. & Rhoads, J. E. Luminosity Functions of Ly Emitters at Redshifts z=6.5 and z=5.7: Evidence against Reionization at z6.5. ApJ 617, L5–L8 (2004).
- [3] Furlanetto, S. R., Zaldarriaga, M. & Hernquist, L. The effects of reionization on Ly galaxy surveys. MNRAS 365, 1012–1020 (2006).
- [4] McQuinn, M., Hernquist, L., Zaldarriaga, M. & Dutta, S. Studying reionization with Ly emitters. MNRAS 381, 75–96 (2007).
- [5] Ouchi, M. et al. Statistics of 207 Ly Emitters at a Redshift Near 7: Constraints on Reionization and Galaxy Formation Models. ApJ 723, 869–894 (2010).
- [6] Hu, E. M. et al. An Atlas of z = 5.7 and z = 6.5 Ly Emitters. ApJ 725, 394–423 (2010).
- [7] Jiang, L. et al. A Magellan M2FS Spectroscopic Survey of Galaxies at 5.5 z 6.8: Program Overview and a Sample of the Brightest Ly Emitters. ApJ 846, 134 (2017).
- [8] Chanchaiworawit, K. et al. Gran Telescopio Canarias observations of an overdense region of Lyman emitters at z = 6.5. MNRAS 469, 2646–2661 (2017).
- [9] Konno, A. et al. SILVERRUSH. IV. Ly luminosity functions at z = 5.7 and 6.6 studied with 1300 Ly emitters on the 14-21 deg2 sky. PASJ 70, S16 (2018).
- [10] Higuchi, R. et al. SILVERRUSH. VII. Subaru/HSC Identifications of Protocluster Candidates at z 6–7: Implications for Cosmic Reionization. ApJ 879, 28 (2019).
- [11] Taylor, A. J., Barger, A. J., Cowie, L. L., Hu, E. M. & Songaila, A. The Ultraluminous Ly Luminosity Function at z = 6.6. ApJ 895, 132 (2020).
- [12] Jung, I. et al. Texas Spectroscopic Search for Ly Emission at the End of Reionization III. the Ly Equivalent-width Distribution and Ionized Structures at . arXiv e-prints arXiv:2009.10092 (2020).
- [13] Zheng, Z.-Y. et al. Design for the First Narrowband Filter for the Dark Energy Camera: Optimizing the LAGER Survey for z 7 Galaxies. PASP 131, 074502 (2019).
- [14] Aihara, H. et al. First data release of the Hyper Suprime-Cam Subaru Strategic Program. PASJ 70, S8 (2018).
- [15] Dressler, A. et al. IMACS: The Inamori-Magellan Areal Camera and Spectrograph on Magellan-Baade. PASP 123, 288 (2011).
- [16] Oemler, A., Clardy, K., Kelson, D., Walth, G. & Villanueva, E. COSMOS: Carnegie Observatories System for MultiObject Spectroscopy (2017).
- [17] Kashikawa, N. et al. The End of the Reionization Epoch Probed by Ly Emitters at z = 6.5 in the Subaru Deep Field. ApJ 648, 7–22 (2006).
- [18] Ning, Y. et al. The Magellan M2FS Spectroscopic Survey of High-redshift Galaxies: A Sample of 260 Ly Emitters at Redshift z 5.7. ApJ 903, 4 (2020).
- [19] Steidel, C. C. et al. A Large Structure of Galaxies at Redshift Z approximately 3 and Its Cosmological Implications. ApJ 492, 428–438 (1998).
- [20] Ouchi, M. et al. Systematic Identification of LAEs for Visible Exploration and Reionization Research Using Subaru HSC (SILVERRUSH). I. Program strategy and clustering properties of 2000 Ly emitters at z = 6–7 over the 0.3–0.5 Gpc2 survey area. PASJ 70, S13 (2018).
- [21] Leitherer, C. et al. Starburst99: Synthesis Models for Galaxies with Active Star Formation. ApJS 123, 3–40 (1999).
- [22] Cen, R. & Haiman, Z. Quasar Strömgren Spheres Before Cosmological Reionization. ApJ 542, L75–L78 (2000).
- [23] Vanzella, E. et al. The Great Observatories Origins Deep Survey: Constraints on the Lyman Continuum Escape Fraction Distribution of Lyman-break Galaxies at 3.4 z 4.5. ApJ 725, 1011–1031 (2010).
- [24] Grazian, A. et al. Lyman continuum escape fraction of faint galaxies at z 3.3 in the CANDELS/GOODS-North, EGS, and COSMOS fields with LBC. A&A 602, A18 (2017).
- [25] Bian, F. & Fan, X. Lyman continuum escape fraction in Ly emitters at z 3.1. MNRAS 493, L65–L69 (2020).
- [26] Finkelstein, S. L. et al. Conditions for Reionizing the Universe with a Low Galaxy Ionizing Photon Escape Fraction. ApJ 879, 36 (2019).
- [27] Ma, X. et al. No missing photons for reionization: moderate ionizing photon escape fractions from the FIRE-2 simulations. MNRAS (2020).
- [28] Finkelstein, S. L., Rhoads, J. E., Malhotra, S. & Grogin, N. Lyman Alpha Galaxies: Primitive, Dusty, or Evolved? ApJ 691, 465–481 (2009).
- [29] Lai, K. et al. Spitzer Constraints on the Stellar Populations of Ly-Emitting Galaxies at z = 3.1. ApJ 674, 70–74 (2008).
- [30] Cai, Z.-Y. et al. A Physical Model for the Evolving Ultraviolet Luminosity Function of High Redshift Galaxies and their Contribution to the Cosmic Reionization. ApJ 785, 65 (2014).
Supplementary Information
|
|
|
|
|
|
|
|
|
|
|||||||||||||||
| Spectroscopically Confirmed | ||||||||||||||||||||||||
| LAE-1 | 10:02:06.0 | +02:06:46.3 | 6.938 | 23.77c | 14.5 | COSMOS-1 | ||||||||||||||||||
| LAE-2 | 10:01:53.5 | +02:04:59.8 | 6.932 | 24.75c | 11.5 | COSMOS-3 | ||||||||||||||||||
| LAE-3 | 10:03:10.5 | +02:12:30.8 | 6.923 | ** | 13.7 | COSMOS-2 | ||||||||||||||||||
| LAE-4 | 10:03:32.7 | +02:09:25.1 | 6.900 | ** | 8.5 | COSMOS-10 | ||||||||||||||||||
| LAE-5 | 10:03:30.7 | +02:14:08.5 | 6.899 | ** | 8.0 | Na | ||||||||||||||||||
| LAE-6 | 10:03:28.0 | +02:08:51.3 | 6.915 | ** | 7.3 | Na | ||||||||||||||||||
| LAE-7 | 10:03:05.2 | +02:09:14.7 | 6.945 | 6.1 | Nb | |||||||||||||||||||
| LAE-9 | 10:03:16.0 | +02:15:42.3 | 6.920 | ** | 6.4 | Na | ||||||||||||||||||
| LAE-10 | 10:02:42.3 | +02:06:55.2 | 6.922 | ** | 5.8 | Na | ||||||||||||||||||
| LAE-11 | 10:02:39.4 | +02:07:12.1 | 6.962 | 24.78c | 6.4 | COSMOS-41 | ||||||||||||||||||
| LAE-13 | 10:02:33.5 | +02:07:09.5 | 6.936 | ** | 6.4 | COSMOS-42 | ||||||||||||||||||
| LAE-15 | 10:02:23.4 | +02:05:04.8 | d | 6.971 | 23.68c | 12.1 | COSMOS-49 | |||||||||||||||||
| LAE-16 | 10:02:32.9 | +02:05:52.8 | 6.915 | ** | 7.3 | COSMOS-29 | ||||||||||||||||||
| LAE-17 | 10:03:33.5 | +02:07:19.8 | 6.917 | ** | 7.9 | COSMOS-17 | ||||||||||||||||||
| LAE-18 | 10:03:37.3 | +02:07:36.7 | 6.953 | ** | 7.3 | COSMOS-27 | ||||||||||||||||||
| LAE-19 | 10:03:39.3 | +02:07:47.2 | 6.943 | ** | 6.4 | COSMOS-34 | ||||||||||||||||||
| Not Yet Confirmed | ||||||||||||||||||||||||
| LAE-8 | 10:02:09.0 | +02:04:11.0 | ** | ** | 7.2 | COSMOS-25 | ||||||||||||||||||
| LAE-12 | 10:03:00.1 | +02:14:49.5 | ** | ** | 7.0 | COSMOS-24 | ||||||||||||||||||
| LAE-14 | 10:02:08.3 | +02:06:59.6 | ** | ** | 6.9 | COSMOS-30 | ||||||||||||||||||
| LAE-20 | 10:02:47.1 | +02:10:40.1 | d | ** | 24.52c | 7.0 | Nb | |||||||||||||||||
| LAE-21 | 10:03:15.6 | +02:18:11.3 | ** | 6.9 | Nb | |||||||||||||||||||
-
a
a LAE-5, 6, 9, 10 were not included in H19 as they are labelled as lower-grade candidates for various reasons (LAE-5: close to bad image regions; LAE-6: noisy signal in the NB image; LAE-9: adjacent to a foreground galaxy within ; LAE-10: with DECam-NB964 signal lower than 5), but latterly got spectroscopically confirmed.
-
b
b LAE-7, 20, and 21 are selected using the stacked image of DECam-NB964 and HSC-NB973 images.
-
c
c We adopt the HSC-NB973 magnitudes given in ref.[12].
-
d
d We adopt the Ly luminosities given in ref[12], because their Ly lines locate in the red tail of the DECam-NB964 and their Ly luminosities will be severely underestimated if using DECam-NB964 magnitude.