Study evolution of fragment energy spectrum in compound and elemental absorber with thickness via effective charge correction
Abstract
The energy loss behaviour of fission fragments (FF) from 252Cf(sf) in thin Mylar () and Aluminium absorber foils have been revisited. The aim is to investigate the observed change in the well known asymmetric energy of spontaneous fission of 252Cf as the fragments pass through increasingly thick absorber foils. Two different types of absorbers have been used- one elemental and the outher an organic compound. The stopping powers have been determined as a function of energy for three fragment mass groups with average masses with = 106.5, 141.8, 125.8 corresponding to light, heavy and symmetric fragment of 252Cf. Using the effective charge (Zeff) in the stopping power relation in the classical Bohr theory best describes the stopping power data. Spectrum shape parameters, subsequently have been extracted from the energy spectra of fission fragments for different foil thickness. The effective charge (Zeff) correction term determined from the stopping power data is then used in the simulation for the absorber thickness dependence of the shape parameters of the energy spectrum. The present simulation results are compared with the TRIM prediction. The trends of the absorber thickness dependence of the spectrum shape parameters, for both Mylar and Aluminium are well reproduced with the present simulation.
, , ,
1 Introduction
The energy loss mechanism of heavy charged particles, e.g. the fission fragments, unlike the light charged particles, is much more complicated due to the variation of effective charge of the heavy particles as the velocity of the particles changes in the medium [1]. Also towards the end of the flight path, the energetic heavy particle loses major part of its energy in atom-atom collisions. Theories of specific energy loss of charged particles in matter have been presented in seminal works of Bohr [2, 3] and Lindhard, et al. [4].
The measurement of specific energy loss of heavy ions in different media have also been performed extensively in the past and compared with various theoretical models [5, 6, 7, 8, 9, 10]. Of different heavy projectiles, fragments from asymmetric fission of 252Cf nucleus provides an interesting domain for study of energy loss of heavy charged particles. The decay fragments are neutron rich, heavy in nature with velocities in the range of 0.4 1.3 MeV/u. As 252Cf undergoes asymmetric fission, one gets two distinct groups of heavy charged particles for a simultaneous study of energy loss behaviour in a medium. In a recent work, Biswas, et al. [11] have observed that the shapes of energy or velocity spectra of the two fragment groups change distinctly as the thickness of absorber medium is increased. In their case the absorber medium was Mylar, an organic polymer.
In the present study, we investigated the distinctive change in the energy spectra of the two groups of fission fragments from 252Cf in two different absorber media.
We used the organic compound Mylar along with the elemental Aluminium as the two types of absorber media.
Mylar with its covalent bond structure for the electrons has less number of free electrons compared to Aluminium, which approaches the ideal metallic condition of free valence electron gas surrounding the array of metallic ions. The specific energy loss for most probable light, heavy and symmetric fragments in Mylar and Aluminium absorber foils of varying thickness have been measured.
The semi-empirical fit using Bethe-Bloch formula with dynamic effective charge correction is used to describe data and the parameters of an enparical expression for effective charge, Zeff, have been derived. Finally, we provided the explanation for the evolution of shapes of the energy distributions of light and heavy fragment groups in two different absorber media including the dynamic effective charge correction factor in Bethe-Bloch formula.
2 Experimental set-up
The setup consists of a vacuum chamber with a source holder and a detector mount. The absorber foil can be placed in between the source holder and the detector mount. The chamber is then evacuated and maintained at a pressure Torr during the measurements. An ORTEC Silicon Surface Barrier detector (Model No: BU-015-200-100, Serial No: 3.3-271D.5) of effective thickness of 100 m at an operating bias of 50 volt is used in the experiment. Normal electronics setup has been adopted for processing the signal.The signal is digitized through NIM based Dual ADC in MPA3 data acquisition system from FASTCOMTEC and stored in the desktop for subsequent analysis.
2.1 Comparison of FF pulse height spectra in Mylar and Aluminium absorbers
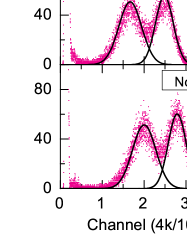
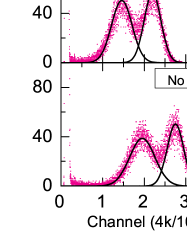
In this work we studied the relative change in energy distributions of light and heavy groups of fission fragments with increasing thickness of the absorber foil. Two different types of absorbers - organic compound Mylar and metallic Aluminum having very similar ()- have been used. An interesting behavior is observed in the study of evolution of the energy spectrum of the FF as the foil thickness is increased. The nature of evolution of the energy distribution of fission fragments from 252Cf with foil thickness is distinctly different for Mylar and Aluminium. The variation with increasing thickness of Mylar and Aluminium foils are shown in Figs. 1 and 2,
To further investigate the changing nature, we fitted both heavy and light FF energy spectra by Gaussian functions and the ratio of area under the light and the heavy fragment peaks have been estimated. It is observed that the ratio remains within a range of 10% relative to the value obtained without any foil. This ensures that while estimating the spectrum parameters no counts under the peaks have been missed.
2.2 Energy calibration of silicon detector for FF
The suitability of the detector used for FF detection is established following the prescription of Schmitt and Pleasonton [6, 13, 14]. The resulting spectrum shape parameters corroborate nicely with the expected values of Schmitt and Pleasonton[6, 13, 14] that establishing the goodness of the detector for the energy loss measurements of the fission fragments.
In the next step, we used the mass-dependent energy calibration equation from Ref. [15] to obtain the fragment energy in terms of its mass () and the corresponding pulse height () from the silicon surface barrier detector. The relation is
| (1) |
The constants in Eq.1 depend on the spectrum shape parameters and the required expressions are given as in Ref. [16] The values of the constants of mass dependent calibration equation for the present experiment have been shown in Table 1.
| a | a′ | b | b′ |
|---|---|---|---|
| 0.0299 | 3.4x10⁻⁵ | 6.38 | 0.0172 |
| System | Energy E(x,m) in MeV | PHD in MeV | ||||
| FF | Light | Heavy | symmetric | Light | Heavy | symmetric |
| Present study | 102.56 1.0 | 78.48 0.62 | 91.76 0.8 | 9.2 | 12.5 | 10.76 |
| From | 103.0 0.6 [17] | 78.9 0.5 [17] | 16 [19, 20] | 17 [19, 20] | ||
| reference | 103.0 0.5 [14] | 79.37 0.5 [14] | 13 [21] | 14 [21] | ||
| 102.54 0.94 [13] | 78.68 0.5 [13] | |||||
Using calibration Eq. 1 with the constants given in Table 1, the energies of light, heavy and symmetric fragments are estimated. The average mass values of the fragments are taken from Ref. [17]. The energy values of respective fragments are given in Table 2. The estimated values of the fragment energies, without any absorber, compare well with those reported in the literature. In Table 2, we have also presented our estimation of pulse height defect (PHD) of each fragment. The pulse height defect (PHD) has been evaluated as a difference of expected energy from alpha calibration and the actual observed energy for respective fragments. A comparison of the resultant PHD values for the light and heavy fragments are shown in Column 4 of the table. The energy calibration scheme is then followed in subsequent determination of energy loss of fragments in the absorber foil.
3 FF energy loss in Mylar and Aluminum absorbers
It is difficult to measure the energy loss of each and every FF mass from the energy spectrum. We measured instead the energy loss of most probable complimentary light and heavy fragments and that of the symmetric fragments using the mass dependent energy calibration equation of FF for the peak locations of light, heavy and symmetric fragments for different thicknesses of the absorbers. Energy loss is measured as the difference of two energies viz. , the fragment energy after passing through the selected foil and the fragment energy without any foil. The specific energy loss is then estimated at an effective particle energy within the thickness as
| (2) |
where is the thickness of absorbing foil and is the effective particle energy. For thin absorber ( less than 1m) with , the approximation is used to estimate the effective energy in the present work. But for higher target thickness where does not hold, we used a numerical approach with finite foil thickness correction to estimate the effective E following the expression given in Ref. [18].
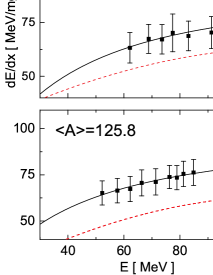
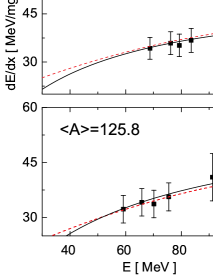
The estimated stopping power values as function of incident energy are plotted in Figs. 3 and 4. The plots are shown for three different average mass values corresponding to the two peaks and the minimum in the mass spectrum.
3.1 Estimation of uncertainty
In the determination of uncertainty associated with the measured specific energy loss, we used the standard error propagation technique. The uncertainty in specific energy loss primarily comes from the uncertainties in energy loss of the fragments in the absorber and in the determination of foil thickness. Taking into consideration all the factors the uncertainty of varies from 0.6 to 1.9 % and the accuracy of foil thickness is typically in the range of 10 to 16%. The thickness of each absorber foil is determined separately by the -energy loss technique, using a 3-line -source. The overall uncertainty of the specific energy loss value in the present measurement is primarily determined by the uncertainty in the foil thickness and is within 10-17%. The error resulting from the use of the averaged mass and atomic number instead of the actual values, estimated using the code SRIM 2013, is small compared to the overall uncertainty mentioned above. Hence this contribution has not been considered. The errors are shown in Figs 3 and 4.
4 Semi-empirical description of FF energy loss
According to classical theory of Bohr [3], electronic stopping power of an ion with charge moving with velocity in a medium consisting of atoms having charge and mass , , is given as
| (3) |
in the non-relativistic limit and in the unit of . Here , c is the speed of light. The mean ionization and excitation potential with 10 eV. Now fast moving heavy ions, depending on their velocities, can pick up electrons from or lose electrons into the medium. Thus the effective ionic charge fluctuates around a certain equilibrium value of [2]. The resulting screening of Coulomb field of the nuclear charge affects the stopping power. The effective charge is expressed as where multiplicative factor is the effective charge parameter which has a complicated dependence on the atomic number of absorber foil and the energy or velocity of the fragment moving through the absorber medium. The general semi-empirical form for , as suggested by Bohr, can be written as [22, 23].
| (4) |
where and are constants and is the Bohr velocity. We obtained three sets of values for and each by fitting the stopping power data in Mylar and in Aluminum foils is shown in Figs 3 and 4 for light, heavy and symmetric FF to construct the effective charge parameter . Since Mylar is an organic compound, we used the average value of charge and mass number for this material (, ) [17]. The fitted parameters , are listed in Table 3. The soild lines in the figures are the fits using the semi-empirical expression. The dashed lines represent the prediction of SRIM-2013 without the correction for effective Z.
It is obvious from Figs 3 and 4 that the required correction for effective charge is significant in the covalent organic absorber Mylar compared to metallic Aluminium. The difference in reflected in the values of parameter a1 in the exponent of the relation in Eq. 4.
| Foil | FF group | Reduced | ||
|---|---|---|---|---|
| Light | 1.11 | 3.56 | 1.28 | |
| Mylar | Heavy | 1.15 | 3.54 | 2.7 |
| Symmetric | 1.06 | 3.13 | 2.78 | |
| Light | 1.05 | 5.81 | 0.57 | |
| Al | Heavy | 1.00 | 3.98 | 0.74 |
| Symmetric | 1.04 | 5.10 | 1.24 |
5 Results and Discussion
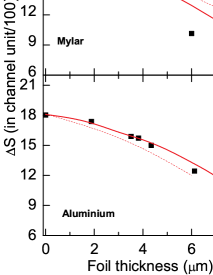
As mentioned earlier, in the current work, we studied the relative change in energy distribution patterns of light and heavy groups of fission fragments with increasing thickness of the absorber foil. An interesting behavior is observed in the study of evolution of the energy spectrum of the FF as the absorber foil thickness is increased. The nature of evolution of the energy distribution of fission fragments from 252Cf with foil thickness is distinctly different for Mylar and Aluminum though having very similar . The variation with increasing thickness of Mylar and Aluminum foils are shown in Figs. 5 and 6, respectively. To further investigate the changing nature, we fitted both heavy and light FF energy spectra by Gaussian functions and the ratio of area under the light and the heavy fragment peaks have been estimated. It is observed that the ratio remains within a range of 10% relative to the value obtained without any foil. This ensures that while estimating the spectrum parameters no counts under the peaks have been missed.
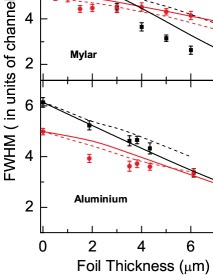
Three different spectrum shape parameters, viz., the FWHM values of the fitted energy spectra of two individual FF groups and the parameter S that gives the width of the total energy spectrum estimated at the FWTM level, have been used to characterize the spectrum. The plots of FWHM and S vs. foil thickness with Mylar and Aluminum foils are shown in Figs. 5 and 6, respectively. The deviation from the TRIM-2013 simulated curve (dashed carves) at higher foil thickness is clearly visible in the figures. But semi-empirical description including dynamic effective charge better reproduce the experimental features for both the absorber media. Interestingly, the FWHM of heavy fragment peak falls off much more sharply compared to the TRIM prediction with increasing thickness of Mylar foil, while the FWHM of the light fragment peak decreases slowly and matches with the TRIM prediction at larger foil thickness region. In case of Aluminum absorber, the FWHM-s of light and heavy fragment peaks follow the trend yielded by TRIM simulation. The parameter S describing the overall width of the 252Cf fission fragment energy spectrum in Mylar shows a much steeper fall relative to the simulation data as the foil thickness increases. On the other hand in Aluminum medium, both the extracted parameter S and its simulated values show a very similar fall off with increasing foil thickness.
6 Conclusion
The observed behavior of the shape parameters in case of Mylar and Aluminum absorbers led us to look for the dependence of the dynamical quantity , which indicates the evolution of effective value of the particles as they pass through the absorber medium (or as the velocity of the particles decrease), on the foil thickness. The resultant screening of the Coulomb field of the heavy charged nucleus of the projectile strongly affects the energy loss behavior. Over the same thickness range, the neutralization of the heavy charged projectile is faster in case of organic compound Mylar, although the free electron density is lower in the Mylar medium compare to metallic Aluminum. Also in Mylar the rate of neutralization of heavier FF is quicker than the lighter FF. This is not the behavior in elemental Aluminum absorbers. In Aluminum, the energy loss behaviors of the two fragment groups are similar except for this absorber thicknesses. Thus energy loss mechanism of heavier fragments is essentially through atom-atom collision at low velocities in Mylar.
Energy loss behavior of fission fragments in elemental Aluminum and in organic compound Mylar has been investigated. It is observed
that the measured stopping cross section data is significantly higher compared to SRIM 2013 predictions in lighter organic medium.
The data in case of Al-absorber is quite well reproduced. The variation of the shape parameters of the spectrum with increasing
absorber thickness has been compared with results of TRIM simulation in SRIM 2013 code system. It is found that the simulated dependence of the
FWHM of energy spectrum, on absorber thickness for heavy FF in lighter absorber over predicts the data as the foil thickness increases. However,
for lighter FF the calculation does reproduce the data in Mylar. Over prediction is also observed for FWTM data as a function of foil thickness
in Mylar. The data for Al-absorber is well reproduced by TRIM simulation. It would be interesting to extend the investigation of energy
loss of fission fragments in elemental Beryllium foils with Z=4 for comparison with organic compound Mylar having average Z=4.5.
Acknowledgment
We thank Prof. Maitreyee Saha Sarkar, Nuclear Physics Division, Saha Institute of Nuclear Physics, Kolkata for her useful suggestions and constant encouragement in the work.
References
- [1] J. Knipp, E. Teller, Phys. Rev. 59 (1941) 659
- [2] N. Bohr, Phys. Rev. 58 (1940) 659
- [3] N. Bohr, Kgl. Danske Videnskab. Selskab, Mat.-Fys. Medd. 18, 8 (1948).
- [4] J.Lindhard, M.Schraff, H.E.Schiøtt, Math.Fys.Meed.DanVid. Seels.33, 14 (1963).
- [5] H.Paul and A.Schinner, Nucl. Instr. and Math. B179, 299 (2001).
- [6] M. Hakim and N.H. Shafrir, Can. J. Phys. 49, 03024 (1971)
- [7] M. Pickering and J.M. Alexander, Phys. Rev. C6 (1972) 343.
- [8] Y. Laichter, H. Gaissel and W.H. Shafrir, Nucl. Inst. Meth. 194, 45 (1982).
- [9] Rekha Govil, S.S. Kapoor, D.M. Nadkarni, S.R.S. Murthy and P.N. Rama Rao, Nucl. Inst. Meth B4, 13 (1984).
- [10] C. D. Moak , et al, Phys. Rev. 149, 544 (1966).
- [11] D.C. Biswas, et al., Nucl. Instr. and Meth. A 901, 76 (2018)
- [12] J.F. Ziegler, Handbook of Stopping Cross-sections of Energetic Ions in all Elements, Vol. 5 (Pergamon, 1980); J.F. Ziegler, Appl. Phys. Lett. 31, 544 (1977).
- [13] H. W. Schmitt, et al, Phys. Rev. 141, 1146 (1966).
- [14] H.W. Schmitt, W.E. Kiker, C.W. Williams, Phys. Rev. 137 (1965) B837 .
- [15] G. F, Knoll, Radiation Detection and Measurement, 3rd Edition, 2009, John and Sons Inc.
- [16] E. Weissenberger, et al., Nucl. Instr. and Meth. A248, 506 (1986).
- [17] G. N. Knyazheva , S.V. Khebnikob, E.M. Kozulin, et al, Nucl. Instr. and Meth. B 248, 7 (2006).
- [18] P. Mertens, Nucl. Inst. and Meth. B27, 315 (1987).
- [19] A. Bozorgmanesh, Phd Thesis, University of Michigan, USA, 1976
- [20] E.C. Finch, Nucl. Inst. Meth. 113, 29 (1973)
- [21] E. Koneey and K. Hetwer, Nucl. Inst. Meth. 36, 61 (1965)
- [22] L.C. Northcliffe and R.F. Schilling, Nucl. Data Tables A7, 233 (1970)
- [23] D.C. Biswas, et al., Nucl. Inst. Meth. B53, 251 (1991).