Formation of solid-state dendrites under the influence of coherency stresses: A diffuse interface approach
Abstract
In this paper, we have formulated a phase-field model based on the grand-potential functional for the simulation of precipitate growth in the presence of coherency stresses. In particular, we study the development of dendrite-like patterns arising out of diffusive instabilities during the growth of a precipitate in a supersaturated matrix. Here, we characterize the role of elastic energy anisotropy and its strength on the selection of a dendrite tip radius and velocity. We find that there is no selection of a unique tip shape as observed in the case of solidification, and the selection constant increases linearly with simulation time for all the simulation conditions (where and are the tip radius and velocity). Therefore, structures derived in solid-state in the presence of elastic anisotropy may only be referred to as dendrite-like.
keywords:
Phase field; misfit strain; anisotropy; solid-state dendrites.
1 Introduction
The formation of dendritic structures during solidification processes is a well-known phenomenon. Thermal supercooling in the case of pure metals and constitutional supercooling in the case of alloys have traditionally been used to explain the instability that gives rise to such structures, and a detailed review of the theory of dendritic growth during solidification may be found in the reviews [1, 2, 3, 4, 5, 6, 7, 8]. Hence, while the study of dendritic growth during solidification has been studied quite extensively leading to an almost complete understanding of the parameters that lead to the selection of a unique dendritic tip radius and velocity, the same is not true for the case of solid-state dendritic growth, wherein the number of experimental observations of such growth is itself limited. Yoo et al. [9] observed that during the precipitation of -phase in Ni-base superalloys, after giving a specified heat treatment to the alloy, i.e., when it is cooled to the ageing temperatures very close to the solvus temperature, the coherent precipitates grow into dendritic structures, where the arms of the dendrite grow along the directions. Doherty [10] discussed various factors that appear to explain the shape instabilities in some solid-state reactions, such as the solid-state dendrites of -brass precipitates in the -brass matrix in the Cu-Zn alloy. Husain et al. [11] reported that the precipitation of the -phase in Cu-Al -phase alloys yield dendritic morphologies. It is also observed that the rapid bulk diffusion and fast interfacial reaction kinetics would promote the formation of such morphologies. They have predicted the occurrence of dendritic morphologies during solid-state precipitation in many binary systems such as Cu-Zn, Cu-Al, Ag-Al, Ag-Zn, Cu-Ga, Au-Zn, Ni-Zn, Cu-An, Ag-Cd, and Cu-Sn. The authors attribute crystallographic similarities between the parent phase and the precipitates to be the dominating factor that gives rise to the formation of the dendritic structures. In a later study, Yoo et al. [12] have observed spherical precipitates changing into flower-like structures as the supersaturation in the matrix is increased. They have shown that the results are concurrent with the Mullins-Sekerka theory, where they comment that the morphological instabilities should be evident if the point effect of the diffusion is significant in the vicinity of the precipitate-matrix interface regardless of the nature of the matrix phase and the ageing stage. Khan et al. [13] have also noticed the formation of solid-state dendritic structures during the elevated temperature treatment of maraging steel. There, the oxy-nitride phase acquires dendritic morphology in the martensitic matrix.
At a fundamental level, the presence of a supersaturation in the matrix makes the interface unstable to diffusive instabilities of the Mullins-Sekerka type, and therefore the observation of such dendritic structures during solid-state reactions is not surprising. However, there is an important difference from the case of solidification, wherein the solid-solid interface in precipitation reactions is typically coherent in the initial stages of precipitation, and thereby the precipitate and the matrix are also elastically stressed. Since the elastic-effects scale with the size of the precipitate, the presence of coherency will therefore naturally influence the selection of length scales during dendritic evolution.
Leo and Sekerka [14] have extended the linear stability analysis performed by Mullins and Sekerka [15] by including the influence of elastic coherency stresses and have investigated the morphological stability of the precipitate grown from the solid solution. The analysis shows that the elastic-effects manifest through the boundary conditions based on local equilibrium that determines the compositions at a coherent solid-solid interface. The elastic-effects increase in importance relative to capillarity as the scale of the system increases, and so will become very important at small initial supersaturation, as the supersaturation is inversely proportional to the critical nucleus radius. Elastic fields can also influence the selection of the fastest-growing harmonic, with stabilizing elastic fields favoring long-wavelength harmonics while destabilizing elastic fields favoring short-wavelength harmonics. The stability analysis reveals the dependence of the different elastic parameters in either amplification or decay of the perturbations at the solid-solid interface.
While such a linear stability analysis gives an idea about the characteristics of the diffusive instability, they cannot explain the selection of a unique dendritic tip radius and velocity, as is known from solidification experiments. The selection requires the presence of anisotropy in either the interfacial energy or the attachment kinetics, and the selected growth shape of the dendrite may be predicted using the well established microsolvability theory [16, 17, 18, 19]. Formulation of such a theory is presently lacking for solid-state dendritic growth, and a possible strategy here is the use of dynamical phase-field simulations that naturally lead to the selection of a unique tip radius and velocity. Previously, Greenwood and coworkers [20] have proposed a phase-field model for microstructural evolution which includes the effects of the elastic strain energy. The authors show that the solid-state dendritic structures undergo a transition from surface energy anisotropy dominated growth directions to elastically driven growth directions induced by changes in the elastic anisotropy, the surface anisotropy, and the supersaturation in the matrix. Our work, in this paper, will be an extension of this investigation where we will study dendritic tip selection using a phase-field model as a function of the different elastic and interfacial parameters as well as the supersaturation. Similar to dendrites formed during the solidification experiments, our studies will aim at identifying the variation of the classical selection constant () as a function of the material and process parameters, and in particular, the strength of anisotropy in the stiffness matrix and the interfacial energies. Thus, our motivation in this paper is to determine the effect of several physical properties on the formation of the solid-state dendritic structures and characterize the influence on the selection constant (). Here, we will utilize a diffuse interface formulation where we solve the Allen-Cahn equation along with the evolution of the diffusion potential of the relevant species that ensure mass conservation. While solving the evolution equations of the order parameter and the diffusion potential, we ensure that the mechanical equilibrium is satisfied in all parts of the system. The simulations show the evolution of a precipitate morphology in the supersaturated matrix with imposed anisotropies in the elastic energy as well as the interfacial energy. We will systematically study the effect of change in different properties of the phases on the selection of radius of the dendrite tip and velocity.
2 Model formulation
We formulate a phase-field model based on a grand-potential functional which includes the interfacial properties as well as the thermodynamics of the bulk phases in the system,
| (1) |
where is the total volume of the system undergoing solid-state phase transformation. The phase-field order parameter that describes the presence and absence of precipitate ( phase) and matrix ( phase), acquires value in the precipitate phase whereas in the matrix phase. The double obstacle potential which writes as,
| (2) |
provides a potential barrier between two phases. Here, the term controls the interfacial energy density, while influences the diffuse interface width separating the precipitate and the matrix phases. Anisotropy in the interfacial energy is incorporated using the function , which further writes as [21]:
| (3) |
where is the strength of anisotropy in the interfacial energy, is the anisotropy function of the interface normal, . is the grand potential density that is a function of the diffusion potential . Finally, is a function of the displacement field .
By taking the variational derivative of the functional with respect to the phase-field order parameter, using Allen-Cahn dynamics, we get the evolution of order parameter , which writes as,
| (4) |
| (5) |
where is a relaxation constant for the evolution of . The last two terms in Eqn. 5 contributes to the driving force necessary for the evolution of the precipitate phase. Here the term is the difference between the grand-potential densities of the and the phases, and the corresponding term in the update of the order parameter derives from , where is an interpolation polynomial. Further, the difference of the grand-potential densities between the phases may be written as a function of the departure of the diffusion potential from its equilibrium values as, , where and are the equilibrium compositions of the bulk precipitate and matrix phases respectively. We note that this is the driving force at leading order for an arbitrary description of the free-energies while it is the exact driving force for a situation where the free-energy composition relations of the matrix and precipitate are parabolic with equal curvatures.
The second term in the driving force for phase transition (Eqn. 5) comes from the derivative of the elastic free-energy density that writes as,
| (6) |
where the total strain can be computed from the displacement field , which writes as,
| (7) |
while the elastic constants and misfit-strain can be expressed as,
| (8) |
To simplify the equations, without any loss of generality, we additionally impose that the misfit-strain exists only in the precipitate phase ( phase), which makes . Thereafter, the elastic energy density can be recast as,
| (9) |
where, in Eqn. 9, we segregate the terms in powers of , i.e., , , , and . Each pre-factor is a polynomial of , elastic constants, and the misfit strains. The expansion of these pre-factors is illustrated in the A. Therefore, the term corresponding to the elastic energy in the evolution equation of the order parameter can be computed as,
| (10) |
Eqn. 5 is solved along with the update of the diffusion potential that follows the equation,
| (11) |
where is the atomic mobility that is explicitly related to the diffusivity as . For our calculations, we assume a parabolic description of the matrix and precipitate phases with equal leading order terms , thereby the mobility becomes . Finally, we compute the displacement field as a function of the spatial distribution of the order parameter, which is utilized to calculate the magnitude of the strain field across the domain. Thus, we solve the damped wave equation iteratively which writes as,
| (12) |
Eqn. (12) is solved until the equilibrium is reached, i.e., . The terms and are chosen such that the convergence is achieved in the fastest possible time.
3 Parameter initialization
In this section, we list out the material parameters that will be used in the subsequent sections. We use a non-dimensionalization scheme where the energy density scale is derived from the magnitude of the shear modulus , while the interfacial energy scale is given by . Dividing the interfacial energy scale with the energy density scale sets the length scale of . In this work, we report all the parameters in terms of non-dimensional units. The anisotropy in the elastic energy is introduced through the Zener anisotropy parameter, i.e., , which in turn modifies the magnitudes of the elastic constants, that are , , and . These elastic constants can further be elaborated in terms of the shear modulus (), Poisson’s ratio (), and Zener anisotropy parameter (), which controls the evolution and orientation of the instability.
| (13) |
In 2D, for values of greater than unity, directions are elastically softer and directions are elastically harder, whereas in 3D directions are softer, while directions are harder. However, if is less than unity, elastically soft (hard) directions are () in 2D, and in 3D. For all the cases, the precipitate and the matrix have the same magnitude of . Unless otherwise specified, all results are produced with , , and varying between 2 and 3, typically observed in Ni-based superalloys. Here, the misfit strain or eigenstrain () is dilatational, i.e., the magnitude of the misfit strain is the same along all the principal directions while the off-diagonal terms are zero. The magnitude of misfit strain is varied in the range from 0.5 to 1%. The simulation is initialized with a precipitate of initial radius, , that is placed at the center of the domain. The simulation domain obeys periodic boundary conditions. The size of the domain is chosen such that the diffusion fields of the neighboring precipitates do not interact with each other. The sizes are and for 2D and 3D, respectively, where is the capillary length. Equilibrium compositions in the bulk precipitate and the matrix are chosen to be 0.78125 and 0.5, respectively.
In the following, we perform systematic simulation studies in both 2D and 3D in order to investigate the influence of supersaturation, misfit strain, and anisotropy strengths on the development of dendrite-like instabilities. The 2D simulations are performed using a finite-difference discretization on a regular grid and the code is written C and parallelized using MPI for running on several CPUs. Since the 3D simulations are more computationally intensive, we utilize the Fourier-spectral method that allows a quicker solution to the equations of mechanical equilibrium [22]. The simulations are run on NVIDIA Tesla V100 GPUs using the optimized CUDA-based spectral solver for the governing equations (5), (11), and (12).
4 Evolution of the precipitate into dendrite-like shape
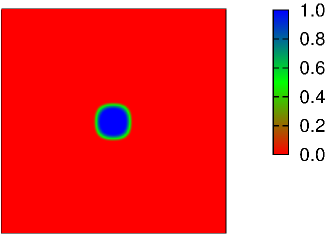
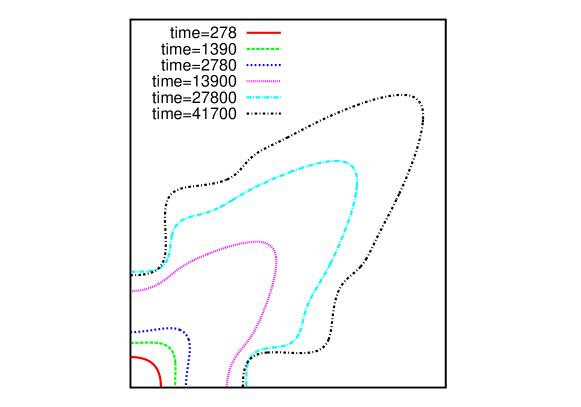
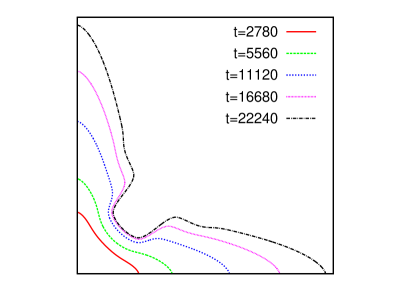
We begin by describing the shape evolution of the precipitate giving rise to dendrite-like shapes. Fig. 1 shows such an exemplary simulation in 2D where the matrix supersaturation () is 53%, the misfit at the interface is , Zener anisotropy parameter , and the interfacial energy is isotropic. We note that experimental observations show dendritic structures usually at a lower supersaturation, which leads to larger inter-precipitate distances allowing free development of the instabilities without overlap of the composition and the elastic fields.
In the simulations, however, we are constrained by having to resolve the large elastic and composition boundary layers. Therefore, in order to derive results in a reasonable time, we have performed simulations for higher supersaturations in comparison to experimentally observed situations. However, this should not alter the results that we derive from the simulations and should be generically applicable for interpreting experimentally observed microstructures and observed trends in the change of the morphologies upon alteration of the processing conditions or the material properties.
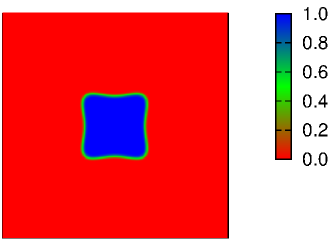
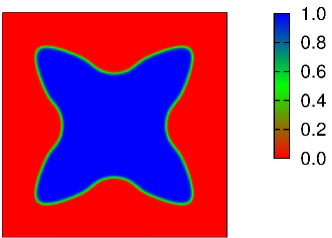
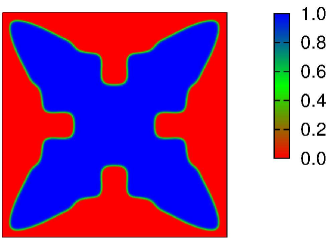
For 2D simulations, the precipitate with an initial circular shape grows into a square-like shape with rounded corners, where its faces are normal to directions. In the absence of interfacial energy anisotropy, the precipitate shape and the eventual instabilities of the interface are determined by the anisotropy in the elastic energy. Further, with an increase in the size, the precipitate corners become sharper. Eventually, due to the point effect of diffusion, the corners of the precipitate grow faster (along the directions) compared to its faces, which further gives rise to concavities on the precipitate faces, as shown in Fig. 1- 1. We note that this shape evolution is indeed due to a diffusive instability similar to the Mullins-Sekerka instability leading to the formation of dendrites during solidification for anisotropic interfacial energies, where the perturbations of the composition boundary layer ahead of the interface provide an amplifying feedback to the interface velocity leading to the development of the instability.
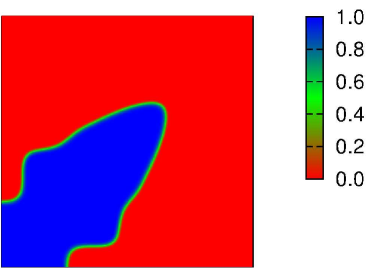
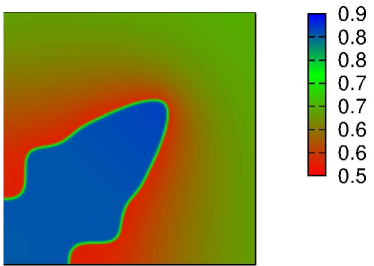
Among the different possible perturbation modes, the elastic energy anisotropy determines the eventual shape of the precipitate during growth giving rise to dendrite-like shapes. Fig. 1 shows the contour plot of phase-field profiles at , i.e., the precipitate-matrix interface, which is plotted as a function of increasing time. The composition field around the precipitate also evolves as a function of time which is captured in Fig. 2.
In 3D, the precipitate first develops into a cube-like shape with rounded corners where the faces are normal to directions. Table 1 depicts the evolution of the precipitate into a dendrite-like morphology. The left panel shows the temporal evolution of the precipitate morphology (represented using isosurfaces drawn at ) for normalized time and . In addition, adjacent to the isosurface representation, we present the corresponding precipitate morphology in the plane passing through the center of the box. As a result of the point effect of diffusion, the precipitate starts developing ears along directions (see ) i.e. protrusions along directions and depressions along and directions. Further ahead in time, the ears develop into prominent primary dendrite arms, whereas concavities develop on the faces of the cube. The composition evolution during the development of the dendritic structure is revealed in the last column of Table 1.
| Isosurface view | map | composition map | |
![[Uncaptioned image]](/html/2101.09964/assets/image1.png)
|
![[Uncaptioned image]](/html/2101.09964/assets/phi00005.png)
|
![[Uncaptioned image]](/html/2101.09964/assets/comp00005.png)
|
|
![[Uncaptioned image]](/html/2101.09964/assets/image2.png)
|
![[Uncaptioned image]](/html/2101.09964/assets/phi00015.png)
|
![[Uncaptioned image]](/html/2101.09964/assets/comp00015.png)
|
|
![[Uncaptioned image]](/html/2101.09964/assets/image3.png)
|
![[Uncaptioned image]](/html/2101.09964/assets/phi00025.png)
|
![[Uncaptioned image]](/html/2101.09964/assets/comp00025.png)
|
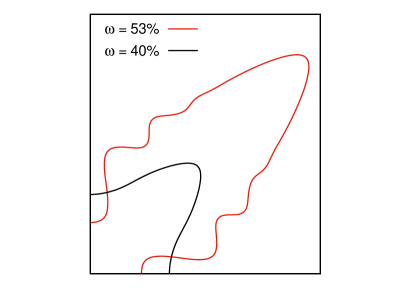
With an increase in the amount of the supersaturation, the precipitate grows faster into a dendritic shape. This can be seen in Fig. 3, where the precipitate with supersaturation , grows its arms faster along the directions giving rise to a dendrite-like morphology as compared to the one with supersaturation .
Typical solidification dendrites are characterized by a unique tip radius and velocity and a dendritic shape that is a function of the strength of the anisotropy. In the following, we perform a similar characterization of our morphologies. A usual characteristic of dendrites during solidification is that apart from the selection of a Peclet number, the product of the square of the dendrite tip radius with the velocity is also a constant. This constant is typically known as the microsolvability constant , where is the capillary length, D is the diffusivity, and and are the radius and the velocity of the dendritic tip respectively, that is either estimated using the linearized microsolvability theory as presented in [19] or using dynamical phase-field simulations [23]. We follow the latter route, where we derive the value of the selection constant as a function of the material parameters and supersaturation from the measured values of the dendrite-tip radius and velocity from our phase-field simulations.
Fig. 4 shows the variation of the selection constant as a function of time, scaled with the characteristic diffusion time. We find that the value of the selection constant has a transient where there is both an increase and decrease in the magnitude before settling into a regime where the values continue to change approximately linearly with simulation time. This linear regime initiates approximately when the primary arms have emerged as a result of the instability. This is quite different to dendrites in the presence of just interfacial energy anisotropy, where the value of becomes relatively constant (see Fig. 5) quite early in the simulation (just as the primary arms appear), even though the (Fig. 5) and (Fig. 5) themselves have not yet attained their steady state values. A similar variation is also seen in the Peclet number , where it continues to decrease approximately linearly with time, as depicted in Fig. 4 in the presence of elasticity, while a nearly constant value is attained for the dendrite with just interfacial energy anisotropy (see Fig. 5). Therefore, we also do not derive any steady state with respect to the shape of the tip as well as the velocity as highlighted in Figs. 4 and 4 respectively in the presence of elasticity.


Similar trends are also noticed for the 3D simulations as well. In 3D, we measure the dendritic tip radius () at different times by fitting the dendritic tip surface to a paraboloid of revolution. The tip position at different times is used to calculate the velocity () along the direction as this is the growth direction for . Similar to the 2D simulations, we calculate the microsolvability constant () and Peclet number at different times. Fig. 6 shows the temporal variation of and Fig. 6 depicts the variation of Peclet number as a function of scaled time. The values of and Peclet number continue to vary with time without the attainment of a steady state. Figs. 6 and 6 represent the variation of and as a function of scaled time that reveals that both of these quantities also do not achieve a steady state. The continues to increase, whereas continues to decrease with time, and the variation is similar in nature to that observed in the 2D simulations.


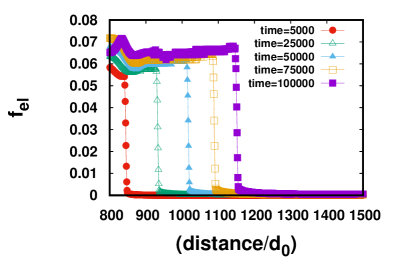
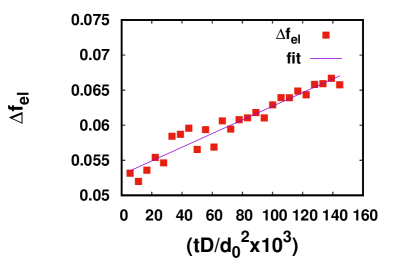
The reason for the non-attainment of a steady state is possibly linked to the variation of the jump in the value of the elastic energy at the interface. We have extracted the elastic energy along the direction normal to the dendrite-tip for different simulation times. From this, we calculate the jump in the elastic energy () by computing the difference in the values of the elastic energy on the precipitate side with the matrix side. For the 2D simulations, Fig. 7 highlights the variation of the elastic energy density as a function of time, while the jump in the elastic energy density at the interface is depicted in Fig. 7 that clearly shows an increase with simulation time.
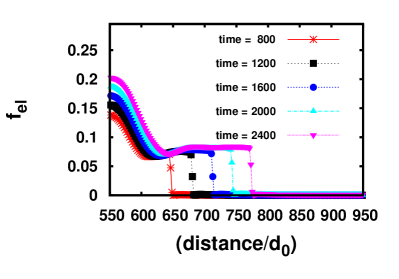
Similarly, for 3D, Fig. 8 depicts the variation of elastic energy density across the interface along direction at time , , , , and , while the jump of the elastic energy density at the interface in the direction is plotted in Fig 8.

We note that although the variation is small, this will, in turn, lead to the change in the interfacial compositions as a function of time. The reason for this is as follows: as the jump in elastic energy increases with time, the dendritic tip experiences varying elastic fields ahead of interface indicating an increasing contribution of elastic energy to the interfacial equilibrium conditions during the growth of precipitate. The increasing elastic contribution to the interfacial equilibrium conditions is countered by a decreasing curvature contribution. As a result, there is continuous increase in with increasing time. The decreasing curvature contribution possibly leads to a reduction in the point effect of diffusion, leading to slower interface dynamics that result in a continuous decrease of with time. Therefore, the Peclet number as well as the selection constant do not attain saturated values. This also means that the dendrite tip radius as well as the tip velocity never reach a steady state in contrast to the situation of dendritic growth in the presence of interfacial energy anisotropy with no elastic contribution. (e.g., dendritic growth during solidification). Therefore, in relation to the classical dendritic structures observed during solidification, the simulated structures may only be referred to as dendrite-like.
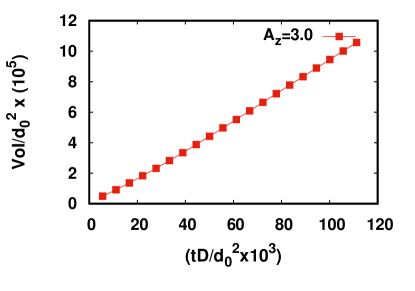
Although the variation of the at the dendrite tip will lead to a change in the interfacial compositions and thereby the Peclet number, the overall volume (area for 2D) still varies linearly with time (see Fig. 9). The linear temporal variation of the volume of precipitate suggests the parabolic law of diffusion-controlled growth of the precipitate.
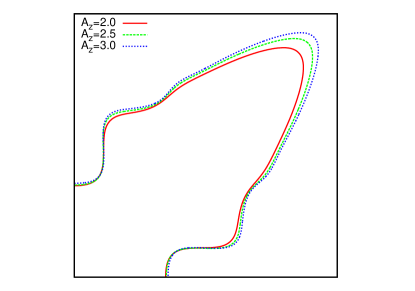
Further, we determine the effect of elastic anisotropy on the behavior of precipitate morphologies. For 2D situations, Fig. 10 shows the difference in the tip shapes as a function of at a normalized time=41700, where we plot only one of the symmetric quadrants for simplicity.
Fig. 10 shows that with increase in the strength of anisotropy in the elastic energy (), the radius of the tip of the precipitate reduces, i.e., the tip morphologies become sharper and elongated along directions, that is also revealed in the plots showing the dendrite tip radius in Fig. 11. Correspondingly, the velocities at the tip are also higher for larger values of as highlighted in Fig. 11.


The plot in Fig. 11 shows that the magnitude of consistently increases with normalized time after the initial transient, whereas the magnitude of increases with the strength of anisotropy in the elastic energy, i.e., at a given time. Similarly, Fig. 12 shows that the magnitude of increases with time for a given misfit strain. The plot also shows that, as the magnitude of the misfit strain increases, the value of the selection constant also becomes larger. There is no clear trend observable with the change in the velocities as seen in Fig. 12, while the tip radius reduces with increase in the value of the misfit strain as depicted in Fig. 12. Thus, there is no unique value of the selection constant at a given anisotropy strength of elastic energy and the magnitude of the misfit strain. While the variation of in the linear regime at a given time, is approximately linear with the variation of , it changes approximately as with the misfit strain (comparing values for a given time).


3D simulations were also performed for different values of for a supersaturation . Fig 13 represents the contour plot of in the plane at different levels of elastic anisotropy. The figure shows that as the anisotropy in elastic energy increases, the precipitate grows faster with a sharper dendrite tip. Figs. 14 and 14 reflects the same effect of decrease in and increase in with increase in , respectively. Here, too, we observe that and do not achieve a steady state value at all levels of . Fig. 14 shows the variation with the scaled time at different levels of . The microsolvability constant also does not achieve a steady state value over time at all levels of . The influence of the misfit-strain on the observed microstructures is depicted in Fig. 15 where the radius of the tip becomes sharper with an increase in the value of the misfit strain. Along with this, the velocity shows an increasing trend with higher values of the misfit strain as highlighted in Fig. 15. The selection constant on the other hand also increases with larger misfit, however no steady state is achieved as shown in Fig. 15.
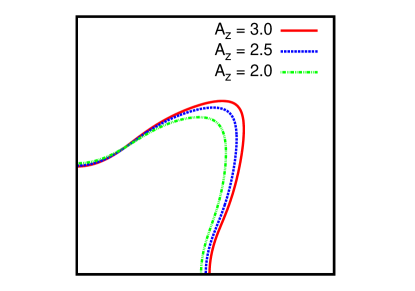


Fig. 16 depicts the effect of change in the degree of the supersaturation in the matrix, while the anisotropy in the elastic energy as well as the magnitude of the misfit strain are kept constant, i.e., and . The plots show that the radius of the dendritic tip becomes sharper (see Fig. 16) with increase in the magnitude of supersaturation whereas the velocity increases (see Fig. 16), but does not saturate. Similarly, the magnitude of the selection constant increases with time as shown in Fig. 16.


3D simulations with and and different supersaturations were also performed with similar conclusions. Fig. 17 reveal a decrease in the radius of the tip and a corresponding increase in the velocity Fig. 17 with increasing supersaturation. The 3D simulations were limited by domain size and we could not access supersaturations that are lower. The selection constant also shows a decreasing trend with higher supersaturations as revealed in Fig. 17.


5 Competition between anisotropies in the interfacial energy and elastic energy
In the previous section, we have seen the effect of different variables such as the variation of supersaturation, misfit strain and anisotropy in elastic energy on the evolution of the dendrite-like morphologies. In this section, we investigate the competition between the influence of anisotropies in the elastic and the interfacial energies. For brevity, we will only utilize 2D simulations in this section for investigating the competition between the two forms of anisotropy and the influence on the dynamics of the instability. The anisotropy in the interfacial energy is modeled using the function [21], Eqn. 3, which leads to the formation of dendrites aligned along the directions.
Here, we keep the anisotropy in elastic energy constant
and allow the strength in anisotropy in interfacial energy to vary
in the range of 0.0 to 0.03. Also, here we have considered two broad
categories with different magnitudes of elastic anisotropies, i.e.,
and . In the first case, as the magnitude of
is above one (similar to the case studied before),
the interfacial energy and the elastic energy anisotropies
lead to the formation of dendrites in
and directions
respectively, whereas, in the second case, for values of less
than unity, the anisotropies in the elastic energy and the
interfacial energy superimpose.
5.1 Case A: Strength of elastic anisotropy
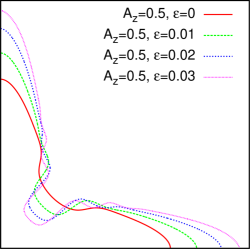
For this case where the anisotropies in the interfacial energy and elasticity lead to dendrite-like structures in different directions, the combined influence of anisotropies in both the energies gives rise to a precipitate shape which is nearly circular in the early stage of growth as shown in Fig. 18, at and .
But, with decrease in the strength of anisotropy in the interfacial energy from 0.03 to 0.0, the precipitate not only develops sharp corners but also shows strong alignment along directions, that is the elastically preferred direction. Fig. 19 compares the morphologies for different strengths of anisotropies in interfacial energy for a given value of at the normalized simulation time of .
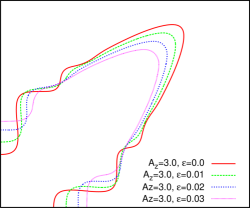
Fig. 20 depicts that as the interfacial energy anisotropy increases, the dendrite tip radius becomes larger while the velocity of the dendrite tip reduces as highlighted in Fig. 20.


Similarly, while the magnitude of again has a linearly increasing trend with simulation time (after the initial transient), the competition between the elastic energy anisotropy and the interfacial energy anisotropy leads to a decrease in the magnitude of at a given time of the evolution of the precipitate, which is expected as this is similar to the effective reduction of anisotropy in the system (see Fig. 20).
5.2 Case B: Strength of elastic anisotropy
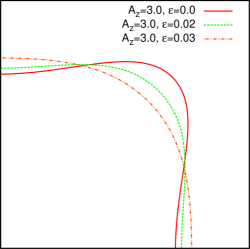
In the previous section, the effect of varying the anisotropy in interfacial energy at constant elastic anisotropy i.e. is elaborated. Here, we explore the results upon varying the interfacial energy anisotropy while keeping the elastic energy anisotropy having the magnitude below one i.e. . An exemplary simulation with the combination of both anisotropies is depicted in Fig. 21, where the arms of the dendrite are oriented along directions.
The change in the dendrite shapes upon variation in the strength of anisotropy in the interfacial energy is highlighted in Fig. 22. The superimposition of the two anisotropies leads to an effective increase in the anisotropy in the system.
Thus, with an increase in the magnitude of interfacial energy anisotropy, the precipitate tip becomes more sharper and elongated along directions, as highlighted in Fig. 23, while the dendrite tip velocity increases as the strength in anisotropy in the interfacial energy becomes larger (see Fig. 23).


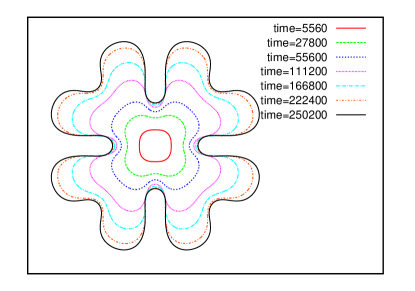
The variation of with a combination of different anisotropies is portrayed in Fig. 23, where for a given time of evolution, with increase in the strength of anisotropy in the interfacial energy the magnitude of increases. Finally, in order to show that anisotropy in either the interfacial energy or the elastic energy is required for the formation of dendrite-like structures, we consider the case of isotropic elastic and interfacial energies with the supersaturation at . As the precipitate grows in size, the instabilities at the interface trigger to give rise to a seaweed type structure (see Fig. 24), without the selection of a unique tip direction or shape. This situation can also occur for cases where the influences of the elastic energy anisotropy and the interfacial energy anisotropy cancel each other for a certain combination of their respective strengths.
6 Conclusions and Outlook
We have systematically characterized the evolution of dendrite-like shapes as a function of elastic parameters such as the misfit strain, Zener anisotropy parameter , supersaturation in two and three dimensions. Although we notice the occurrence of solid-state morphologies that resemble dendrites typically occurring during solidification, in the presence of coherency stresses, the shapes of the tip as well the tip velocity do not achieve a steady state. Moreover, the selection constant increases linearly with simulation time for all the simulation conditions, which is in contrast to the dendrites derived just in the presence of interfacial energy anisotropy. This lack of steady state is due to a continuous change in the value of the jump in the elastic energy at the tip of the dendrite-like morphology, that increases as the shape of the tip evolves with time. Consequently, the interfacial compositions as well as the Peclet number do not saturate. Thus, in the classical sense, in the presence of coherency stresses, while the presence of anisotropy leads to the propagation of instabilities in well defined directions, there is no selection of a unique tip shape as in the case of solidification. Therefore, structures derived in solid-state in the presence of elastic anisotropy may only be referred to as dendrite-like.
Future directions of study involve understanding the influence of inhomogeneity in elastic moduli, combination of anisotropies in both the misfit strain and the elastic energy on the tip dynamics and shape. Additionally, in multi-component alloys, the relative diffusivities of the different elements can lead to widely different dendritic shapes as the effective capillary length may change appreciably. Therefore, the relative ratio of the diffusivities becomes an important parameter whose influence on the instability needs to be established in alloys with three or more components. Finally, while we have discussed only precipitate growth, the model is generic and may be utilized for studies of late-stage coarsening, where an extension to multi-component alloys will again bring in exciting new possibilities.
Data availability
The data that supports the results of this study are available from the corresponding author upon reasonable request.
Acknowledgement
We (BB, TJ, SB, AC) thank the financial support from Department of Science and Technology (DST), Government of India (GOI), under the project TMD/CERI/Clean Coal/2017/034. TJ and SB also acknowledge financial grants and computational support under the project S&T/15-16/DMR-309.01 from DMRL, DRDO, GOI.
Appendix A Elastic free energy density
Eqn. 9 gives the elastic free energy density, which includes several prefactors, i.e., . These prefactors are dependent on particular values of elastic constant in respective phases, i.e., the precipitate and matrix. Their expressions are as follows: Here .
References
- [1] W. Kurz, D. Fisher, Fundamentals of solidification, trans. tech. publ. (1984).
- [2] J. S. Langer, Instabilities and pattern formation in crystal growth, Reviews of modern physics 52 (1) (1980) 1.
- [3] J. Langer, Lectures in the theory of pattern formation, Chance and matter (1987) 629–711.
- [4] D. A. Kessler, J. Koplik, H. Levine, Pattern selection in fingered growth phenomena, Advances in physics 37 (3) (1988) 255–339.
- [5] P. Pelce, A. Libchaber, Dynamics of curved fronts (2012).
- [6] W. Kurz, R. Trivedi, Overview no 87 solidification microstructures: Recent developments and future directions, Acta Metallurgica et Materialia 38 (1) (1990) 1–17.
- [7] R. Trivedi, W. Kurz, Dendritic growth, International Materials Reviews 39 (2) (1994) 49–74.
- [8] R. Trivedi, W. Kurz, Solidification microstructures: A conceptual approach, Acta metallurgica et materialia 42 (1) (1994) 15–23.
- [9] Y. Yoo, D. Yoon, M. Henry, The effect of elastic misfit strain on the morphological evolution of gamma prime-precipitates in a model ni-base superalloy, Metals and materials 1 (1) (1995) 47–61.
- [10] R. Doherty, Physical metallurgy (1983) 933–1030.
- [11] S. W. Husain, M. S. Ahmed, I. Qamar, Dendritic morphology observed in the solid-state precipitation in binary alloys, Metallurgical and Materials Transactions A 30 (6) (1999) 1529–1534.
- [12] Y. Yoo, Morphological instability of spherical gamma prime precipitates in a nickel base superalloy, Scripta materialia 53 (1) (2005) 81–85.
- [13] A. N. Khan, I. Salam, A. Tauqir, Formation of solid-state dendrites in an alloy steel, Surface and Coatings Technology 179 (1) (2004) 33–38.
- [14] P. H. Leo, R. Sekerka, The effect of elastic fields on the morphological stability of a precipitate grown from solid solution, Acta metallurgica 37 (12) (1989) 3139–3149.
- [15] W. W. Mullins, R. F. Sekerka, Morphological stability of a particle growing by diffusion or heat flow, Journal of applied physics 34 (2) (1963) 323–329.
- [16] D. A. Kessler, H. Levine, Velocity selection in dendritic growth, Physical Review B 33 (11) (1986) 7867.
- [17] D. A. Kessler, J. Koplik, H. Levine, Steady-state dendritic crystal growth, Physical Review A 33 (5) (1986) 3352.
- [18] A. Barbieri, D. C. Hong, J. Langer, Velocity selection in the symmetric model of dendritic crystal growth, Physical Review A 35 (4) (1987) 1802.
- [19] A. Barbieri, J. Langer, Predictions of dendritic growth rates in the linearized solvability theory, Physical Review A 39 (10) (1989) 5314.
- [20] M. Greenwood, J. J. Hoyt, N. Provatas, Competition between surface energy and elastic anisotropies in the growth of coherent solid-state dendrites, Acta Materialia 57 (9) (2009) 2613–2623.
- [21] A. Karma, W.-J. Rappel, Quantitative phase-field modeling of dendritic growth in two and three dimensions, Physical review E 57 (4) (1998) 4323.
- [22] S. Bhattacharyya, T. Abinandanan, Evolution of multivariant microstructures with anisotropic misfit: A phase field study, Acta Materialia 57 (3) (2009) 646–656.
- [23] A. Karma, W.-J. Rappel, Phase-field method for computationally efficient modeling of solidification with arbitrary interface kinetics, Physical review E 53 (4) (1996) R3017.