Connecting glass-forming ability of binary mixtures of soft particles to equilibrium melting temperatures
Abstract
The glass-forming ability is an important material property for manufacturing glasses and understanding the long-standing glass transition problem. Because of the nonequilibrium nature, it is difficult to develop the theory for it. Here we report that the glass-forming ability of binary mixtures of soft particles is related to the equilibrium melting temperatures. Due to the distinction in particle size or stiffness, the two components in a mixture effectively feel different melting temperatures, leading to a melting temperature gap. By varying the particle size, stiffness, and composition over a wide range of pressures, we establish a comprehensive picture for the glass-forming ability, based on our finding of the direct link between the glass-forming ability and the melting temperature gap. Our study reveals and explains the pressure and interaction dependence of the glass-forming ability of model glass-formers, and suggests strategies to optimize the glass-forming ability via the manipulation of particle interactions.
Introduction
In studies of glass transition and jamming transition debenedetti ; berthier1 ; liu ; ohern ; torquato , binary mixtures of particles are widely employed to avoid crystallization. If the two components mix up randomly, the particle size mismatch can frustrate the global structural order tanaka . However, under certain circumstance, some binary mixtures may undergo phase separation or demixing during the solid formation, i.e., the same types of particles aggregate. Although undesirable in disordered systems, phase separation has attracted much attention in many fields bates ; moreo ; biben ; jaeger ; erlebacher ; balazs ; palacci ; lipilong .
The glass-forming ability (GFA), i.e., the capacity of a material to resist crystallization and maintain glassy, is fundamental in studies of glasses. A binary mixture prone to phase separation tends to form crystallites of the same type of particles, and hence has a poor GFA. Because glasses are diverse and out of equilibrium, it is difficult to establish a common understanding of the GFA. Moreover, phase separation is one of the multiple forms of crystallization. Under certain conditions, binary mixtures can also form complex crystalline or quasicrystalline structures laves ; qc , which complicates further the understanding of the GFA to fight against them. Among various interpretations, geometric and energetic frustrations are thought to be essential to the determination of the GFA xi ; liy ; fujita ; bendert ; wu ; ninarello ; tanaka_prx .
For binary mixtures, varying the size ratio of the large to small particles is an effective way to cause geometric frustration. However, it has been shown that a large often promotes phase separation and thus results in poor GFAs for binary mixtures of hard particles, mainly arising from entropy effects biben ; biben1 ; dijkstra ; dijkstra1 ; dinsmore ; imhof ; frenkel . To suppress phase separation, a moderate size ratio, , is usually adopted. However, it is still unclear if such ratios can prevent phase separation and maintain glassy states after extremely long equilibration. Even with these size ratios, the GFA is sensitive to the particle composition. It has been suggested that the GFA of binary mixtures is the best near the eutectic point or triple point when particle composition is varied tanaka_prx .
In this work, we pay more attention to the energetic frustration on the GFA by studying binary mixtures of soft particles interacting via finite-range repulsions. In the zero temperature () and zero pressure () limit, such soft particles behave like hard ones xu ; wangxipeng . Taking a mixture in the hard particle limit as the reference, which has a decent GFA with certain values of particle size ratio and composition, we vary the pressure (density) and track the evolution of the GFA. When pressure increases, the potential energy plays a more important role and offers soft particles extra opportunities of phase separation. With the intervention of potential energy, the particle size ratio , the cause of geometric frustration, may excite and affect energetic frustration as well and hence affect the GFA. We aim at looking for some simple energetic criteria of the GFA and proposing some energy strategies to manipulate it, via the study of the effects of pressure and particle interaction.
We study two types of widely employed model glass-formers, binary mixtures of soft particles interacting via harmonic or repulsive Lennard-Jones (RLJ) repulsion. Both types of systems with a diameter ratio and a 50:50 particle composition have been used in many studies of glasses. At low pressures, both systems exhibit a pressure independent GFA, equal to that of the hard particle counterparts. At high pressures, the GFA of RLJ systems still remains almost constant, but remarkable phase separation occurs in harmonic systems. Therefore, does cause not only geometric but also energetic frustrations in soft particle systems. By performing analytic calculations, we find that the behaviors of the GFA can be explained by the pressure dependence of the melting temperatures of the two components, confirmed by our simulation results. This thus builds up a bridge between non-equilibrium and equilibrium quantities and suggests that the pressure dependence of the melting temperatures of constituent components can be an energetic precursor to evaluate the GFA of glass-formers. We also show that the GFA of the hard particle limit can be achieved at high pressures by a proper modulation of the particle stiffness. Combining our work and previous studies on the composition effects tanaka_prx , we expect to achieve a much more comprehensive understanding of the GFA of binary mixtures with effects of composition, pressure, and particle interaction being all included.
Results
Control variables of binary mixtures. We denote the two types of particles in binary mixtures as and particles. The particle composition is quantified by the concentration of particles, , with and being the numbers of and particles, respectively. There are two quantities to make the constituent and particles different. One is the particle size. When the diameter ratio , and particles differ in size, where and are diameters of and particles, respectively. The other is the particle stiffness, characterized by the interaction energy scale and as defined in Eqs. (17) and (18) of the Methods section. particles are softer than particles if . Here we manipulate the particle stiffness by letting and with . One of our primary goals is to study and understand the pressure dependence of the GFAs of widely employed model glass-formers with , , and (). This manipulation of particle stiffness can facilitate the analytic calculations with being an independent variable, from which the solutions of can be straightforwardly obtained.
In a rather different perspective from most of the previous studies, we are mainly concerned about the effects of pressure and particle interaction on the GFA. Here we mainly show results of systems in two dimensions. Because the simulations are rather expensive, we have only repeated part of the simulations for larger systems and three-dimensional systems and find consistent results. In the following, we will first present results for harmonic and RLJ systems with , , and . Then we will attack the special case with and . By varying , we are able to sort out potential energy effects without the interference of geometric frustration caused by the particle size distinction. Based on observations of , we will derive a generalized picture for , from which the results of systems with , , and can be understood. Finally, we will show that the same picture applies to different values of .
Characterization of glass-forming ability. For given values of , , , and , we start with a liquid equilibrated at about four times of the melting temperature of particles as defined later, and then decrease the temperature by a small step and relax the system for a duration by performing molecular dynamics simulations under constant temperature and pressure. The same procedure is repeated until a solid-like state at a temperature about one-tenth of the melting temperature is achieved. This leads to a quench rate . We compare the GFAs over a wide range of pressures, which have been rarely studied before. It is tricky how to choose a reasonable quench rate to include the pressure effects. Here, we use a dimensionless quench rate as defined and discussed in the Methods section, in purpose of giving supercooled liquids at different pressures comparable opportunities to relax their structures.
In the parameter space considered in this work, we have not observed the formation of complex crystalline structures within our simulation time window, so the crystallization mainly takes the form of phase separation tanaka_prx . Therefore, the GFA can be well characterized by the degree of mixing of and particles against phase separation in the resultant solid-like states, which is quantified here by the parameters
| (1) |
where the sum is over all or particles, is the Kronecker delta, is the number of nearest neighbors of particle , and is the number of nearest neighbors which are the same type as particle . We calculate and for and particles separately. Their values are close to when two components mix up well. With more particles being separated, the values grow up and approaches for well-separated states. Therefore, smaller values of and mean better GFAs.
Although and can characterize the GFA well in our work, we should realize that they may not work well to distinguish glasses and complex crystals with and particles being mixed laves ; qc . This is the limitation of the parameters when studying the GFA against the formation of complex crystals. In that case, one needs to select appropriate parameters to characterize the structural order to distinguish complex crystals from amorphous solids, which is out of the scope of current work.
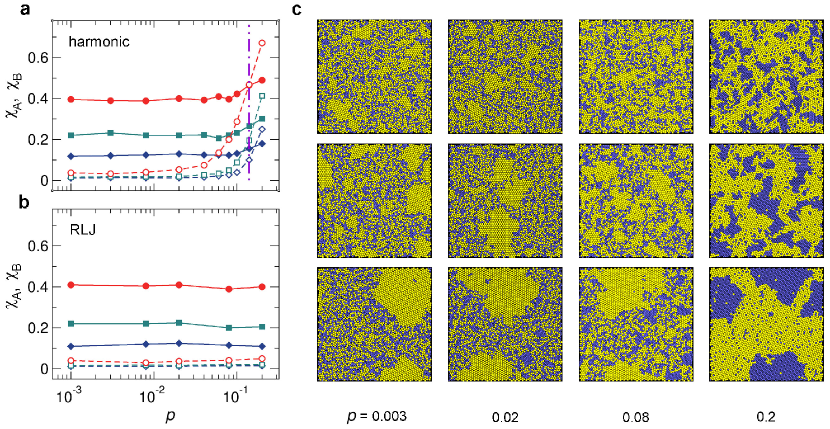
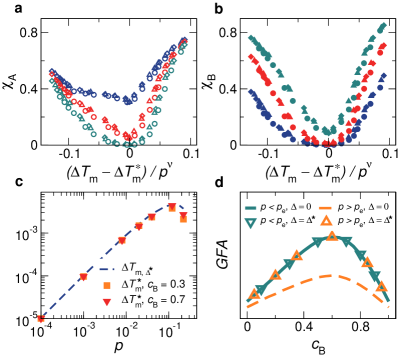
Glass-forming ability for and with . Figures 1a and 1b compare the GFAs of binary mixtures of harmonic and RLJ particles in two dimensions with , , and , so there is no cause of strong energetic frustration. These binary mixtures have been widely employed as good glass-formers in previous studies.
In the and limit when particle overlap is tiny, both harmonic and RLJ systems are equivalent to hard particle systems xu ; wangxipeng and exhibit similar GFAs to that of the hard particle counterpart with and . As shown in Figs. 1a and 1b, both and tend to approach a constant at low pressures for both systems.
Because of aging, and evolve with the quench rate . Figure 1 compares three values of . At low pressures, (for small particles) remains small when decreases, while (for large particles) grows up. As illustrated by snapshots in Fig. 1c, particles form clusters when is small, even at low pressures. It is expected that with even smaller the clustering or phase separation will be stronger. Here and particles have the same concentration. The separation can be weakened by increasing to around tanaka_prx in order to leave smaller rooms for particles to aggregate, as will be shown later, but it remains elusive whether the separation is inevitable as long as the waiting time is sufficiently long berthier_order ; torquato1 .
The decrease of at fixed pressure is analogous to the decrease of the compression rate at fixed temperature. The emergence of phase separation at low pressures thus suggests that with sufficiently slow compression rates binary mixtures of hard particles with and will undergo phase separation. Therefore, we show direct evidence suggesting that such binary mixtures widely employed as good glass-formers cannot prevent phase separation, so that thermodynamically-stable states may be phase-separated.
Figure 1 also shows that, although behaving similarly at low pressures, harmonic and RLJ systems have significantly different GFAs at high pressures. The GFA of RLJ systems still remains almost constant in pressure. In contrast, harmonic systems undergo apparent phase separation, with increasing quickly when pressure increases. Apparently, at high pressures, some energetic frustration is excited strongly in harmonic systems, destabilizing the mixing of particles. The particle size distinction triggers such energy effects. Moreover, note that harmonic and RLJ systems have almost identical GFAs up to , which is already far beyond the hard particle limit where particle interactions are not negligible. Then it is interesting to know why harmonic and RLJ systems can have similar GFAs beyond the hard particle limit, why RLJ systems can maintain an almost constant GFA to high pressures, and why the GFA of harmonic systems quickly drops at high pressures.
Harmonic and RLJ repulsions are distinct in their respectively bounded (soft-core) and unbounded natures. The soft-core nature of harmonic repulsion induces rich phase behaviors at high densities pamies ; miller ; zu ; xu_cjps ; miyazaki . Unlike RLJ particles whose melting (crystallization) or glass transition temperature always increases with the increase of pressure khrapak ; berthier ; wanglijin ; pedersen ; ingebrigtsen , harmonic particles exhibit reentrant liquid-solid transitions with the transition temperatures being non-monotonic in pressure and some related extraordinary phenomena pamies ; zu ; zu1 ; xu_cjps ; wanglijin1 ; berthier2 ; zhao ; schmiedeberg ; likos . We will show that it is just this non-monotonic behavior that makes harmonic systems to have dramatically distinct GFA from RLJ systems.
Melting temperature gap between components. In this subsection, we will introduce two effective melting temperatures, and , for and particles, respectively. We will see that they are not the actual equilibrium melting temperatures, which should be obtained from complicated calculations of the equilibrium phase diagram and would vary with tanaka_prx ; russo_prl . They are instead derived from the equilibrium melting temperature of mono-component systems and the simple conversion of units. However, they turn out to work well to characterize the GFA.
An interesting feature shown in Fig. 1a is that and of harmonic systems intersect at roughly the same pressure at different quench rates. When , , so particles are easier than particles to form clusters. When , . The clustering or nucleation starts below the melting temperature. If , particles may experience a longer time than particles to nucleate, suggesting that the melting temperature of particles is higher, and vice versa. Therefore, we doubt whether Fig. 1a implies that particles have a lower (higher) melting temperature than particles when (). If this is the case, melting temperature would play an important role in the determination of the GFA, but the question is how and particles can feel different melting temperatures in the same mixture.
Note that temperature is the energy, and we are concerned about pressure effects. As defined in the Methods section, for two-dimensional mixtures, the temperature and pressure are in units of and , respectively. However, and particles also have their own temperature and pressure units, which are and for particles and and for particles, respectively. Therefore, in the mixture at a pressure in units of , and particles effectively feel different pressure values, and , in their own units:
| (2) |
| (3) |
Let us denote as the melting temperature of mono-component systems, i.e., when and so that and particles are identical. In the mixture, since and particles feel different pressures in their own units, the corresponding melting temperatures are and , respectively. In the common units of , the melting temperatures that and particles feel are thus
| (4) |
| (5) |
This leads to a melting temperature gap
| (6) |
Apparently, both and can affect . Note that there is a special case: When is linear, i.e., with being the system-dependent coefficient,
| (7) |
so the melting temperature gap is no longer a function of . We will see later that such a linear behavior is crucial to the understanding of the pressure and interaction dependence of the GFA.
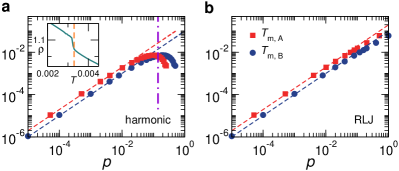
Given , Eq. (4) indicates that can be obtained by multiplying the pressure and temperature of curve by and , respectively. Correspondingly, Eq. (5) shows that can be obtained by multiplying the pressure and temperature of curve by and , respectively. For the cases shown in Fig. 1 with and , we have and . Figure 2 shows the melting temperatures against pressure for both harmonic and RLJ systems with and . In the log-log scale, is obtained by just shifting the curve horizontally by an amount of , while is the same as . If monotonically increases with , is always larger than , as shown in Fig. 2b for RLJ systems. If is non-monotonic, and may intersect. As shown in Fig. 2a, of harmonic systems is non-monotonic in , so at . In Fig. 1a, we display this pressure as the vertical dot-dashed line. Interestingly, it roughly agrees with at which .
This agreement indicates that our hypothesis that the difference between and , as shown in Fig. 1, is related to the difference between melting temperatures felt by and particles is valid. This is further supported by RLJ systems. For RLJ systems, is always larger than because monotonically increases, consistent with the fact that is always larger than , as shown in Fig. 1b.
Although and are not the actual equilibrium melting temperatures, the concurrence of and at for harmonic systems suggests that defined here at least qualitatively reflects the correct pressure evolution of the gap between equilibrium melting temperatures. This can also be seen from the resultant solid-like states visualized in Fig. 1c. For harmonic systems at , and strong phase separation occurs. From the crystallization mechanism, the liquidus line is in coexistence with the -solid. When , particles crystallize, while particles can crystallize until . For phase-separated states obtained from finite quench rates, this sequence of the two-step crystallization would result in purer -solids than -solids, i.e., isolated () particles are poor (rich) in -solids (-solids), as shown by the snapshots at in Fig. 1c. The snapshots at other pressures show the opposite behavior when and .
Seen from Fig. 2, another interesting and important feature is that at low pressures for both harmonic and RLJ systems. The melting temperature curves deviate from linear at high pressures, where harmonic and RLJ systems exhibit significantly different GFAs. The comparison between Figs. 1 and 2 shows that the GFAs maintain almost constant at fixed dimensionless quench rate roughly in the pressure regime where is linear. Then the question is whether this is just a coincidence or implies some underlying correlations.
Mixing and demixing for and . In this work, we focus on the potential energy effects on the GFA. Therefore, before understanding the results of systems with , , and , we would like to discuss first a simpler case with and , so that and particles have the same size and geometric frustration induced by particle size difference is absent. Then, it would be clearer to sort out the underlying physics of the evolution from mixing to demixing of two types of particles with only energetic frustration being involved, which provides us with crucial clues to understand the case. In the next subsection, we will show that the findings for can be generalized to .
With the variation of , and particles have different stiffness, leading to energetic frustration affecting the mixing of particles. Because of the trivial symmetry of , now we only need to vary from to . When , and particles are trivially the same and should statistically mix up well. When increases from , the distinction in particle stiffness leads to the variation in particle overlap, in analogy to the evolution with the growth of tonghua . It is thus expected that phase separation will occur when is large.
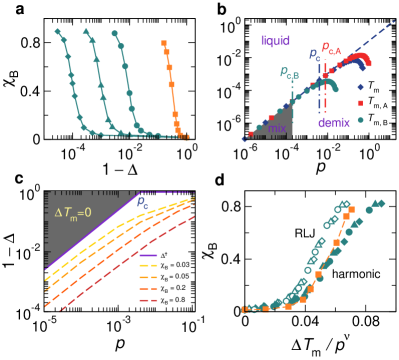
Figure 3a shows examples of of the resultant solid-like states at different pressures and a fixed dimensionless quench rate for harmonic systems. behaves similarly to , so we do not show it here. In this and the next subsections, because we extend the pressure to much lower values, to use the same dimensionless quench rates as in Fig. 1 is far beyond our computational capacity. Therefore, we use faster . We have verified (not shown here) that the results to be presented are reproducible with different values of . At fixed pressure, Fig. 3a shows that there is a crossover below which remains small and constant. When , grows up, so signals the onset of phase separation. Figure 3a also shows that increases when pressure decreases.
The appearing consistency between the constant GFA at low pressures and the linear as discussed in the previous subsection stimulates us to investigate whether the emergence of phase separation at is also correlated with the linearity of . Figure 3b shows an example of the temperature-pressure phase diagram of harmonic systems with . Here we draw together with and . Seen from Eqs. (4) and (5), when , and are simply obtained by shifting the curve in both horizontal and vertical directions simultaneously by the same amount of and , respectively, in the temperature-pressure plane with log-log scale. In Fig. 3b, we denote as the crossover pressure above which becomes nonlinear. Here, we set at which deviates from linear by . Correspondingly, Eqs. (4) and (5) indicate that and become nonlinear at and , respectively , when . Because , and collapse and are both linear when . Seen from Eq. (7), the melting temperature gap when , and otherwise. Therefore, in the pressure regime where , sets a crossover
| (8) |
below (above) which (). In the pressure regime where , any nonzero leads to , so . Note that both and increase when pressure decreases. It is then natural to ask whether they are related.
Figure 3c shows together with the iso- contours for harmonic systems at fixed . With the decrease of , the contours approach . The contours may shift upward gradually with the decrease of . With current computational capacity, we expect from Fig. 3c that agrees with . Next, we will show that this expectation is valid.
At fixed pressure, the melting temperature gap is the function of , as shown by Eq. (6). Therefore, shown in Fig. 3a can be converted to . This functional relation establishes the connection between the GFA characterized by and the melting temperature gap for . Figure 3d shows curves at different pressures for both harmonic and RLJ systems. At all pressures, has a minimum when . With the increase of , increases and phase separation emerges. Interestingly, in the pressure regime where and is linear, all curves can collapse nicely onto the same master curve, when is plotted against with for both harmonic and RLJ repulsions. Figure 3d also shows that the scaling collapse stops working when , highlighting the important role of the linear .
The scaling collapse indicates that at different pressures lower than , in order to reach the same degree of particle mixing or demixing, the variation of particle stiffness () needs to cause a melting temperature gap proportional to pressure. In this pressure regime, is always linear, i.e., . From Eq. (6), we have
| (9) |
when and . The right hand side of Eq. (9) is constant in pressure for a given . Because is nonlinear when (so is on the right hand side of Eq. (9)), must be a constant. This leads to
| (10) |
where is a -dependent prefactor. Equation (10) sets the pressure dependent values of to reach the same at . Note that in Eq. (8) shows exactly the same form of pressure dependence. Therefore, Eq. (8) is actually a direct consequence of the scaling collapse in the limit. On the other hand, defined above follows Eq. (10) as well, corresponding to the minimum where . Therefore, the scaling collapse naturally suggests that . Consequently, for , phase separation can occur at a given pressure only when and .
Equation (8) also indicates that when , so and particles cannot feel the existence of each other. In the limit, as long as and there are still repulsions among particles, and particles become identical hard particles when and there will be no phase separation. This is consistent with our argument, because it is impossible to cause in the limit.
Glass-forming ability for and . Inspired by the results of , in this subsection, we will generalize the connection between () and to . The results of are thus naturally incorporated into the generalized picture. Our arguments will be examined by simulation results of and without loss of generality. The observations of systems with , , and presented above will then be explained. Here we also vary as done for . Because and and particles have different sizes, and apparently correspond to two different systems. We thus need to restore the range of to .
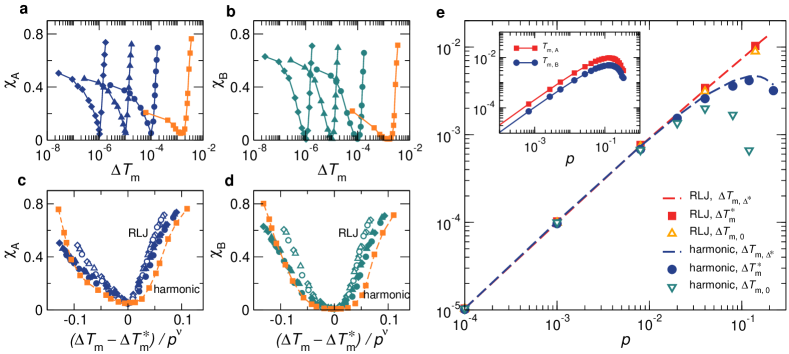
According to Eq. (6), at fixed pressure , the melting temperature gap varies with , so we are able to establish the functional relation between the GFA and . Figures 4a and 4b show and for harmonic systems with and at different pressures and a given dimensionless quench rate . All curves reach the minimum at . In contrast to for which , is nonzero and varies with pressure for .
Analogous to , Figs. 4c and 4d show that for both harmonic and RLJ systems and curves at different pressures lower than can also collapse onto the same master curves, when and are plotted against with . Therefore, the scaling collapse shown in Fig. 3d for is just a special case with . When , the scaling collapse breaks down.
For , we have also shown that there is a range of where , i.e., . Then it is natural to ask whether there also exists a range of within which for . Another interesting question is what determines .
Because is linear when , according to Eqs. (6) and (7), at a given , there indeed exist a range of within which is constant, as long as both and are still linear. As shown in Fig. 2, leads to the separation of and when . When varies from , and curves in Fig. 2 will shift in both horizontal and vertical directions simultaneously by the same amount of and , respectively, in the log-log scale. According to Eqs. (4) and (5), at a given , or become nonlinear when is below
| (11) |
or above
| (12) |
In the limit, and approach and , respectively, consistent with our previous discussions for . At low pressures, is apparently larger than . When at a given , remains constant. If such a constant is , the scaling collapse shown in Figs. 4c and 4d also validates that and are the onsets of the growth of and and the weakening of the GFA, as observed for .
With the increase of pressure, and approach each other, until arriving at a critical pressure
| (13) |
where
| (14) |
When , any variation of normally causes the change of , so there is no interval of within which remains constant. Therefore, the condition used above should be generally modified to . When , Eqs. (11)-(14) lead to exactly the same results as shown in the previous subsection, with , , and . For , corresponds to the best mixing of particles with at all pressures. Is it possible that defined in Eq. (14) sets for as well?
When plugging in , Eqs. (4) and (5) turn to
| (15) |
| (16) |
Interestingly, , so in the log-log scale is obtained by simply shifting upward by an amount of . Then both and become nonlinear when .
In the inset of Fig. 4e, we show and for harmonic systems with and . In the log-log scale, they are parallel along the vertical direction. We calculate the melting temperature gap at . Surprisingly, it agrees well with over the whole range of pressures studied and for both harmonic and RLJ systems, as shown in Fig. 4e. This agreement confirms our conjecture that there exists a pressure-independent at which the GFA or the degree of particle mixing is the strongest, equal to that of the hard particle counterpart. When , any deviation of from causes and the weakening of the GFA. When , lies in the interval of , within which and the GFA can maintain the best.
Now we are able to understand the results of systems with , , and discussed earlier. From Eqs. (11) and (12), we can see that lies in when , so the GFA can maintain the best. When , lies outside of and is away from when . Therefore, , the melting temperature gap with , deviates from and the GFA becomes worse. How much deviates from determines how worse the GFA becomes. Figure 4e also compares with . At low pressures, they agree very well, as expected. At high pressures, deviates from . For RLJ systems, the deviation is small, so the GFA is still close to the best. In contrast, for harmonic systems, the deviation significantly increases with the increase of pressure, so the GFA becomes much worse and remarkable phase separation occurs. The more essential reason of such a distinction between harmonic and RLJ systems is that harmonic systems have a much more nonlinear .
Seen from Figs. 4a-4b, the minimum values of and with are almost constant in pressure. This explains why the GFA remains constant at low pressures for harmonic and RLJ systems with , , and . More interestingly, this suggests that the GFA of hard particle systems can be maintained to high pressures far beyond the hard particle limit, by properly modulating the particle interactions and causing the interplay between geometric and energetic frustrations. To apply in Eq. (14) is one solution for binary mixtures, which should work generally for other types of particle interactions.
Dependence on . In previous subsections, we have focused on . Figure 5 verifies that our major findings of the pressure and particle interaction effects on the GFA hold for other values of . For given , , and , we tune and vary the melting temperature gap , exactly as done for .
In this subsection, we take harmonic systems with as the example. As shown in Figs. 5a and 5b, for and , and reach the minimum at a pressure-dependent . Curves of and at different pressures lower than defined in Eq. (13) can collapse well when plotted against with . Therefore, as for , the GFA of the hard particle limit can be sustained with the increase of pressure, as long as remains linear.
Figure 5c reproduces the agreement between and at for and , as shown in Fig. 4e for . For all values of studied, leads to a equal to when , as already discussed for in the previous subsection. Therefore, can maintain the GFA of the hard particle limit until , above which the GFA becomes weaker. However, when , Figs. 4e and 5c show that , so the GFA of the hard particle limit can be maintained over a wide range of pressures and beyond .
Seen from Figs. 5a and 5b, a remarkable change with is the variation of the minimum values of and , reflecting the variation of the GFA of the hard particle limit with . The GFA can be approximately quantified by . Figures 5a and 5b suggest that the GFA of is apparently weaker than those of and , while the GFAs of and are similar with that of seeming a little bit stronger. The GFAs in the and limits are trivially the weakest. We also find (not shown here) that the best GFA associated with the minimum occurs between and .
The evolution of the GFA with the increase of characterized in our work is consistent with previous results of binary mixtures of hard disks with from the calculations of the interface energy tanaka_prx . Based on our results, we can now qualitatively extend the dependence of the GFA to various pressures. In Fig. 5d, we schematically plot the GFA against for different pressures and for and , respectively. For , it can be expected that the GFA() curve of the hard particle limit can be maintained until . When and the GFA becomes weaker, the whole GFA curve will shift down with the increase of pressure. For , we would expect that the GFA() curve of the hard particle limit can be maintained beyond .
In the perspective of the empirical argument of the connection between the GFA and eutectic point, the GFA can be evaluated from the depression of the equilibrium melting temperature with the variation of tanaka_prx ; tanaka . However, the argument may not be easily applied to compare the GFAs at different pressures or densities, purely from the comparison of melting temperatures. One may then suggest to perform the calculations of the equilibrium phase diagram and the energy barriers (and the rate) of the nucleation of corresponding crystals to evaluate the GFA, as done for binary mixtures of hard disks tanaka_prx ; russo_prl . Because we have multiple parameters, , , and at fixed , it would be a rather difficult task.
Here we realize the comparison of the GFAs over pressures, interactions, and particle compositions in a much simpler way. The key is the finding of the underlying connection between the GFA and the -independent melting temperature gap between species derived from the simple conversion of units. The melting temperatures adopted here are not the actual ones from direct simulations or calculations of equilibrium systems, which should depend on not only but also for given and , but they turn out to work well to reveal the pressure and interaction dependence. Another important finding is , which suggests an energy strategy to fight against the weakening of the GFA caused by the softness of particles.
Although we do not show exact results of the equilibrium phase diagram and melting temperatures in the complicated parameter space, the schematic plots in Fig. 5d already to some extend indirectly reflect the pressure and interaction evolution of the equilibrium phase diagram in the plane. It would be expected that when the phase diagrams at various pressures look similar for and , only that the melting temperatures grow linearly with the pressure. When , the phase diagram starts to deviate for , while the similarity may be still maintained for .
Discussion
By investigating the pressure and interaction dependence of the GFA, we find similarities and distinctions between two types of widely studied model glass-formers, binary mixtures of harmonic and RLJ particles with , , and . We focus on the energetic frustration, taking the hard particle limit as the reference. For a given , the GFA is the best in the hard particle limit, purely determined by geometric frustration. The involvement of the potential energy normally weakens the GFA of hard particles. We find that the GFAs of both harmonic and RLJ systems remain constant and identical at low pressures, but bifurcate at high pressures. In contrast to RLJ systems which still maintain an almost constant GFA at high pressures, significant phase separation occurs in harmonic systems.
With the variation of both and , we come up with a generalized picture, which explains the pressure and interaction dependence of the GFA. Our major findings include i) the non-equilibrium GFA of binary mixtures of soft particles is connected to the equilibrium melting temperature, ii) the GFA of the hard particles can be maintained to high pressures with a proper modulation of the particle interaction such as using in Eq. (14), and iii) melting temperatures more linear in pressure are better to suppress phase separation and maintain a good GFA. We find that these results are valid for different values of . In combination of the dependence studied as well in previous approaches and the pressure and interaction dependence studied in this work, we are able to have a much more comprehensive picture of the GFA of binary mixtures of soft particles. Harmonic and RLJ potentials studied here are rather different, but their behaviors can both be understood by the same picture. Moreover, the derivations in this work do not aim at any specific interaction. Therefore, we expect that our findings are valid to other types of interaction.
Note that in this work , , and are connected by the variable and are thus not independent. Therefore, the major conclusions made here may not be directly generalized to other conditions, for example, when all three ’s are independence of each other. However, the robust and consistent evidence shown in this work suggests that the underlying connections between the GFA and the melting temperature should not be a coincidence. Follow-up studies are required to find out whether a more general picture can be established.
Since the melting temperature affects the GFA, it is then straightforward to expect that it also plays some role in dynamics of supercooled liquids. It is interesting to know whether and particles exhibit different dynamics related to their melting temperature difference. We are also curious about how the dynamics change when varies from to with the best GFA, from which we may reveal some underlying connections between the GFA and dynamical properties of glass-formers, such as kinetic fragility and dynamic heterogeneity.
Methods
System information. Our systems contain and particles with the same mass and a size ratio defined earlier. Periodic boundary conditions are applied in all directions. We consider two types of particle interactions, harmonic:
| (17) |
and repulsive Lennard-Jones (RLJ):
| (18) |
where and are the separation between particles and and sum of their radii, is the characteristic energy scale, and is the Heaviside step function. We set the units of mass, energy, and length to be , , and , so the units of time and temperature are and with being the Boltzmann constant.
Dimensionless quench rate. In this work, we compare the GFA over a wide range of pressures from to above and thus have to confront the challenge to choose a reasonable quench rate. To our knowledge, this issue has not been seriously considered, because people rarely compare the GFAs at different pressures.
It has been shown that, when glass-forming liquids are quickly quenched to , the properties of the resultant inherent structures, e.g., potential energy and stability, depend on the parent temperature prior to the quench sastry ; wang ; helffeich ; brumer . For glass-forming liquids, there are two characteristic temperatures, the onset temperature and the glass transition temperature brumer ; berthier . When and the liquids still exhibit the Arrhenius relaxation behavior, the potential energy of the inherent structures does not vary much with . When and the liquids are supercooled and exhibit super-Arrhenius behavior, the potential energy of the inherent structures decreases with the decrease of . Previous results have suggested that is around berthier .
In our study, we start with an equilibrium liquid above and apply a quench rate . Apparently, how long the system stays in the temperature window, , is crucial to the structures and properties of the final solid-like states. In contrast, above or below , the system is either an equilibrium liquid or a glass with extremely slow structural relaxation, so how long the system stays at and in the accessible time scales should not significantly affect the final solid-like state.
Previous studies have shown that at low pressures for systems studied in this work with and xu . If we use the same quench rate for all pressures, the time for the system to stay in the supercooled regime, , is . Compared with high-pressure systems, the low-pressure systems almost undergo no time in the supercooled regime, which is unfair for them to explore lower-energy inherent structures. Therefore, to compensate this loss at low pressures and give systems at quite different pressures comparable chances to explore lower-energy inherent structures, we need to let . This leads to an updated quench rate , where is the dimension of space. This is actually to nondimensionlize the temperature step in the expression of by .
Moreover, it has also been shown that the structural relaxation time of the supercooled liquids studied in this work satisfies the scaling at low pressures xu : , where is the scaling function. Therefore, in order for systems at different pressures to undergo comparable structural relaxations in the supercooled liquid regime, the quench rate is required to be further divided by . This is actually to nondimensionlize the time duration in the expression of by .
Then we finally obtain a dimensionless quench rate . For two-dimensional systems mainly studied in this work, . By using the same at different pressures, we are able to compare the GFAs of systems with the pressure varying over several orders of magnitude. This is particularly crucial to compare the low pressure regimes where both the glass transition and melting temperatures are linear in pressure. The robust scaling collapse of curves strongly validates the use of . When is fixed, , so the computational cost dramatically increases with the decrease of pressure. As a compromise, we use larger values of when focusing on the low-pressure systems in Figs. 3, 4, and 5 than those for higher pressures in Fig. 1.
Data availability
The data that support the findings of this study are available from the corresponding author upon reasonable request.
Code availability
The computer codes of this study are available from the corresponding author upon reasonable request.
References
- (1) Debenedetti, P. G. & Stillinger, F. H. Supercooled liquids and the glass transition. Nature (London) 410, 259-267 (2001).
- (2) Berthier, L., & Biroli, G. Theoretical perspective on the glass transition and amorphous materials. Rev. Mod. Phys. 83, 587-645 (2011).
- (3) Liu, A. J. & Nagel, S. R. Nonlinear dynamics: Jamming is not just cool any more. Nature 396, 21-22 (1998).
- (4) O’Hern, C. S., Silbert, L. E., Liu, A. J. & Nagel, S. R. Jamming at zero temperature and zero applied stress: The epitome of disorder. Phys. Rev. E 68, 011306 (2003).
- (5) Torquato, S., & Stillinger, F. H. Jammed hard-particle packings: From Kepler to Bernal and beyond. Rev. Mod. Phys. 82, 2633-2672 (2010).
- (6) Tanaka, H. Bond orientational order in liquids: Towards a unified description of water-like anomalies, liquid-liquid transition, glass transition, and crystallization. Eur. Phys. J. E 35, 113 (2012).
- (7) Bates, F. S. Polymer-polymer phase behavior. Science 251, 898-905 (1991).
- (8) Jaeger, H. M., Nagel, S. R. & Behringer, R. P. Granular solids, liquids, and gases. Rev. Mod. Phys. 68, 1259-1273 (1996).
- (9) Moreo, A., Yunoki, S. & Dagotto, E. Phase separation scenario for manganese oxides and related materials. Science 283, 2034-2040 (1999).
- (10) Erlebacher, J., Aziz, M. J., Karma, A., Dimitrov, N. & Sieradzki, K. Evolution of nanoporosity in dealloying. Nature 410, 450-453 (2001).
- (11) Balaza, A. C., Emrick, T. & Russell, T. P. Nanoparticle polymer composites: where two small worlds meet. Science 314, 1107-1110 (2006).
- (12) Palacci, J., Sacanna, S., Steinberg, A. P., Pine, D., J. & Chaikin, P. M. Living crystals of light-activated colloidal surfers. Science 339, 936-940 (2013).
- (13) Li, P. L., Banjade, S., Cheng, H. C., Kim, S., Chen, B., Guo, L., Llaguno, M., Hollingsworth, J. V., King, D. S. & Banani, S. F. Phase transitions in the assembly of multivalent signalling proteins. Nature 483, 336-340 (2012).
- (14) Biben, T. & Hansen, J. P. Phase separation of asymmetric binary hard-sphere fluids. Phys. Rev. Lett. 66, 2215-2218 (1991).
- (15) Hynninen, A.-P., Thijssen, J. H. J., Vermolen, E. C. M., Dijkstra, M. & van Blaaderen, A. Self-assembly route for photonic crystals with a bandgap in the visible region, Nat. Mater. 6 202-205 (2007).
- (16) Shechtman, D., Blech, I., Gratias, D. & Cahn, J. W. Metallic phase with long-range orientational order and no translational symmetry. Phys. Rev. Lett. 53, 1951-1953 (1984).
- (17) Xi, X. K., Li, L. L., Zhang, B., Wang, W. H. & Wu, Y. Correlation of atomic cluster symmetry and glass-forming ability of metallic glass. Phys. Rev. Lett. 99, 095501 (2007).
- (18) Li, Y., Guo, Q., Kalb, J. A. & Thompson, C. V. Matching glass-forming ability with the density of the amorphous phase. Science 322, 1816-1819 (2008).
- (19) Fujita,T., Konno, K., Zhang, W., Kumar, V., Matsuura, M., Inoue, A., Sakurai, T. & Chen, M. W. Atomic-scale heterogeneity of a multicomponent bulk metallic glass with excellent glass forming ability. Phys. Rev. Lett. 103, 075502 (2009).
- (20) Bendert, J. C., Gangopadhyay, A. K., Mauro, N. A. & Kelton, K. F. Volume expansion measurements in metallic liquids and their relation to fragility and glass forming ability: An energy landscape interpretation. Phys. rev. Lett. 109, 185901 (2012).
- (21) Wu, Z. W., Li, M. Z., Wang, W. H. & Liu, K. X. Hidden topological order and its correlation with glass-forming ability in metallic glasses. Nat. Commun. 6, 6035 (2014).
- (22) Ninarello, A., Berthier, L. & Coslovich, D. Models and algorithms for the next generation of glass transition studies. Phys. Rev. X 7, 021039 (2017).
- (23) Russo, J., Romano, F. & Tanaka, H. Glass forming ability in systems with competing orderings. Phys. Rev. X 8, 021040 (2018).
- (24) Dijkstra, M., van Roij, R., & Evans, R. Phase diagram of highly asymmetric binary hard-sphere mixtures. Phys. Rev. E 59, 5744-5771 (1999).
- (25) Dijkstra, M., van Roij, R., & Evans, R. Phase behavior and structure of binary hard-sphere mixtures. Phys. Rev. Lett. 81, 2268-2271 (1998).
- (26) Biben, T., Bladon, P. & Frenkel, D. Depletion effects in binary hard-sphere fluids. J. Phys.: Condens. Matter 8, 10799-10821 (1996).
- (27) Dinsmore, A. D., Yodh, A. G. & Pine, D. J. Phase diagrams of nearly-hard-sphere binary colloids. Phys. Rev. E 52, 4045-4057 (1995).
- (28) Imhof, A. and Dhont, J. K. G. Experimental phase diagram of a binary colloidal hard-sphere mixture with a large size ratio. Phys. Rev. Lett. 75, 1662-1665 (1995).
- (29) Frenkel, D. Entropy-driven phase transitions. Physica A 263, 26-28 (1999).
- (30) Xu, N., Haxton, T. K., Liu, A. J. & Nagel, S. R. Equivalence of glass transition and colloidal glass transition in the hard-sphere limit. Phys. Rev. Lett. 103, 245701 (2009).
- (31) Wang, X., Zheng, W., Wang, L. & Xu, N. Disordered solids without well-defined transverse phonons: the nature of hard-sphere glasses. Phys. Rev. Lett. 114, 035502 (2015).
- (32) Donev, A., Stillinger, F. H. & Torquato, S. Configurational entropy of binary hard-disk glasses: Nonexistence of an ideal glass transition. J. Chem. Phys. 127, 124509 (2007).
- (33) Coslovich, D., Ozawa, M. & Berthier, L. Local order and crystallization of dense polydisperse hard spheres. J. Phys.: Condens. Matter 30, 144004 (2018).
- (34) Miller, W. L. and Cacciuto, A. Two-dimensional packing of soft particles and the soft generalized Thomson problem. Soft Matter 7, 7552-7559 (2011).
- (35) Miyazaki, R., Kawasaki, T. & Miyazaki, K. Cluster glass transition of ultrasoft-potential fluids at high density. Phys. Rev. Lett. 117, 165701 (2016).
- (36) Pmies, J. C., Cacciuto, A. and Frenkel, D. Phase diagram of Hertzian spheres. J. Chem. Phys. 131, 044514 (2009).
- (37) Zu, M., Tan, P. & Xu, N. Forming quasicrystals by monodisperse soft core particles. Nat. Commun. 8, 2089 (2017).
- (38) Xu, N. Phase behaviors of soft-core particle systems. Chinese J. Polym. Sci. 37, 1065-1082 (2019).
- (39) Pedersen, U. R., Schrøder, T. B. & Dyre, J. C. Repulsive reference potential reproducing the dynamics of a liquid with attractions. Phys. Rev. Lett. 105, 157801 (2010).
- (40) Berthier, L. & Tarjus, G. The role of attractive forces in viscous liquids. J. Chem. Phys. 134, 214503 (2011).
- (41) Ingebrigtsen, T.S., Schrøder, T. B. & Dyre, J. C. What is a simple liquid? Phys. Rev. X 2, 011011 (2012).
- (42) Wang, L. & Xu, N. Probing the glass transition from structural and vibrational properties of zero-temperature glasses. Phys. Rev. Lett. 112, 055701 (2014).
- (43) Khrapak, S. A. & Morfill, G. E. Accurate freezing and melting equations for the Lennard-Jones system. J. Chem. Phys. 134, 094108 (2011).
- (44) Berthier, L., Moreno, A. J. & Szamel, G., Increasing the density melts ultrasoft colloidal glasses. Phys. Rev. E 82, 060501(R) (2010).
- (45) Zhao, C., Tian, K. & Xu, N. New jamming scenario: from marginal jamming to deep jamming. Phys. Rev. Lett. 106, 125503 (2011).
- (46) Schmiedeberg, M. Multiple reentrant glass transitions of soft spheres at high densities: Monotonicity of the curves of constant relaxation time in jamming phase diagrams depending on temperature over pressure and pressure. Phys. Rev. E. 87, 052310 (2013).
- (47) Zu, M., Liu, J., Tong, H. & Xu, N. Density affects the nature of the hexatic-liquid transition in two-dimensional melting of soft-core systems. Phys. Rev. Lett. 117, 085702 (2016).
- (48) Wang, L. & Xu, N. Non-monotonic pressure dependence of the dynamics of soft glass-formers at high compressions. Soft Matter 8, 11831-11838 (2012).
- (49) Likos, C. M. Effective interactions in soft condensed matter physics. Phys. Rep. 348, 267-439 (2001).
- (50) Russo, J. & Wilding, N. B. Disappearance of the hexatic phase in a binary mixture of hard disks. Phys. Rev. Lett. 119, 115702 (2017).
- (51) Tong, H., Tan, P. & Xu, N. From crystals to disordered crystals: A hidden order-Disorder transition. Sci. Rep. 5, 15378 (2015).
- (52) Sastry, S., Debenedetti, P. G. & Stillinger, F. H. Signatures of distinct dynamical regimes in the energy landscape of a glass-forming liquid. Nature 393, 554-557 (1998).
- (53) Helfferich, J., Lyubimov, I., Reid, D. & de Pablo, J. J. Inherent structure energy is a good indicator of molecular mobility in glasses. Soft Matter 12, 5898-5904 (2016).
- (54) Wang, L., Ninarello, A., Guan, P., Berthier, L., Szamel, G. & Flenner, E. Low-frequency vibrational modes of stable glasses. Nat. Commun. 10, 26 (2019).
- (55) Brumer, Y. & Reichman, D. R. Mean-field theory, mode-coupling theory, and the onset temperature in supercooled liquids. Phys. Rev. E 69, 041202 (2004).
Acknowledgements
We thank Ludovic Berthier for bringing us attention to the micro-phase separation in binary mixtures of harmonic particles at high densities, which stimulates us to perform this study. This work was supported by the National Natural Science Foundation of China Grant No. 11734014. We also thank the Supercomputing Center of University of Science and Technology of China for the computer time.
Author contributions
N.X. designed the project. Y.N. performed the simulations. Y.N., J.L., J.G. and N.X. analyzed the data. Y.N. and N.X. wrote the paper.
Additional Information
Competing interests: The authors declare no Competing Financial or Non-Financial Interests.