Weakly Supervised Thoracic Disease Localization via Disease Masks
Abstract
To enable a deep learning-based system to be used in the medical domain as a computer-aided diagnosis system, it is essential to not only classify diseases but also present the locations of the diseases. However, collecting instance-level annotations for various thoracic diseases is expensive. Therefore, weakly supervised localization methods have been proposed that use only image-level annotation. While the previous methods presented the disease location as the most discriminative part for classification, this causes a deep network to localize wrong areas for indistinguishable X-ray images. To solve this issue, we propose a spatial attention method using disease masks that describe the areas where diseases mainly occur. We then apply the spatial attention to find the precise disease area by highlighting the highest probability of disease occurrence. Meanwhile, the various sizes, rotations and noise in chest X-ray images make generating the disease masks challenging. To reduce the variation among images, we employ an alignment module to transform an input X-ray image into a generalized image. Through extensive experiments on the NIH-Chest X-ray dataset with eight kinds of diseases, we show that the proposed method results in superior localization performances compared to state-of-the-art methods.
keywords:
weakly supervised learning, localization, thoracic disease.1 Introduction
Obtaining a precise diagnosis is critical for early treatments of many diseases and ensuring successful recovery. Thus, radiologists must analyze large numbers of X-ray images and make diagnosis quickly with high precision. To reduce these efforts, computer-aided diagnosis (CAD) tools for X-ray tests have become an essential element for providing a second opinion to radiologists. Radiologists can use the CAD tools to reduce the number of false positive cases and achieve accurate diagnoses in less time. Along the same line, deep learning has been successfully used in a variety of research fields [1, 2, 3, 4] to replace handcrafted feature approaches [5, 6, 7] and many studies have investigated applying deep learning to the medical domain to help radiologists diagnose disease [8, 9, 10, 11, 12, 13, 14, 15, 16, 17]. As a result, there has been considerable progress in thoracic disease classification.
On the other hand, it is difficult for radiologists to trust the prediction results when an accurate location related to the diagnosed disease is not provided. Thus, localizing disease areas is a prerequisite for using deep learning methods as tools for providing a second opinion. However, the machine approaches are still inadequate at providing the location of thoracic disease due to the lack of instance-level annotation data in the medical field. Specifically, not only radiologists must laboriously analyze X-ray images for extended periods to generate the instance-level information as training data, but also deep learning requires considerable training data of the disease areas.
To solve this problem, we propose a weakly supervised disease localization method that uses only image-level information to reduce the high cost incurred by detailed annotations. Because hospitals already have access to large numbers of X-ray images for thoracic diseases, a weak supervision approach simplifies the problem and is easier than collecting instance-level annotations individually. Various studies have been conducted to investigate weakly supervised thoracic disease localization [18, 19, 20, 21]. These previous works have traditionally presented disease areas using activated feature maps from a classifier. However, they do not consider the typical disease occurrence areas, and thus they often fail to localize the disease area as recognized by radiologists. Each thoracic disease has an area where it most frequently occurs. For example, cardiomegaly occurs around the heart, while pneumonia occurs in the lungs. Intuitively, radiologists do not look at all the areas when diagnosing thoracic X-ray images. Instead, they concentrate on the part related to the patient’s symptoms. However, the existing studies visualize only the most discriminative areas for the disease classification of a single subject without considering prior knowledge regarding the area where a disease most frequently occurs.
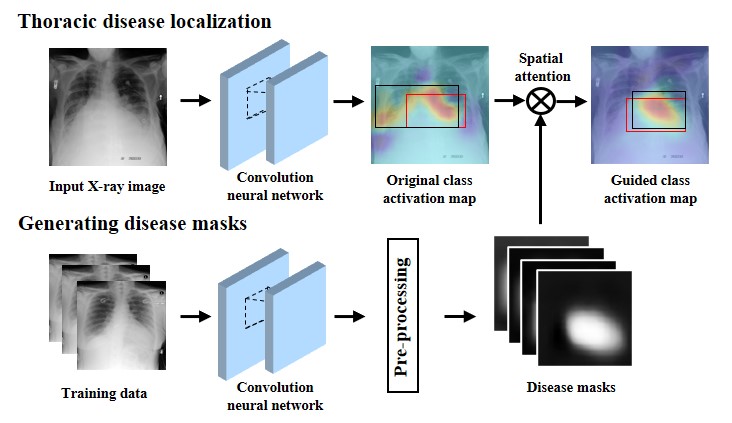
To address this issue, we propose a spatial attention method using disease masks containing the spatial probability of disease occurrence. Fig. 1 shows an overview of the spatial attention with disease masks for thoracic disease localization. The disease masks are generated by a pretrained network using X-ray training data and the activated features. The masks are used to guide the network to detect the disease area more accurately.
Meanwhile, X-ray data have problems due to their diverse variations, such as rotation and shift. Specifically, the diverse variations in X-ray images can prevent the disease mask from focusing the spatial attention on the common areas where diseases occur. For this reason, we use an alignment module [21] to transform the X-ray image into a generalized chest shape. In addition, medical datasets typically have large imbalances in the number of positive and negative samples333Positive and negative samples indicate whether a X-ray image contains diseases or not., causing classifiers to have a skewed predictions. To alleviate this problem, we train the network using a weighted loss function [18] that assigns a larger weighted loss to the classes with fewer training examples.
In the experimental section, we compare the proposed method with previous works [18, 19, 21] on the NIH-Chest X-ray dataset. The results show that our method achieves state-of-the-art localization performance. In addition, we demonstrate the effectiveness of the generated disease masks through extensive ablation studies. In summary, our contributions are as follows:
-
1.
We present a spatial attention method using disease masks that provide prior knowledge about disease occurrence areas.
-
2.
We propose a unified framework using input alignment, feature attention and a loss function that compensates for imbalanced chest X-ray datasets.
-
3.
We show that our proposed method achieves state-of-the-art performance for weakly-supervised thoracic disease localization.
2 Related Works
2.1 Weakly supervised localization
Recently, weakly supervised localization methods using class activation map (CAM) [22] and Grad-CAM [23] approaches that help explain the reasons for the class judgments of classifiers have received considerable attention. In [22], B. Zhou et al. proposed CAM to visualize which features a network uses to make decisions by using the weights and feature maps from the final layer. In [23], R.R. Selvaraju et al. proposed Grad-CAM, which visualizes the crucial features using gradient information obtained during the back-propagation process. Unlike CAM, Grad-CAM is applicable to multiple types of networks such as those used for image captioning [24, 25] and visual question answering [26, 27] as well as for networks applied to image classification tasks. However, CAM and Grad-CAM both visualize only the most discriminative area rather than the complete object areas used to classify the data.
To overcome this limitation, various weakly supervised object localization methods have been proposed [28, 29, 30, 31, 32] that detect an object’s location using only image-level information. In [28], K. Singh et al. proposed a grid drop method in which an input image is divided into an -by- grid, and each grid cell is randomly dropped with a fixed probability. Then, the modified image is repeatedly used for training, enabling a network to find the entire object area. However, the random grid drop method requires a long training time. In [29], X. Zhang et al. proposed a method to localize object areas using two classifiers that share a single feature extractor. The first classifier finds the most discriminative area and removes the features from that area. Then, the second classifier trains the network using the removed features and finds the next most discriminative areas. Finally, they combined the class activation maps generated by the two classifiers to perform object localization. In [30], X. Zhang et al. proposed a self-produced guidance (SPG) mask that divides an object into foreground and background areas. They trained a network with the SPG mask to indicate the spatial correlation of locations. In [31], J. Choe et al. proposed a method to train a network by randomly dropping the most strongly activated region in a self-attention mask.
Although the algorithms are mainly developed using attention-based methods, they does not consider the characteristic of medical images where there exist indistinguishable X-ray images with different diseases or a small disease.
2.2 Thoracic disease localization
As a baseline, X. Wang et al. published ChestX-ray14 [18] that is a large hospital-scale dataset and they studied the classification and localization problems of thoracic diseases in a multilabel environment. In [19], J. Cai et al. proposed a two-step approach. Using an attention-mining (AM), they generated first activation maps, and second activation maps were produced after removing the activated area from the first one. Then, they used the L2 distance to consider the relationships between multiple diseases within an image. In [20], L. Zhe et al. addressed that it is challenging to collect instance-level annotations for all subjects to localize thoracic disease. They proposed a network structure and a conditional loss function that can be trained simultaneously from small amounts of annotated and unannotated data. In [21], J. Liu et al. pointed out that the ChestX-ray14 dataset lacks high-quality images. They proposed an alignment module and a contrast-induced attention network that increased the attention to the disease area by contrasting negative images with similar positive images.
However, the previous approaches rely on the discriminative power of deep networks that are trained end-to-end for classification without considering the disease occurrence area. Instead, we propose an attention method using disease masks to guide the network to consider the typical spatial distributions of thoracic diseases.
3 Methods
3.1 Spatial attention with disease masks
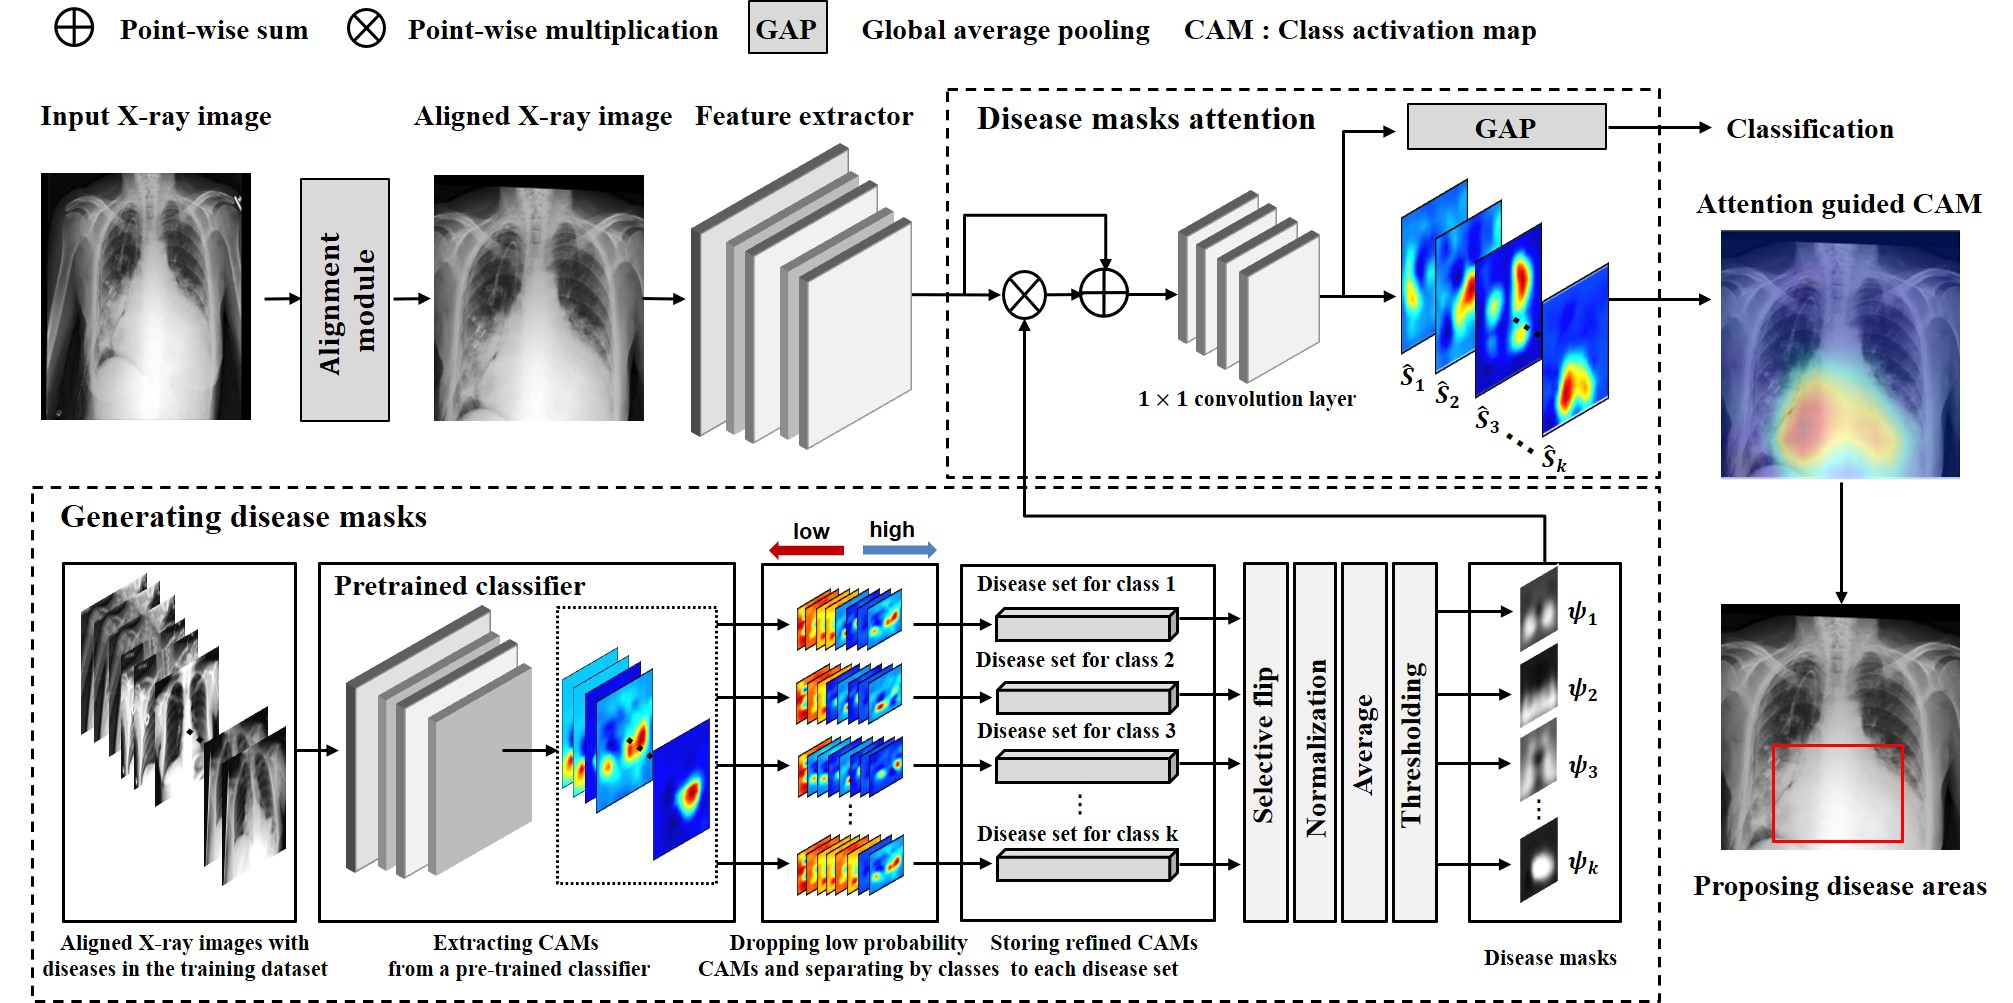
As shown in Fig. 2, the proposed method consists of two parts by generating disease masks (DM) and providing spatial attention to the localization network using the masks with a high probability of disease occurrence. We utilize the class activation maps using a pretrained network to generate the disease masks representing each class and retrain the feature extractor by fusing the generated disease masks and extracted feature maps. As a result, the retrained feature extractor can localize diseases by considering the occurrence distribution for each disease. The details of each task are described in following subsections.
3.1.1 Generating disease masks
To generate disease masks, we extract class activation maps [22] using aligned X-ray images from a pretrained network. Let detnote aligned X-ray images where defines the dimensions of the image. The -th class activation map is defined as follows:
| (1) |
where denotes the extracted feature maps of size from a pretrained network and is the weight of the -th feature map for class . Then, the probability score of in the -th class is defined as
| (2) |
where is obtained using the sigmoid function after performing global averaging pooling on . Then, we collect by dropping images where to obtain high-quality class activation maps.
Finally, we generate the class-specific disease masks using the activation maps. The disease mask for class is defined as follows:
| (3) |
Here, represent the -th element of , and is the number of high-quality images for class . In addition, denotes an asymmetrically located class, and is the horizontal flip function. We normalize the activation maps to bring all values into the range using and apply a thresholding function to obtain the highly activated areas.
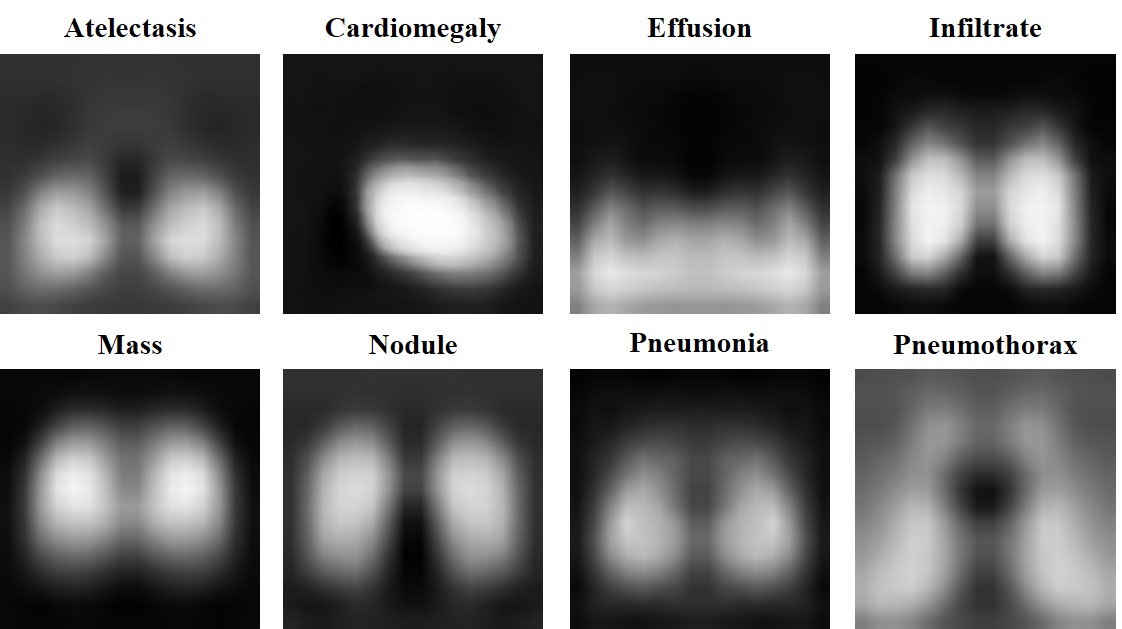
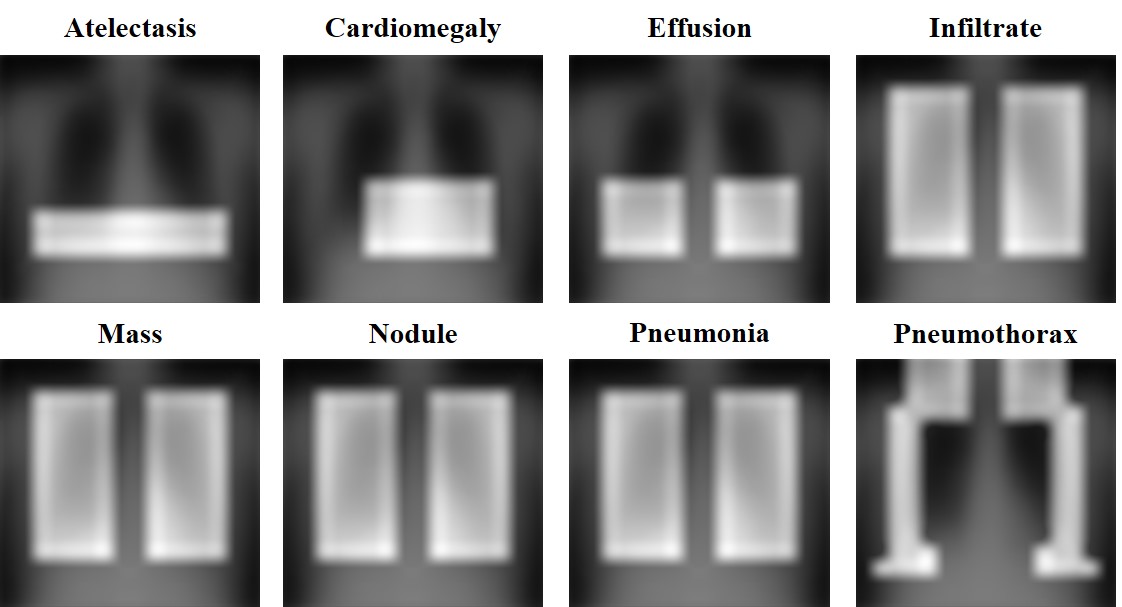
Specifically, seven types of diseases (atelectasis, effusion, infiltrate, mass, nodule, pneumonia and pneumothorax) mainly occur symmetrically in the lungs. On the other hand, cardiomegaly is a disease in which the left ventricle area is enlarged and occurs asymmetrically. To reflect the innate characteristics of these diseases, we apply for the seven symmetrical diseases and for the asymmetrical disease. Fig. 3 shows the generated disease masks for the eight kinds of diseases considered in this study.
3.1.2 Localization with spatial attention
We retrain the feature extractor with the disease masks so that the deep network focuses on the areas where diseases frequently occur. To employ spatial attention, attention guided feature maps are generated as follows:
| (4) |
The disease masks deactivate the parts with a lower probability of disease occurrences. Moreover, the skip connections effectively combine the information from the attention and the original feature maps.
After retraining, we generate class activation maps using the attention guided class activation map as follows:
| (5) |
Finally, we employ the class activation map to localize the thoracic disease areas. The essence of spatial attention is to reinforce weakly activated areas by guiding the deep network to refer to the innate properties of thoracic diseases.
3.2 Alignment module
The original X-ray image generally contains diverse types of variations such as rotations, shifts, and different scales. These misaligned X-ray images are commonly found in various chest X-ray datasets [18, 33, 34] and make it hard to find the disease occurrence areas for generating the disease masks. Moreover, these variations function as noise in the deep network, making it challenging to identify disease and causing the proposed disease masks to guide the network to the wrong area.
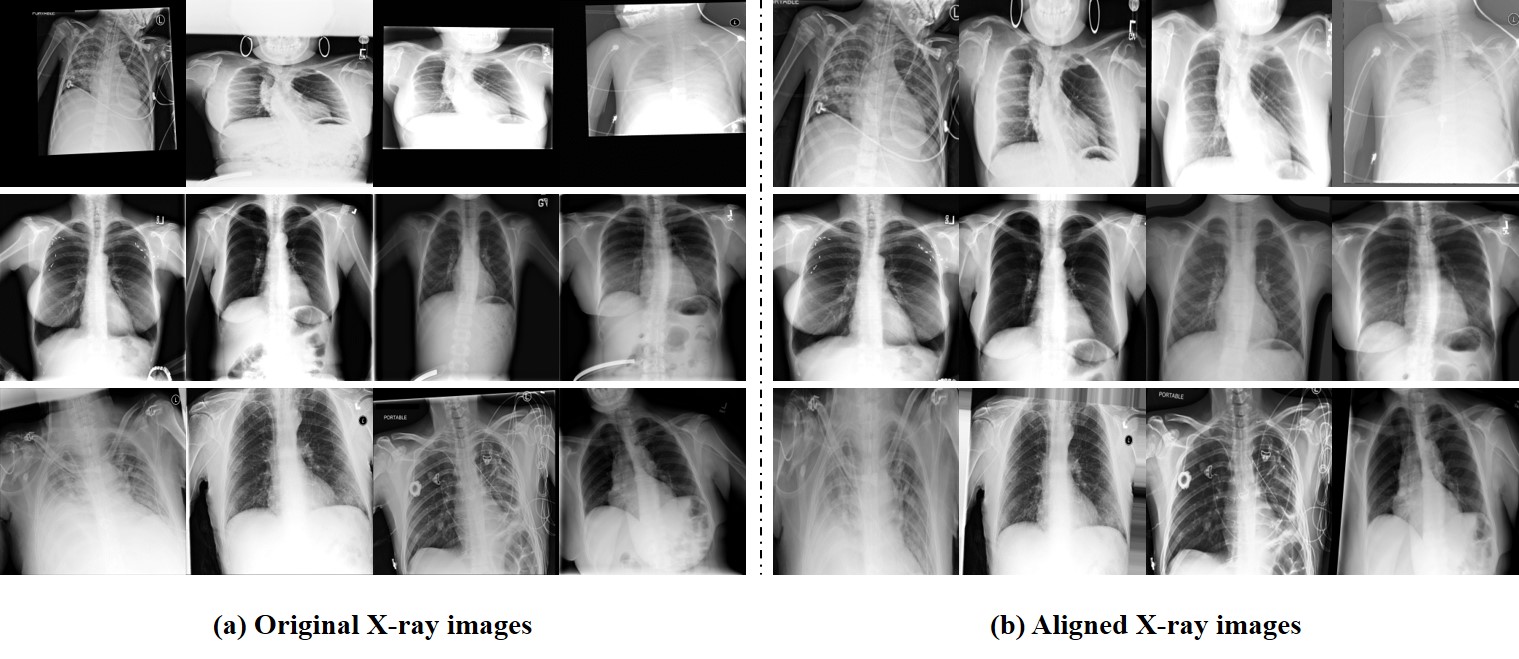
To solve this problem, we use an alignment module [21] that reduces the variations in the original X-ray images. The alignment module applies an affine transformation to the original X-ray images to generate aligned X-ray images. Fig. 4 shows some examples of original and aligned X-ray images. In Fig. 4(a), the original X-ray images contain diverse variations, but Fig. 4(b) shows higher-quality X-ray images obtained from the alignment module with effectively reduced variations.
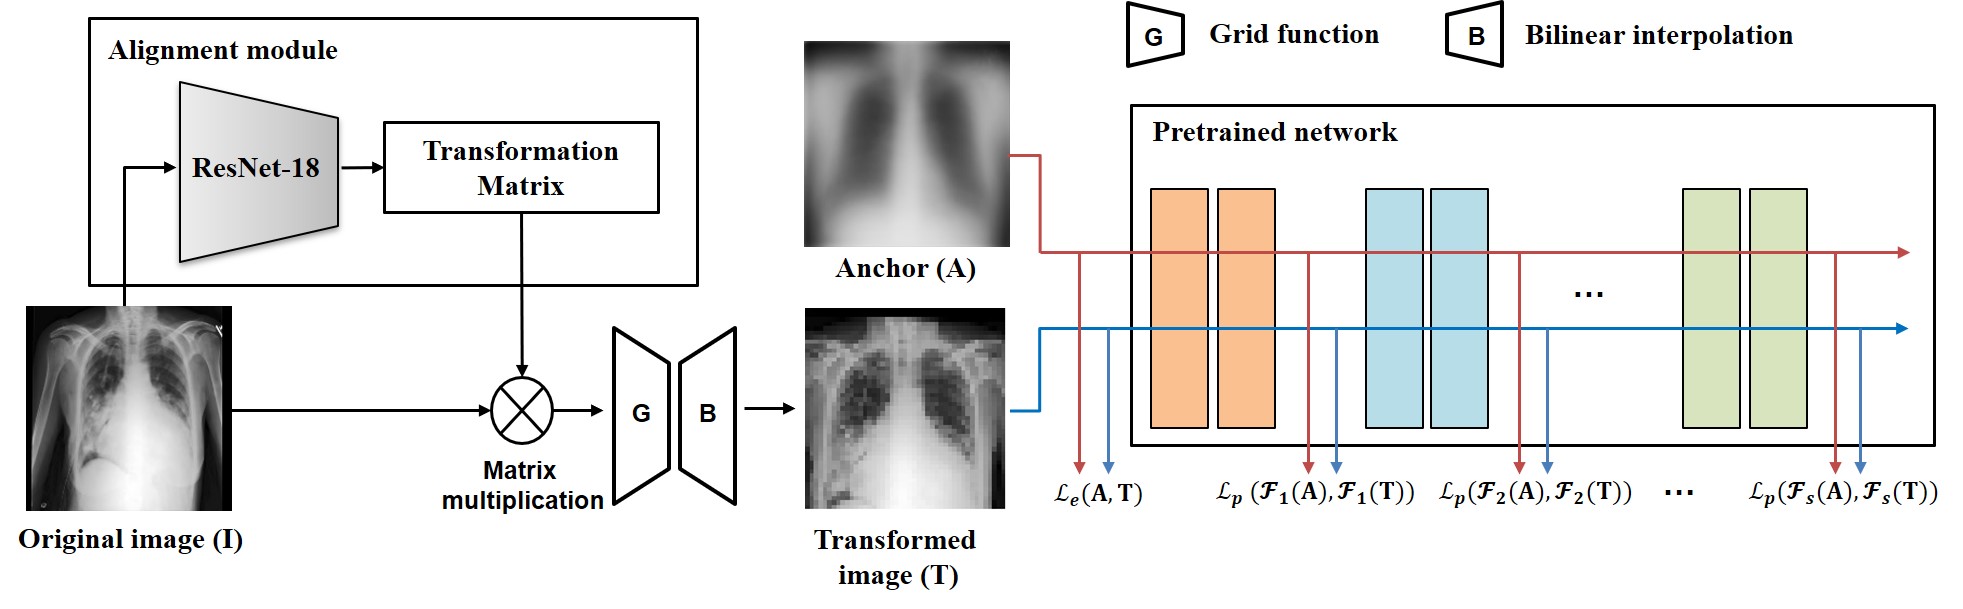
Fig. 5 shows the optimization process of the alignment module. The anchor image is a generalized chest image generated from the average of 2,000 normal random samples. The alignment module is implemented using ResNet-18 [4], and it outputs five parameters (, , , , ) where and denote the horizontal and vertical scales, respectively, and denote the horizontal and vertical displacements, respectively, and denotes the rotation angle. The transformed image () is defined as follows:
| (6) |
where indicates an input X-ray image and the five parameters are the outputs from the alignment module. We reduce the size of the transformed image using a grid function that performs the average pooling with a kernel size of 16 and stride of 16. Then, we restore the size using billinear interpolation . It is worth noting that averaging the 2,000 samples reduces the noise of various shapes but causes the anchor image to be blurred. Thus, the process smooths the transformed image so that it more closely resembles the blurred anchor image.
We train the alignment module to make as similar as possible to the shape of the anchor image using perceptual loss [35] and Euclidean loss as in [21]. The perceptual loss is defined as follows:
| (7) |
where represents the intermediate features of the -th layer extracted from the pretrained network and represents the feature size. The perceptual loss function penalizes the difference between the intermediate features of the two images and . In addition, the Euclidean loss that penalizes the difference between two images , is defined as
| (8) |
Finally, the total loss used to train the alignment module is as follows:
| (9) |
Thus, we aim to learn the transformation parameters from a pretrained network by considering both the images and their complex features.
3.3 Weighted cross-entropy loss
Medical datasets typically have a data imbalance problem between the positive and negative samples. This imbalanced data causes a classifier to output predictions skewed to specific class. To solve this problem, we adopt weighted binary cross-entropy [18], which is defined as follows:
| (10) |
where and represent the aligned X-ray images and the corresponding labels, respectively, indicates the prediction scores of a classifier, and are denoted as , . , and represents the number of positive and negative samples in a batch. When many positive samples exist in the batch, the value of decreases proportionatrely, while the value of increases. In contrast, when many negative samples exist in the batch, the value of decreases proportionately, and the value of increases.
4 Experiments
4.1 Dataset and preprocessing
A previous study [18] published the ChestX-ray14 dataset which can be used to identify and localize thoracic diseases. This dataset consists of 112,120 frontal-view chest X-rays and contains the image-level annotation as 86,524 for training and validation and 25,586 for testing, and it contains image-level annotations in which each image is multilabeled for 14 types of diseases (atelectasis, cardiomegaly, effusion, infiltrate, mass, nodule, pneumonia, pneumothorax, consolidation, edema, emphysema, fibrosis, pleural thickening and hernia). Moreover, the dataset provides 984 bounding box annotations for eight kinds of diseases (atelectasis, cardiomegaly, effusion, infiltrate, mass, nodule, pneumonia and pneumothorax). We resized the original X-ray images from 102410243 to 5125123 to enable faster training and normalized each channel to [-1,1].
4.2 Hyperparameter setting
Our architecture consists of the alignment module and the attention network. These two networks were trained separately. The alignment module was trained for five epochs using ResNet-18 to generate an affine transform matrix. To extract intermediate features in the perceptual loss, we exploited the ‘conv2_x’, ‘conv3_x’, ‘conv4_x’ and ‘conv5_x’ layers from a ResNet-50 model pretrained on the ChestX-ray14 dataset. We used the stochastic gradient descent algorithm with a learning rate of 0.001 and a batch size of 16. We then trained our feature extractor with ResNet-50 using the aligned X-ray images for five epochs and then retrained it for five more epochs with generated disease masks. We used the Adam optimizer [36] with a learning rate and batch size of 0.0001 and 32, respectively.
4.3 Evaluation of thoracic disease localization
We used the accuracy metric to evaluate localization performances. A higher accuracy score implies a better localization model. This metric was evaluated using the Intersection over Union (IoU) of the overlapping region between the predicted boxes and the ground truth. The accuracy metric predicts true positives when the IoU of two boxes is above a threshold. We evaluated thoracic disease localization accuracy by setting thresholds of [0.3, 0.5, 0.7]. To change the class activation map into a measurable prediction box, we perform binarization of activation maps using the predefined threshold presented in [18, 37].
| T(IoU) | Model | Ate. | Car. | Eff. | Inf. | Mas. | Nod. | Pn1. | Pn2. | Mean | |||
| 0.3 | X. Wang et al. [18] | 0.24 | 0.46 | 0.30 | 0.28 | 0.15 | 0.04 | 0.17 | 0.13 | 0.22 | |||
| J. Cai et al. [19] | 0.33 | 0.85 | 0.34 | 0.28 | 0.33 | 0.11 | 0.39 | 0.16 | 0.35 | ||||
| J. Liu et al. [21] | 0.34 | 0.71 | 0.39 | 0.65 | 0.48 | 0.09 | 0.16 | 0.20 | 0.38 | ||||
| ResNet-50 | 0.30 | 0.82 | 0.32 | 0.21 | 0.35 | 0.10 | 0.19 | 0.20 | 0.31 | ||||
| ResNet-50+Alignment | 0.37 | 0.80 | 0.37 | 0.41 | 0.40 | 0.11 | 0.25 | 0.22 | 0.37 | ||||
| ResNet-50+Alignment+DM | 0.40 | 0.97 | 0.40 | 0.58 | 0.50 | 0.14 | 0.40 | 0.38 | 0.47 | ||||
| 0.5 | X. Wang et al. [18] | 0.05 | 0.18 | 0.11 | 0.07 | 0.01 | 0.01 | 0.03 | 0.03 | 0.06 | |||
| J. Cai et al. [19] | 0.11 | 0.60 | 0.10 | 0.12 | 0.07 | 0.03 | 0.17 | 0.08 | 0.16 | ||||
| J. Liu et al. [21] | 0.19 | 0.53 | 0.19 | 0.47 | 0.33 | 0.03 | 0.08 | 0.11 | 0.24 | ||||
| ResNet-50 | 0.10 | 0.60 | 0.13 | 0.15 | 0.13 | 0.01 | 0.10 | 0.12 | 0.17 | ||||
| ResNet-50+Alignment | 0.17 | 0.64 | 0.20 | 0.18 | 0.28 | 0.03 | 0.09 | 0.11 | 0.21 | ||||
| ResNet-50+Alignment+DM | 0.18 | 0.80 | 0.21 | 0.25 | 0.35 | 0.05 | 0.15 | 0.16 | 0.27 | ||||
| 0.7 | X. Wang et al. [18] | 0.01 | 0.03 | 0.02 | 0.00 | 0.00 | 0.00 | 0.01 | 0.02 | 0.01 | |||
| J. Cai et al. [19] | 0.01 | 0.17 | 0.01 | 0.02 | 0.01 | 0.00 | 0.02 | 0.02 | 0.03 | ||||
| J. Liu et al. [21] | 0.08 | 0.30 | 0.09 | 0.25 | 0.19 | 0.01 | 0.04 | 0.07 | 0.13 | ||||
| ResNet-50 | 0.06 | 0.21 | 0.04 | 0.07 | 0.03 | 0.00 | 0.02 | 0.03 | 0.06 | ||||
| ResNet-50+Alignment | 0.08 | 0.35 | 0.10 | 0.07 | 0.04 | 0.01 | 0.06 | 0.05 | 0.10 | ||||
| ResNet-50+Alignment+DM | 0.08 | 0.41 | 0.11 | 0.11 | 0.10 | 0.01 | 0.08 | 0.11 | 0.13 | ||||
We compared the results of our method with those of previous models [18, 19, 21] on eight different thoracic diseases. The quantitative evaluation results of the localization performances are reported in Table 1. Our proposed model achieved improvements of 9% and 3% compared with the previous state-of-the-art localization performances at IoU of 0.3 and 0.5, respectively. Additionally, we compared three types of models to analyze the effects of the alignment module and disease masks on the deep network’s localization performance. The base model is the ResNet-50 network that we used as a feature extractor. The other models are a ResNet-50 trained with aligned X-ray images and our proposed model, which implements spatial attention using a disease mask with aligned X-ray images. In Table 1, our model showed significantly improved localization performance compaired with the ResNet-50 and ResNet-50+Alignment models for large diseases such as ‘cardiomegaly’ or ‘pneumothorax.’ However, for small diseases such as ‘nodule’, our model showed relatively little improvement. This result indicates that even though the disease mask serves to focus the network’s attention to the disease’s locations, the effect is trivial on small diseases because it guides the attention to a relatively large area compared to the size of the disease area. On the other hand, for a large diseases, the disease mask approach achieves excellent localization performance because it focuses the overall attention on the disease occurrence area.
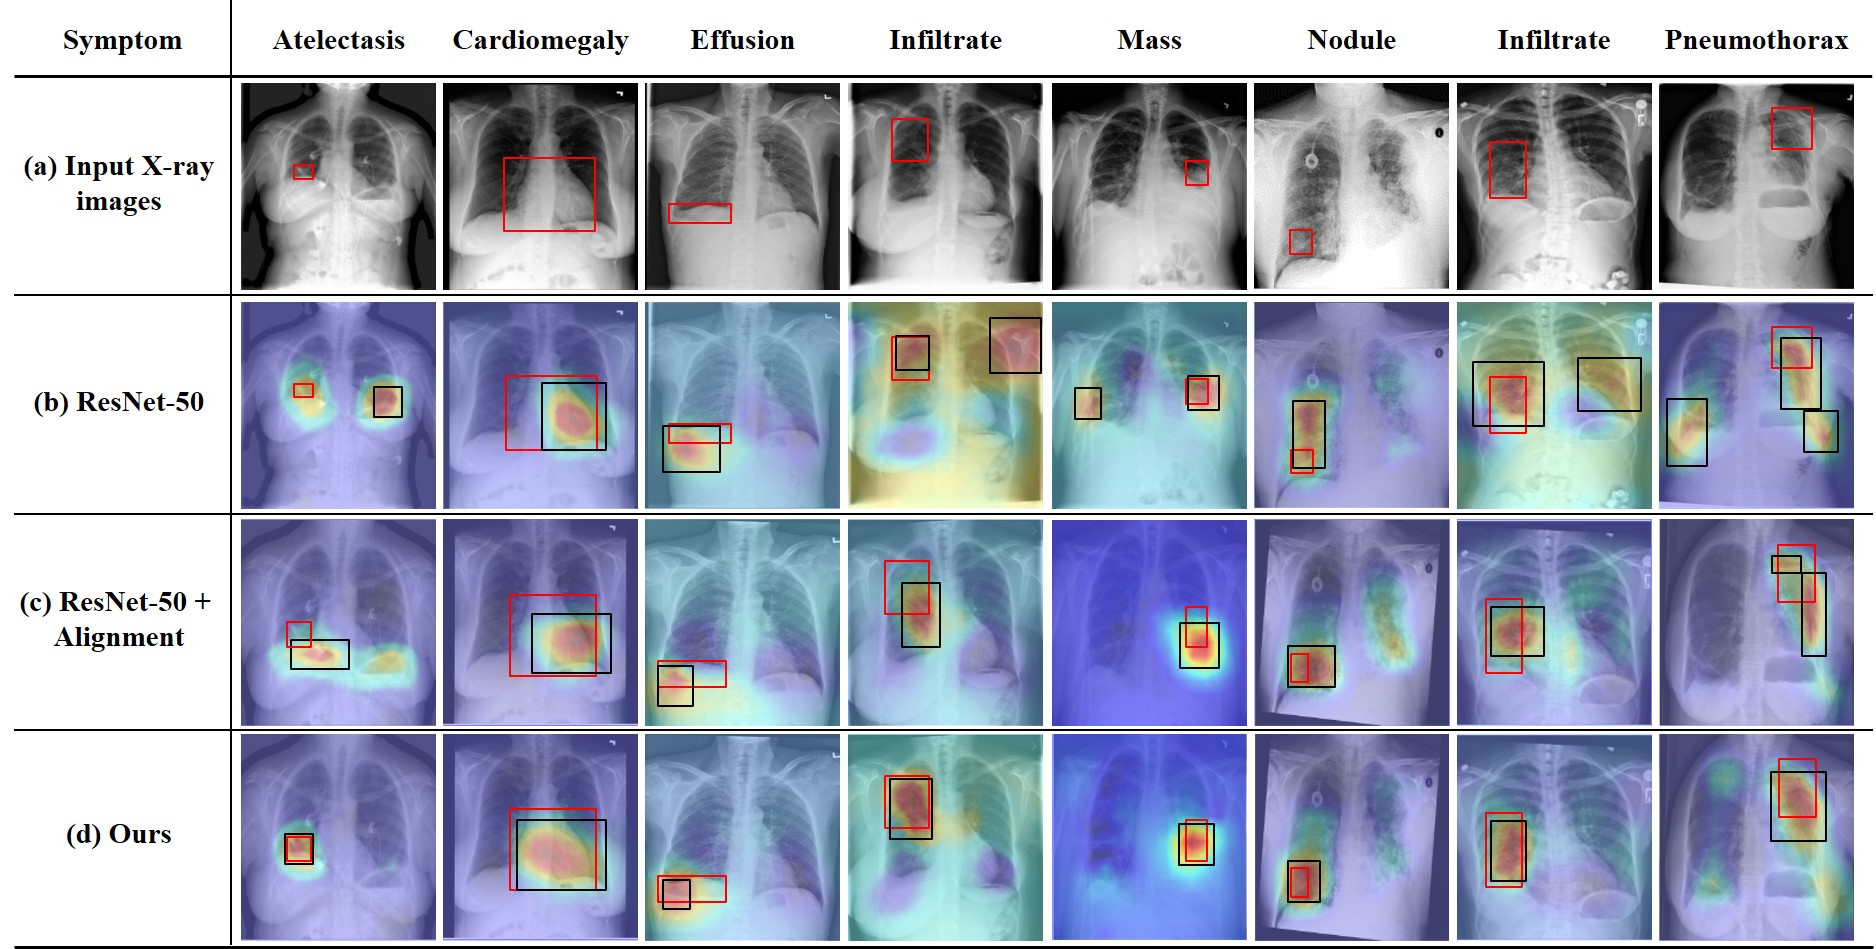
Fig. 6 shows qualitative evaluation results for three types of models on the eight types of thoracic diseases. Row (a) represents the preprocessed original X-ray image. Rows (b-d) show a comparison of the localization performance by each model. Our proposed method shows improved disease localization results compared with the baselines. The cardiomegaly prediction box of (b-c) is skewed to the right compared to the ground truth box. However, the prediction box (d) shows that the mask guides the class activation map to the exact heart disease area. As another example, the infiltrate’s prediction box of (b) shows localizing the wrong area outside the lungs. However, the infiltrate occurs in the lungs of the chest. Our masks provided this prior information to the network, and the (d) row shows more accurate localization results.
| T(IoU) | Model | Ate. | Car. | Eff. | Inf. | Mas. | Nod. | Pn1. | Pn2. | Mean | |||
| 0.3 | Base model+PDM | 0.34 | 0.90 | 0.44 | 0.45 | 0.43 | 0.12 | 0.31 | 0.45 | 0.43 | |||
| Base model+DM | 0.40 | 0.97 | 0.40 | 0.58 | 0.50 | 0.14 | 0.40 | 0.38 | 0.47 | ||||
| 0.5 | Base model+PDM | 0.16 | 0.75 | 0.22 | 0.20 | 0.30 | 0.03 | 0.09 | 0.20 | 0.24 | |||
| Base model+DM | 0.18 | 0.80 | 0.21 | 0.25 | 0.35 | 0.05 | 0.15 | 0.16 | 0.27 | ||||
| 0.7 | Base model+PDM | 0.07 | 0.40 | 0.12 | 0.08 | 0.05 | 0.01 | 0.05 | 0.12 | 0.11 | |||
| Base model+DM | 0.08 | 0.41 | 0.11 | 0.11 | 0.10 | 0.01 | 0.08 | 0.11 | 0.13 | ||||
4.4 Pseudo-disease masks based on external knowledge
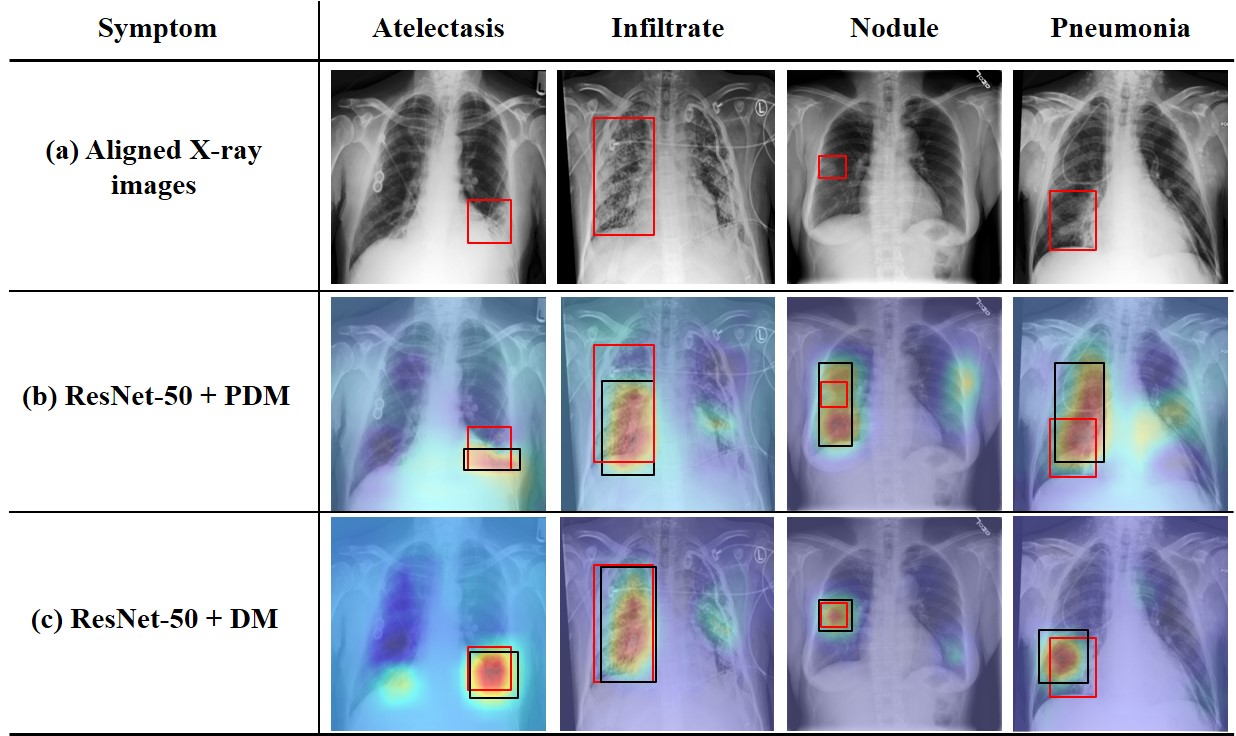
In this section, we conduct additional comparative experiments to demonstrate the effectiveness of the disease mask approach. We proposed a spatial attention method using the disease masks that included the disease area information. However, disease area information can easily be found via the Internet or in medical books. Thus, we manually generated pseudo-disease masks (PDMs) based on external knowledge from Wikipedia and conducted comparative experiments to demonstrate that our method generates more specific disease areas than pseudo ones. Fig. 7 shows the pseudo-disease masks marked above the anchor images. The pseudo disease masks are filled with ‘1’ in the disease area and ‘0’ in the nondisease area. ‘Infiltrate’, ‘mass’, ‘nodule’, and ‘pneumonia’ can occur everywhere in the lung area; therefore, we marked all the lung areas for those four diseases. We trained the base model using these pseudo-masks and compared the localization performance with our method. In Table 2, the base model trained using the proposed disease mask showed 4%, 3%, and 2% higher localization performance at IoUs of 0.3, 0.5, and 0.7. The results indicate that the generated masks more effectively guide the location of the disease than do the pseudo-disease masks manually generated based on external knowledge. The qualitative disease localization evaluation scores of the networks using the pseudo disease and proposed disease masks are reported in Fig. 8. We can observe that the model using pseudo-disease masks can find the surrounding area of diseases but unlike the proposed method, it has difficulty finding precise bounding boxes.
| Pathology | X. Wang et al. [18] | J. Cai et al. [19] | *L. Zhe et al. [20] | *J. Liu et al. [21] | Ours | ||
| Atelectasis | 0.70 | 0.75 | 0.80 | 0.79 | 0.79 | ||
| Cardiomegaly | 0.81 | 0.86 | 0.87 | 0.87 | 0.91 | ||
| Effusion | 0.76 | 0.81 | 0.87 | 0.88 | 0.84 | ||
| Infiltration | 0.66 | 0.67 | 0.70 | 0.69 | 0.71 | ||
| Mass | 0.69 | 0.80 | 0.83 | 0.81 | 0.85 | ||
| Nodule | 0.67 | 0.76 | 0.75 | 0.73 | 0.81 | ||
| Pneumonia | 0.66 | 0.70 | 0.67 | 0.75 | 0.73 | ||
| Pneumothorax | 0.80 | 0.85 | 0.87 | 0.89 | 0.89 | ||
| Consolidation | 0.70 | 0.69 | 0.80 | 0.79 | 0.74 | ||
| Edema | 0.81 | 0.83 | 0.88 | 0.91 | 0.86 | ||
| Emphysema | 0.83 | 0.91 | 0.91 | 0.93 | 0.95 | ||
| Fibrosis | 0.79 | 0.80 | 0.78 | 0.80 | 0.84 | ||
| Pleural Thickening | 0.68 | 0.75 | 0.79 | 0.80 | 0.80 | ||
| Hernia | 0.87 | 0.53 | 0.77 | 0.92 | 0.88 | ||
| Mean | 0.74 | 0.77 | 0.81 | 0.83 | 0.83 | ||
| Model | Ate. | Car. | Eff. | Inf. | Mas. | Nod. | Pn1. | Pn2. | Mean | ||
| ResNet-50 | 0.75 | 0.90 | 0.80 | 0.70 | 0.81 | 0.78 | 0.71 | 0.86 | 0.79 | ||
| ResNet-50+Alignment | 0.77 | 0.90 | 0.83 | 0.70 | 0.82 | 0.79 | 0.72 | 0.88 | 0.80 | ||
| ResNet-50+Alignment+DM | 0.79 | 0.91 | 0.84 | 0.71 | 0.85 | 0.81 | 0.73 | 0.89 | 0.82 | ||
4.5 Evaluations of thoracic diseases classification
Because our method aims to improve the localization performance by applying spatial attention to a classifier, we further provide the classification performance using the Area Under the Curve (AUC) metric for 14 types of diseases. As shown in Table 3, the proposed method outperforms the state-of-the-art methods [18, 19, 20]. Although the method of J. Liu et al. [21] showed an AUC performance equivalent to that of our method, they exploit additional bounding box information during training unlike ours. Furthermore, the localization performances in Table 1 demonstrate that using spatial attention in conjunction with disease masks is helpful for explicitly focusing a classifier on the disease areas even with the comparable capacity of classifiers.
In Table 4, we provide ablation studies that show how the disease masks and the alignment module affect the AUC performance. We can observe that the alignment module removes noise from the X-ray images, while the attention method is crucial for improving the classification performance.
5 Conclusion
In this study, we proposed a spatial attention method to train a deep network that considers the distributions of disease areas. Disease masks were generated by preprocessing the feature maps of a network pretrained on the training data. Furthermore, we introduced a unified framework to incorporate the disease masks, an alignment module and weighted cross-entropy loss to enhance the quality of X-ray images and reduce skewed predictions. Finally, we showed that the retrained feature extraction method with the unified framework improved the localization of thoracic diseases on the ChestX-ray14 dataset. Moreover, we verified the quality of the generated masks by comparing their localization performances with those of pseudo-disease masks obtained by external knowledge. Finally, the proposed method achieved state-of-the-art classification performance without additional instance-level annotations, which indicates the effectiveness of spatial attention with the disease masks approach.
Acknowledgment
This work was supported by Institute for Information & communications Technology Planning & Evaluation(IITP) grant funded by the Korea government(MSIT) (No. 2017-0-01779, A machine learning and statistical inference framework for explainable artificial intelligence and No. 2019-0-00079, Artificial Intelligence Graduate School Program, Korea University).
References
- [1] K. He, G. Gkioxari, P. Dollár, R. Girshick, Mask R-CNN, in: Proceedings of the IEEE International Conference on Computer Vision, 2017, pp. 2961–2969.
- [2] P. Anderson, X. He, C. Buehler, D. Teney, M. Johnson, S. Gould, L. Zhang, Bottom-up and top-down attention for image captioning and visual question answering, in: Proceedings of the IEEE Conference on Computer Vision and Pattern Recognition, 2018, pp. 6077–6086.
- [3] S. Ren, K. He, R. Girshick, J. Sun, Faster R-CNN: Towards real-time object detection with region proposal networks, in: Advances in Neural Information Processing Systems, 2015, pp. 91–99.
- [4] K. He, X. Zhang, S. Ren, J. Sun, Deep residual learning for image recognition, in: Proceedings of the IEEE Conference on Computer Vision and Pattern Recognition, 2016, pp. 770–778.
- [5] D. Kang, H. Han, A. K. Jain, S.-W. Lee, Nighttime face recognition at large standoff: Cross-distance and cross-spectral matching, Pattern Recognition 47 (12) (2014) 3750–3766.
- [6] M.-C. Roh, T.-Y. Kim, J. Park, S.-W. Lee, Accurate object contour tracking based on boundary edge selection, Pattern Recognition 40 (3) (2007) 931–943.
- [7] M.-C. Roh, H.-K. Shin, S.-W. Lee, View-independent human action recognition with volume motion template on single stereo camera, Pattern Recognition Letters 31 (7) (2010) 639–647.
- [8] R. B. Lanfredi, J. D. Schroeder, C. Vachet, T. Tasdizen, Adversarial regression training for visualizing the progression of chronic obstructive pulmonary disease with chest x-rays, in: International Conference on Medical Image Computing and Computer-Assisted Intervention, 2019, pp. 685–693.
- [9] Y. Tang, Y. Tang, V. Sandfort, J. Xiao, R. M. Summers, Tuna-net: Task-oriented unsupervised adversarial network for disease recognition in cross-domain chest x-rays, in: International Conference on Medical Image Computing and Computer-Assisted Intervention, 2019, pp. 431–440.
- [10] Y. Xue, T. Xu, L. R. Long, Z. Xue, S. Antani, G. R. Thoma, X. Huang, Multimodal recurrent model with attention for automated radiology report generation, in: International Conference on Medical Image Computing and Computer-Assisted Intervention, 2018, pp. 457–466.
- [11] G. Liu, T.-M. H. Hsu, M. McDermott, W. Boag, W.-H. Weng, P. Szolovits, M. Ghassemi, Clinically accurate chest x-ray report generation, arXiv preprint arXiv:1904.02633.
- [12] X. Wang, Y. Peng, L. Lu, Z. Lu, R. M. Summers, Tienet: Text-image embedding network for common thorax disease classification and reporting in chest x-rays, in: Proceedings of the IEEE Conference on Computer Vision and Pattern Recognition, 2018, pp. 9049–9058.
- [13] S. A. Taghanaki, M. Havaei, T. Berthier, F. Dutil, L. Di Jorio, G. Hamarneh, Y. Bengio, Infomask: Masked variational latent representation to localize chest disease, in: International Conference on Medical Image Computing and Computer-Assisted Intervention, 2019, pp. 739–747.
- [14] Y. Xue, X. Huang, Improved disease classification in chest x-rays with transferred features from report generation, in: International Conference on Information Processing in Medical Imaging, 2019, pp. 125–138.
- [15] Y. Zhang, X. Wang, Z. Xu, Q. Yu, A. Yuille, D. Xu, When radiology report generation meets knowledge graph, arXiv preprint arXiv:2002.08277.
- [16] J. Peng, H. Kervadec, J. Dolz, I. B. Ayed, M. Pedersoli, C. Desrosiers, Discretely-constrained deep network for weakly supervised segmentation, Neural Networks 130 (2020) 297–308.
- [17] B.-C. Kim, J. S. Yoon, J.-S. Choi, H.-I. Suk, Multi-scale gradual integration CNN for false positive reduction in pulmonary nodule detection, Neural Networks 115 (2019) 1–10.
- [18] X. Wang, Y. Peng, L. Lu, Z. Lu, M. Bagheri, R. M. Summers, Chestx-ray8: Hospital-scale chest x-ray database and benchmarks on weakly-supervised classification and localization of common thorax diseases, in: Proceedings of the IEEE Conference on Computer Vision and Pattern Recognition, 2017, pp. 2097–2106.
- [19] J. Cai, L. Lu, A. P. Harrison, X. Shi, P. Chen, L. Yang, Iterative attention mining for weakly supervised thoracic disease pattern localization in chest x-rays, in: International Conference on Medical Image Computing and Computer-Assisted Intervention, 2018, pp. 589–598.
- [20] Z. Li, C. Wang, M. Han, Y. Xue, W. Wei, L.-J. Li, L. Fei-Fei, Thoracic disease identification and localization with limited supervision, in: Proceedings of the IEEE Conference on Computer Vision and Pattern Recognition, 2018, pp. 8290–8299.
- [21] J. Liu, G. Zhao, Y. Fei, M. Zhang, Y. Wang, Y. Yu, Align, attend and locate: Chest x-ray diagnosis via contrast induced attention network with limited supervision, in: Proceedings of the IEEE International Conference on Computer Vision, 2019, pp. 10632–10641.
- [22] B. Zhou, A. Khosla, A. Lapedriza, A. Oliva, A. Torralba, Learning deep features for discriminative localization, in: Proceedings of the IEEE Conference on Computer Vision and Pattern Recognition, 2016, pp. 2921–2929.
- [23] R. R. Selvaraju, M. Cogswell, A. Das, R. Vedantam, D. Parikh, D. Batra, Grad-CAM: Visual explanations from deep networks via gradient-based localization, in: Proceedings of the IEEE International Conference on Computer Vision, 2017, pp. 618–626.
- [24] X. Chen, H. Fang, T.-Y. Lin, R. Vedantam, S. Gupta, P. Dollár, C. L. Zitnick, Microsoft COCO captions: Data collection and evaluation server, arXiv preprint arXiv:1504.00325.
- [25] H. Fang, S. Gupta, F. Iandola, R. K. Srivastava, L. Deng, P. Dollár, J. Gao, X. He, M. Mitchell, J. C. Platt, et al., From captions to visual concepts and back, in: Proceedings of the IEEE Conference on Computer Vision and Pattern Recognition, 2015, pp. 1473–1482.
- [26] S. Antol, A. Agrawal, J. Lu, M. Mitchell, D. Batra, C. Lawrence Zitnick, D. Parikh, VQA: Visual question answering, in: Proceedings of the IEEE International Conference on Computer Vision, 2015, pp. 2425–2433.
- [27] H. Gao, J. Mao, J. Zhou, Z. Huang, L. Wang, W. Xu, Are you talking to a machine? dataset and methods for multilingual image question, in: Advances in Neural Information Processing Systems, 2015, pp. 2296–2304.
- [28] K. Kumar Singh, Y. Jae Lee, Hide-and-seek: Forcing a network to be meticulous for weakly-supervised object and action localization, in: Proceedings of the IEEE International Conference on Computer Vision, 2017, pp. 3524–3533.
- [29] X. Zhang, Y. Wei, J. Feng, Y. Yang, T. S. Huang, Adversarial complementary learning for weakly supervised object localization, in: Proceedings of the IEEE Conference on Computer Vision and Pattern Recognition, 2018, pp. 1325–1334.
- [30] X. Zhang, Y. Wei, G. Kang, Y. Yang, T. Huang, Self-produced guidance for weakly-supervised object localization, in: Proceedings of the European Conference on Computer Vision, 2018, pp. 597–613.
- [31] J. Choe, H. Shim, Attention-based dropout layer for weakly supervised object localization, in: Proceedings of the IEEE Conference on Computer Vision and Pattern Recognition, 2019, pp. 2219–2228.
- [32] Y. Zhou, Z. Chen, H. Shen, Q. Liu, R. Zhao, Y. Liang, Dual-attention focused module for weakly supervised object localization, arXiv preprint arXiv:1909.04813.
- [33] J. Irvin, P. Rajpurkar, M. Ko, Y. Yu, S. Ciurea-Ilcus, C. Chute, H. Marklund, B. Haghgoo, R. Ball, K. Shpanskaya, et al., Chexpert: A large chest radiograph dataset with uncertainty labels and expert comparison, in: Proceedings of the AAAI Conference on Artificial Intelligence, Vol. 33, 2019, pp. 590–597.
- [34] A. E. Johnson, T. J. Pollard, S. J. Berkowitz, N. R. Greenbaum, M. P. Lungren, C.-y. Deng, R. G. Mark, S. Horng, MIMIC-CXR, a de-identified publicly available database of chest radiographs with free-text reports, Scientific Data 6.
- [35] J. Johnson, A. Alahi, L. Fei-Fei, Perceptual losses for real-time style transfer and super-resolution, in: Proceedings of the European Conference on Computer Vision, 2016, pp. 694–711.
- [36] D. P. Kingma, J. Ba, Adam: A method for stochastic optimization, arXiv preprint arXiv:1412.6980.
- [37] W. Ye, J. Yao, H. Xue, Y. Li, Weakly supervised lesion localization with probabilistic-cam pooling, arXiv preprint arXiv:2005.14480.