Spectroscopic monitoring of the candidate tidal disruption event in F010042237
Abstract
We present results of spectroscopic monitoring observations of the Ultra-Luminous Infra Red Galaxy F010042237. This galaxy was observed to undergo changes in its optical spectrum, detected by comparing a spectrum from 2015 with one from 2000. These changes were coincident with photometric brightening. The main changes detected in the optical spectrum are enhanced He II 4686 emission and the appearance of He I 3898,5876 emission lines. The favoured interpretation of these changes was that of a tidal disruption event (TDE) happening in 2010. However, subsequent work suggested that these changes are caused by another hitherto unknown reason related to variations in the accretion rate in the active galactic nucleus (AGN). Our optical spectroscopic monitoring observations show that the evolution of the He lines is in line with the evolution seen in TDEs and opposite of what observed from reverberation mapping studies of AGNs, renewing the discussion on the interpretation of the flare as a TDE.
1 Introduction
A star traveling through the nuclear region of a galaxy can find itself so close to the central super-massive black hole (SMBH) that it will be ripped apart by the tidal forces of the BH (Hills, 1975; Rees, 1988; Evans & Kochanek, 1989). During this tidal disruption event (TDE), part of the stellar material will be bound to the SMBH, ultimately accreting onto it and giving rise to a luminous flare. Optical spectroscopy of TDEs shows a large degree of heterogeneity in terms of presence/absence of emission lines and their observed properties. In general, they are characterised by a blue continuum, broad H and He emission lines, luminosities of order erg sand typical evolution timescales of months up to a year (see van Velzen et al., 2020, for a review), but there are examples of more long-lived TDEs (Lin et al., 2017; Mattila et al., 2018) in other wavebands.
TDEs are an important tool to detect dormant SMBHs and the majority of these events are found in otherwise inactive galaxies. Study of TDEs in galaxies that host an Active Galactic Nucleus (AGN) is hindered by the intrinsic difficulty in distinguishing a TDE from emission from the AGN. Nonetheless, TDEs have been found in low luminosity AGNs (e.g. Prieto et al., 2016; Onori et al., 2019; Nicholl et al., 2020) and they have been invoked to explain extreme variability in AGNs (Merloni et al., 2015; Graham et al., 2017; Cannizzaro et al., 2020).
Tadhunter et al. (2017) (from here on, T17) presents the serendipitous discovery of spectral changes in the Ultra-Luminous Infra Red Galaxy (ULIRG, characterised by strong star formation and accretion onto the central SMBH, due to recent mergers) F010042237 (from here on, F01004) at z=0.118 that hosts an AGN and an SMBH with a mass M⊙ (Dasyra et al., 2006). Comparing an optical spectrum from September 2015 with one from February 2000 one finds that prominent spectral changes are; enhanced He II 4868 line emission; and the appearance of He I lines at 3898,5876. The historical lightcurve from the Catalina Sky Survey (CSS, Drake et al. 2009) shows a clear brightening starting around 2010. This together with the spectroscopic changes led T17 to propose a TDE, triggered in 2010, as the explanation for the observed changes.
Here, we report results of optical spectroscopic monitoring observations of F01004 obtained over the period August 2017 – September 2020. We discuss the evolution of the broad He emission lines, which become narrower and fainter over time. This is typical behaviour among TDEs, and contrary to that observed in reverberation mapping studies of AGNs (Peterson et al., 2004).
2 Observations and data reduction
2.1 Spectroscopic data
Optical spectra of F01004 were acquired with the Intermediate dispersion Spectrograph and Imaging System (ISIS) and the Auxiliary-port CAMera (ACAM) spectrographs, mounted at the Cassegrain focus of the William Herschel Telescope (WHT), and the Device Optimized for the LOw RESolution (DOLORES), installed at the Nasmyth B focus of the Telescopio Nazionale Galileo (TNG). Both telescopes are part of the Roque de los Muchachos observatory (La Palma, Spain). We also re-analysed the ISIS spectrum originally reported in T17 and we add two epochs of observations retrieved from the WHT archive111http://casu.ast.cam.ac.uk/casuadc/ingarch/query, to the sample of spectra we report on here. Overall, these spectra were taken over a period spanning September 2015 - 2020. In the case of ISIS, different grisms with different resolutions (R300B and R600B for the blue arm and R158R, R316R and R600R for the red arm) were used, while ACAM was always used in combination with the V400 grism and the GG395 order-sorting filter and DOLORES was used with the LR-B grism.
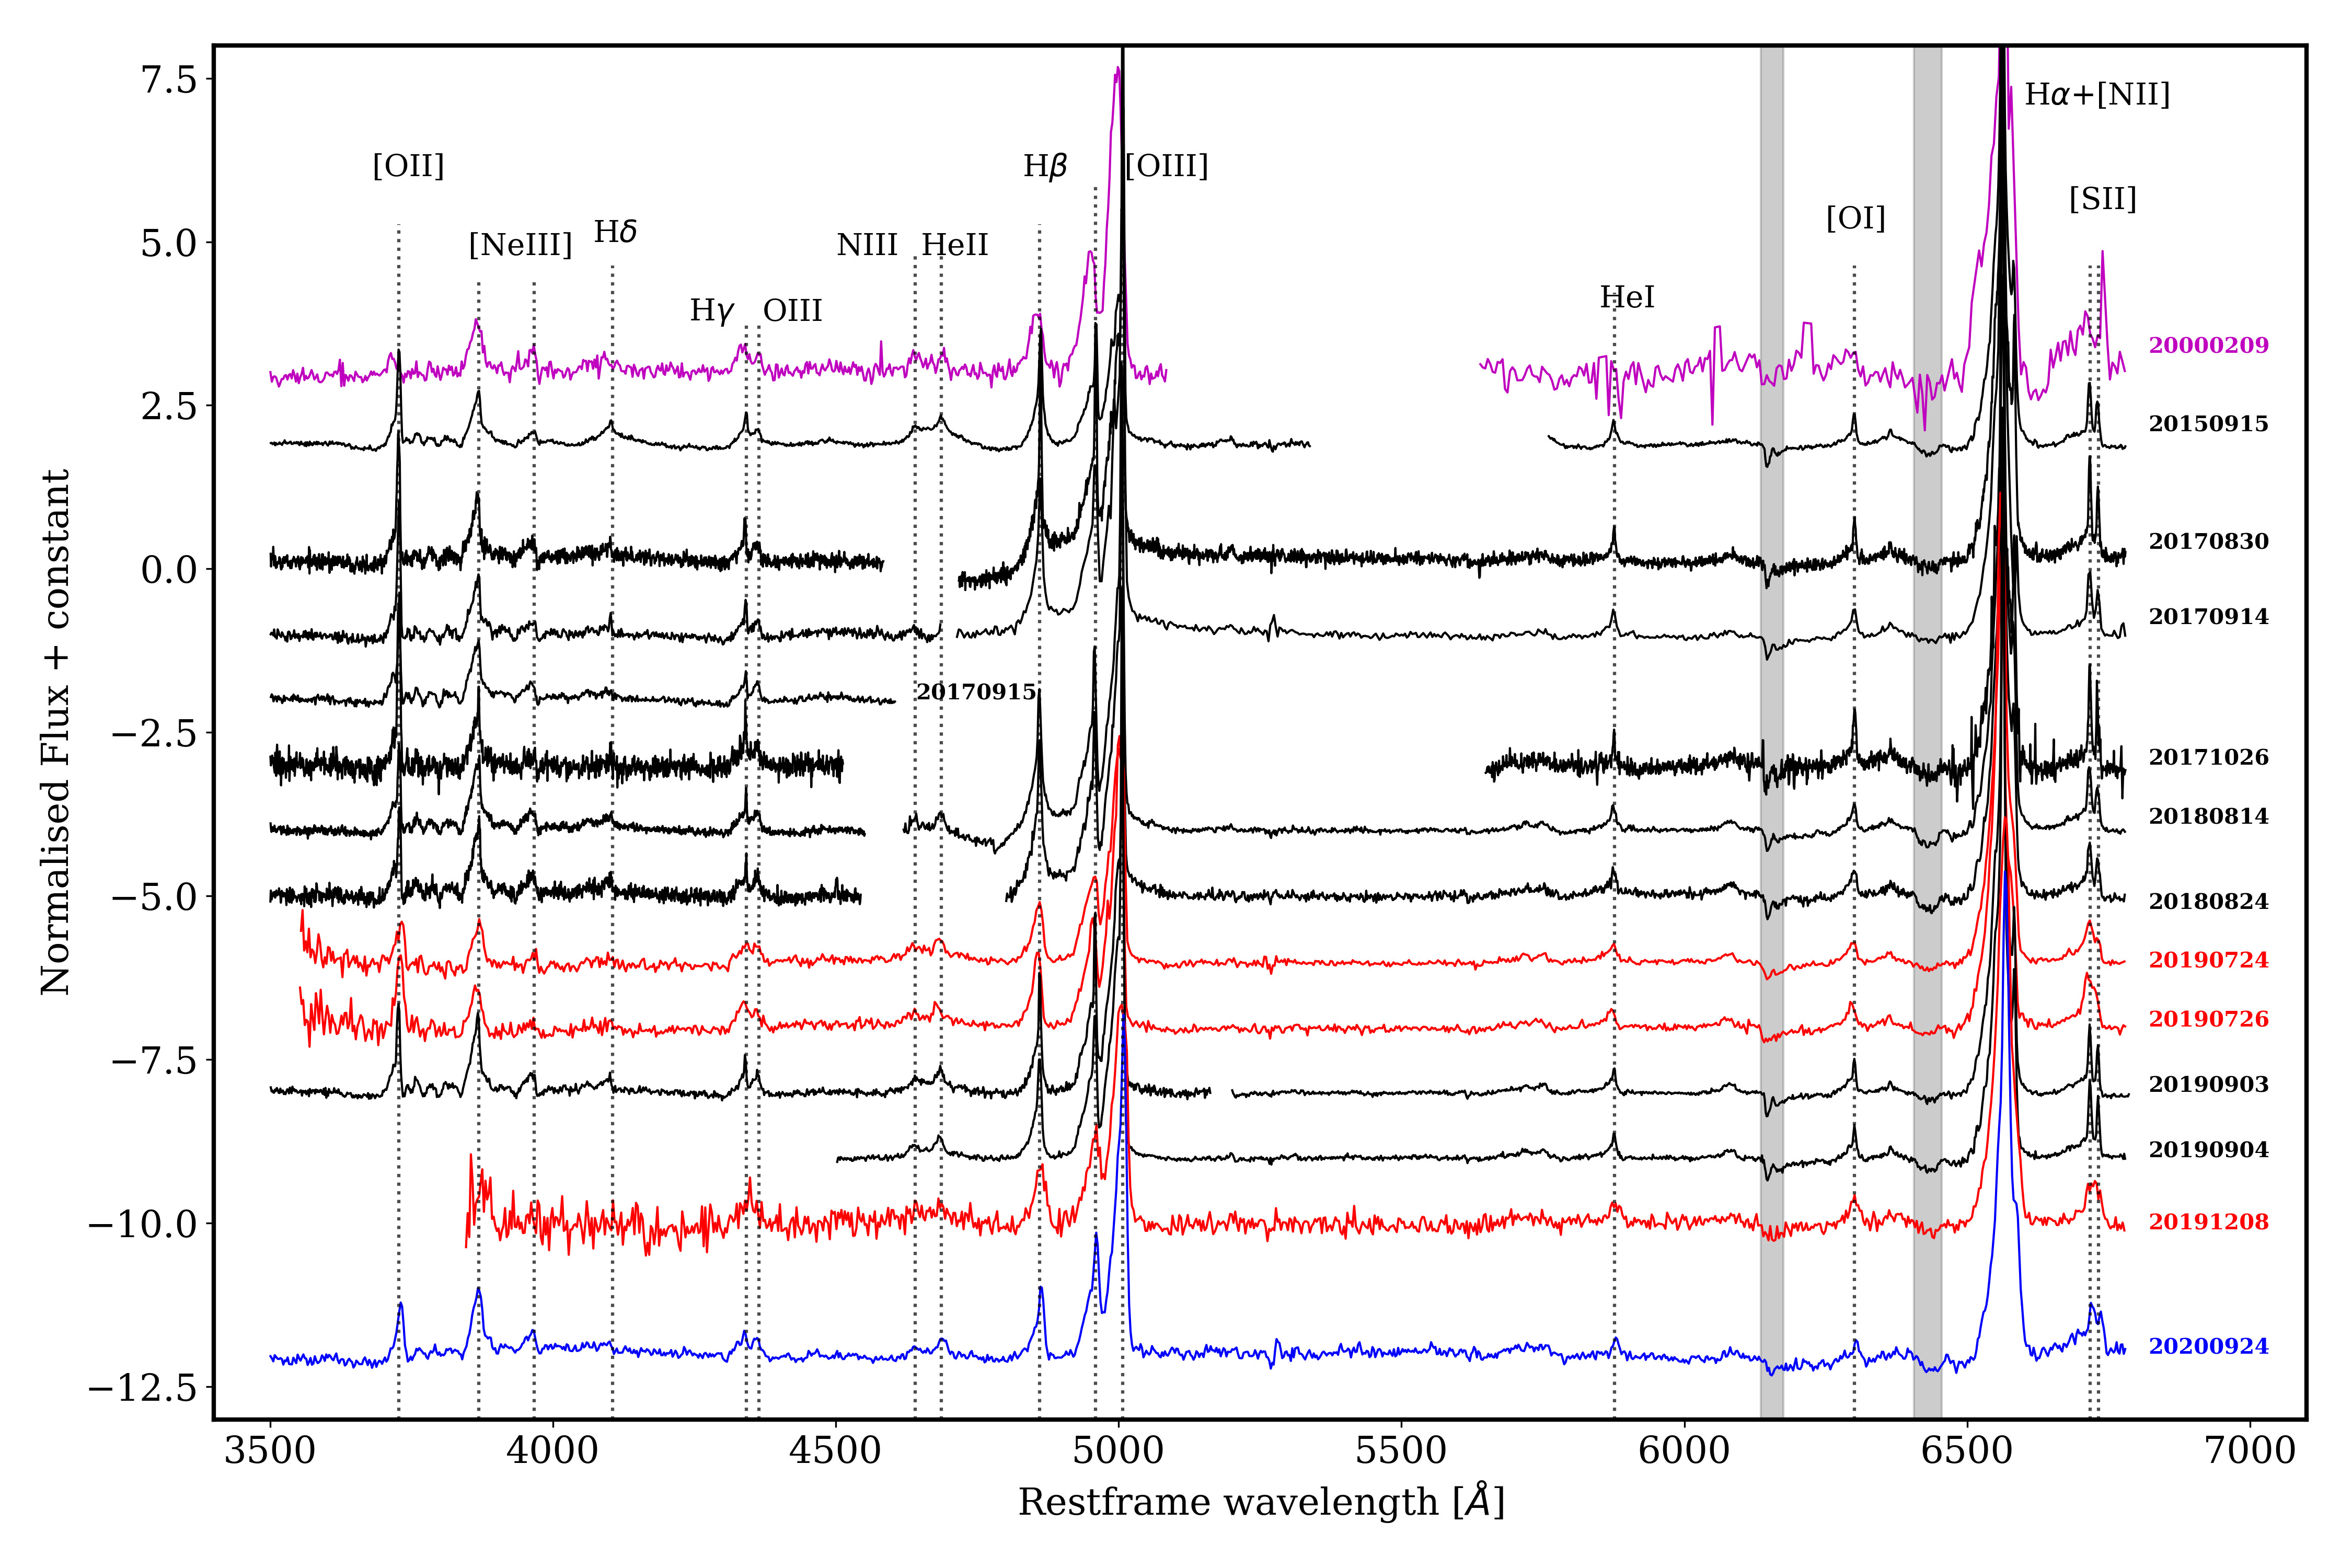
Data were reduced using standard iraf (Tody, 1986) procedures for flat field and bias correction, and wavelength calibration with arc lamps. Cosmic-rays we removed using the lacosmic procedure from van Dokkum (2001). Standard star observations were not performed at all epochs and therefore the spectra are not flux calibrated. Instead, we normalise the spectra by dividing them by a polynomial fitted to the continuum (of order 3 to 5, depending on the spectrum), masking regions with prominent emission and absorption lines during the fit. We finally also include the spectrum taken on 2000 February 9 with the Space Telescope Imaging Spectrograph (STIS) on board of the Hubble Space Telescope (HST), retrieved from the online archive222https://archive.stsci.edu/hst/. This spectrum and also the 2015 WHT/ISIS spectrum have also been presented by T17. All the observations we performed were carried out with the slit at parallactic angle, while observations retrieved from the online WHT archive were not. A journal of spectroscopic observations, with the resolution of the instrument/grism used is reported in Table 1 and all the spectra are plotted in Fig. 1.
| MJD(1) | UTC Date | Telescope-instrument | Gratings(2) | exposure time(2) | slit width | seeing(3) | (4) | |
|---|---|---|---|---|---|---|---|---|
| [days] | blue, red | [s] | [′′] | [′′] | [Å] | [Å] | ||
| 51583.73 | 2000/02/09 | HST-STIS | G430L, G750L | 2904, 1754 (6) | 0.2 | - | 4.1, 7.4 | 4.1, 7.4 |
| 57280.08 | 2015/09/15 | WHT-ISIS | R300B, R316R | 6x1000, 6x1000 | 1.5 | 0.60 | 4.1, 5.1 | 1.6, 2.0 |
| 57996.19 | 2017/08/30 | WHT-ISIS | R300B, R316R | 2x1800, 2x1800 | 1.0 | 0.80 | 3.7, 3.8 | 3.0, 3.0 |
| 58011.00 | 2017/09/14 | WHT-ISIS | R300B, R158R | 1800, 1800 | 1.0 | 0.90 | 3.9, 3.4 | 3.5, 3.1 |
| 58012.12 | 2017/09/15 | WHT-ISIS | R300B | 2x1800 | 1.0 | 0.60 | 3.9 | 2.3 |
| 58052.99 | 2017/10/26 | WHT-ISIS | R600B, R600R | 2x1800, 2x1800 | 1.5 | 2.50 | 3.0, 2.6 | 3.0, 2.6 |
| 58345.15 | 2018/08/14 | WHT-ISIS | R300B, R158R | 2x1800, 2x1800 | 1.0 | 0.35 | 3.7, 7.0 | 1.3, 2.4 |
| 58355.22 | 2018/08/24 | WHT-ISIS | R300B, R158R | 1800, 1800 | 1.0 | 0.40 | 3.7, 7.0 | 1.5, 2.8 |
| 58689.20 | 2019/07/24 | WHT-ACAM | V400 | 1800 | 1.0 | 0.65 | 13.6 | 8.9 |
| 58691.20 | 2019/07/26 | WHT-ACAM | V400 | 1800 | 1.0 | 0.75 | 13.6 | 10.3 |
| 58730.05 | 2019/09/03 | WHT-ISIS | R300B, R316R | 3x900, 6x1200 | 1.3 | 0.60 | 4.9, 4.4 | 2.3, 2.0 |
| 58731.13 | 2019/09/04 | WHT-ISIS | R316R | 7x1200 | 1.3 | 0.60 | 4.4 | 2.0 |
| 58825.82 | 2019/12/08 | WHT-ACAM | V400 | 1800 | 1.5 | 1.10 | 19 | 14.1 |
| 59117.10 | 2020/09/24 | TNG-DOLORES | LR-B | 2x1800 | 1.0 | 0.75 | 7.3 | 5.5 |
Note.(1) Modified Julian Day of observations. (2) In the case of ISIS and STIS, the blue and red arms have different gratings, with different resolutions. The ISIS grating names ending with B denote those used in the blue arm, the ones ending in R those of the red arm. The exposure time is given for each grating separately. Multiple exposures obtained on the same day have been averaged after extraction. (3) The reported atmospheric seeing is the average value over the total exposure time. (4,5) Resolution element, as measured from arc lines and corrected for the seeing when this is lower than the slit width, by multiplying by the ratio between seeing and slit width. For ISIS and STIS, this is given for each grating. (6) The total exposure time of the STIS spectra is given (720+720+780+754s for G430L and 624+624+506 for G750L). Epochs marked with were retrieved from the respective observatory data archives (see text).
3 Data analysis and results
The spectra (see Fig. 1) reveal a number of emission lines from different atomic species: [O II] 3727, [Ne III] 3869, H, H, [O III] 4363,4959,5007, N III 4640, He II 4686, H, He I 3889,5876, [O I] 6300, H, [N II] 6548,6584 and [S II] 6717,6731. Comparing the STIS spectrum (2000) with the ISIS spectrum obtained in 2015 shows that He lines were either not detected (He I) or much fainter (He II) in the former.
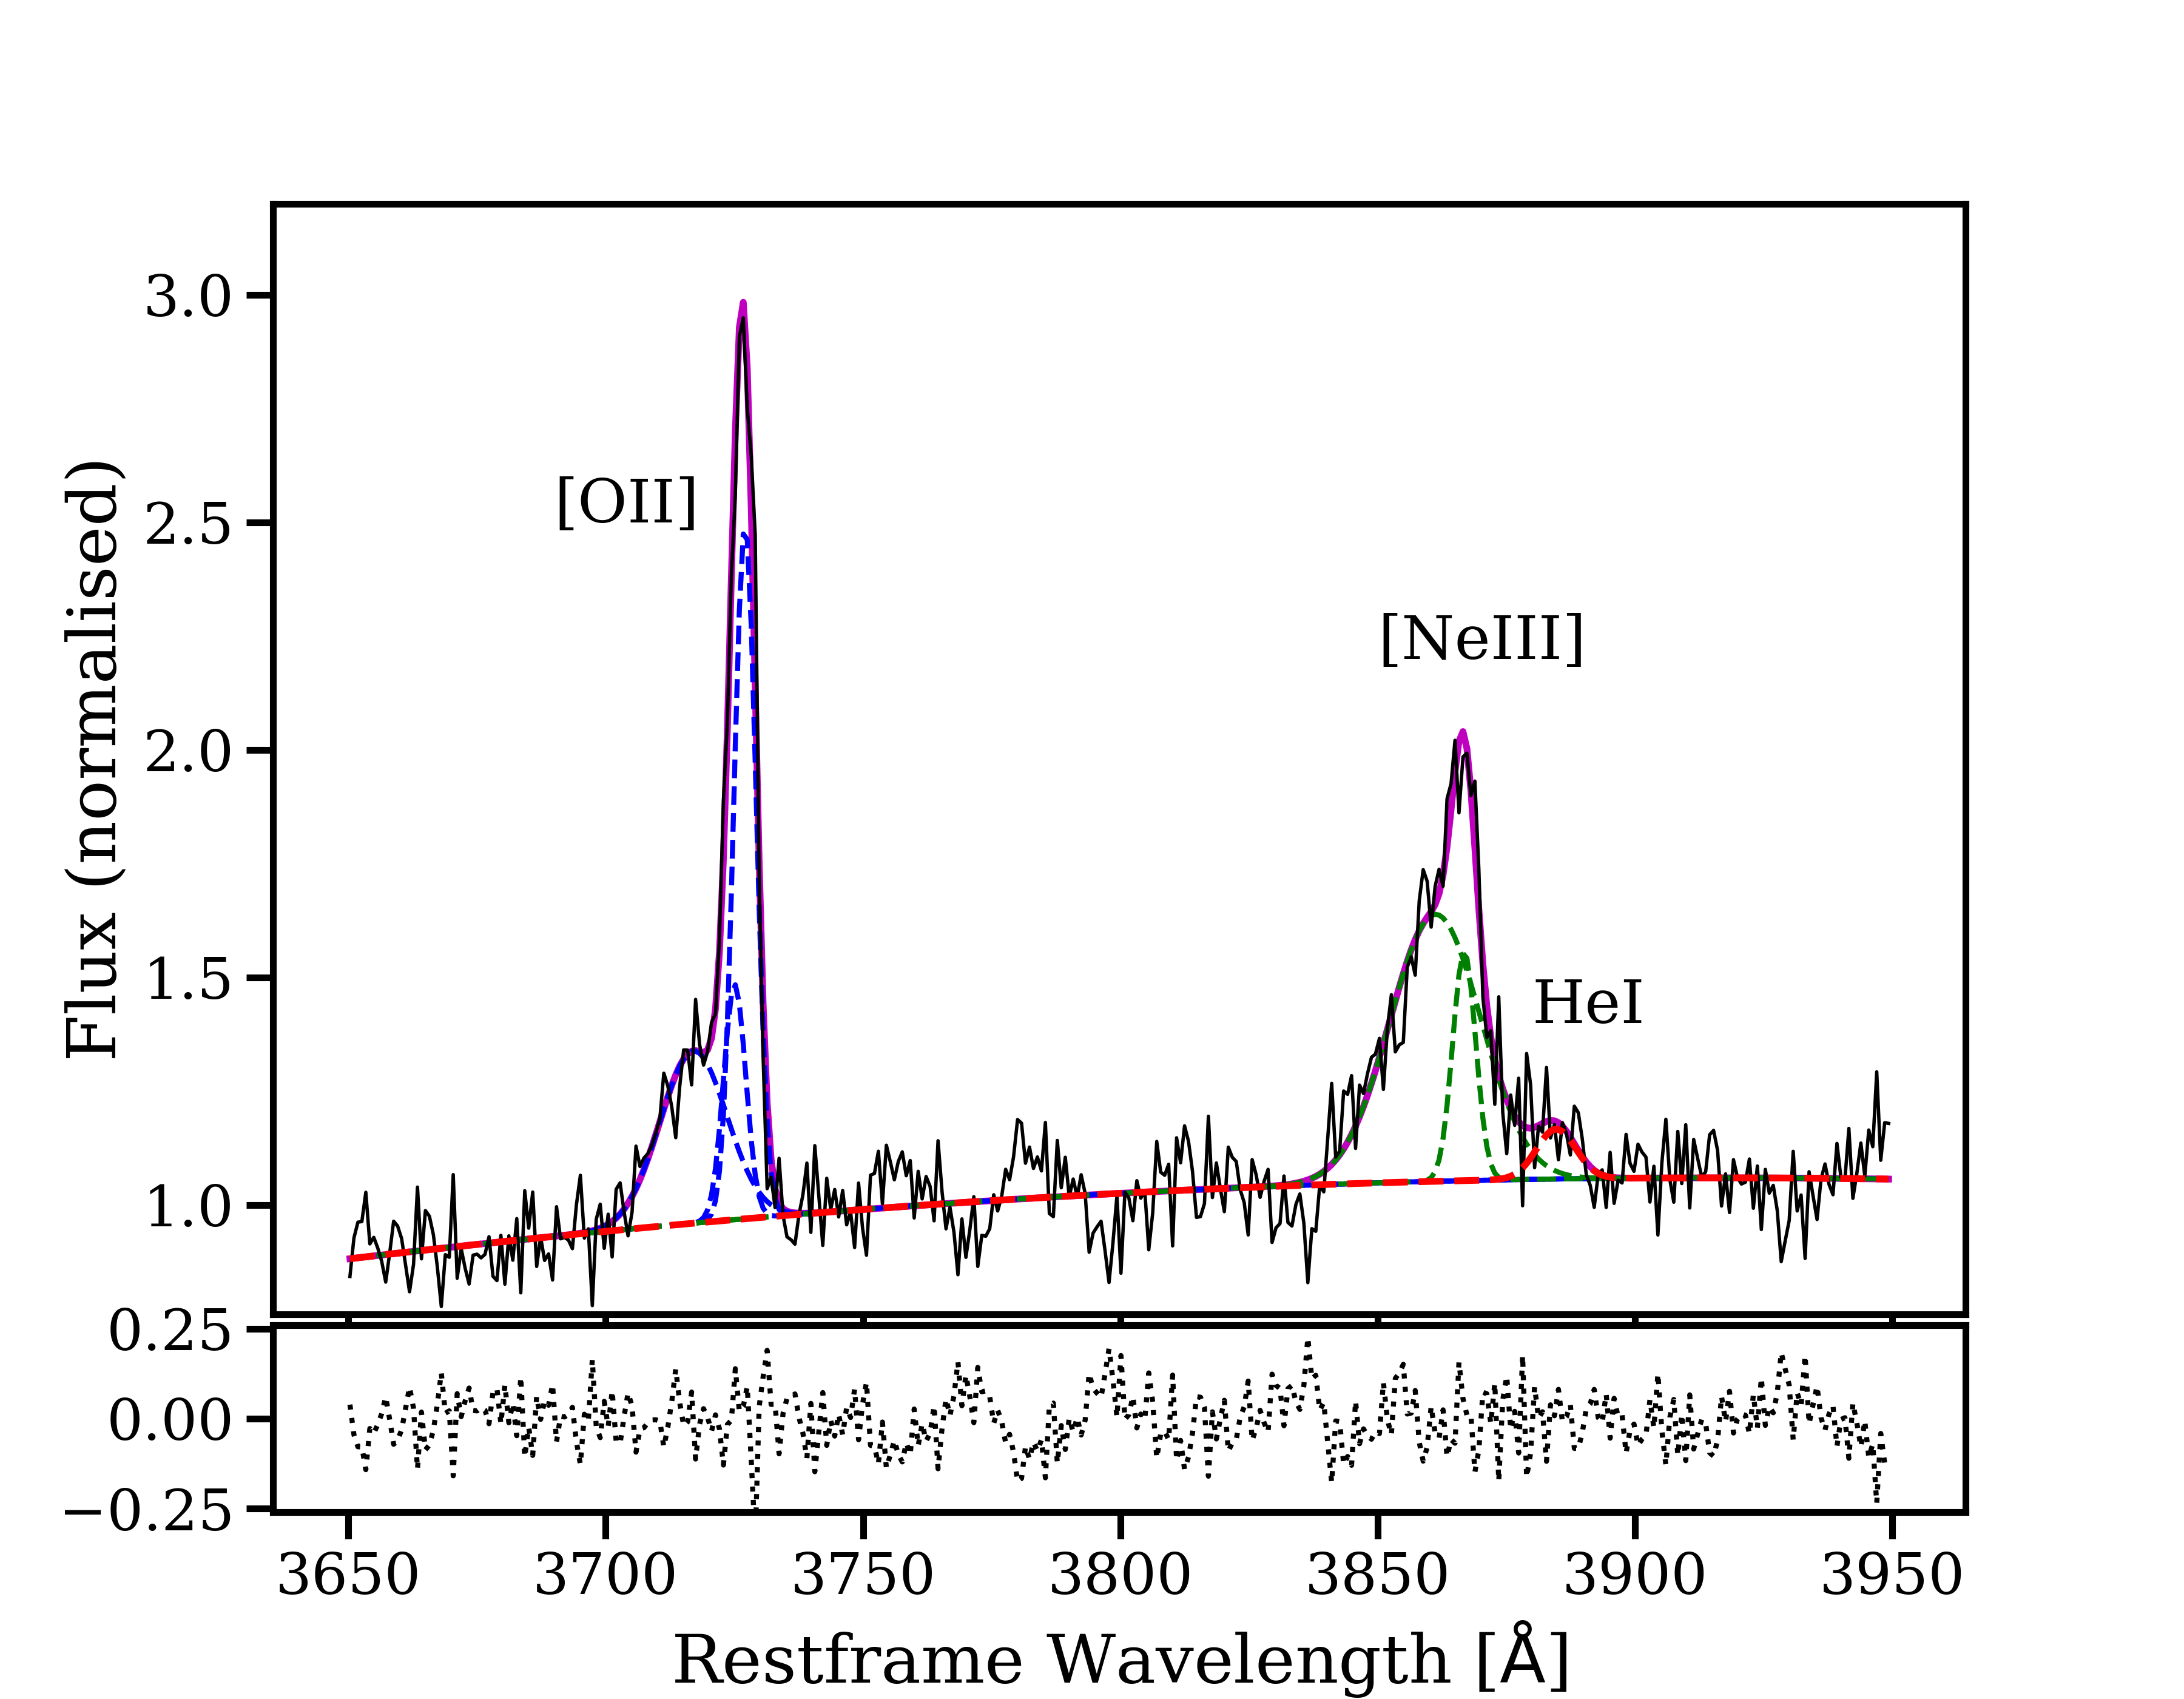
The N III 4640 emission line is consistent with being caused by Wolf-Rayet stars (see T17 and references therein), as is the He II 4686 in the pre-flare HST spectrum. The rest of the emission lines are typically observed in AGNs. We fit the emission lines with a combination of Gaussian functions and a polynomial (to fit the local continuum), using the python package lmfit (Newville et al., 2014). We plot an example of the fit to the H and [O III] 4959,5007 emission lines in Fig. 2. All emission lines caused by activity in the host galaxy show the same structure, with a narrow peak and a broader, blue-shifted, base. There is evidence for an additional, third, component, with Full Width Half Maximum (FWHM) in between that of the narrow peak and that of the broader base. The central wavelength also between that of the broad and that of the narrow component. We were able to constrain this third component only for the strongest emission lines when detected with the highest signal–to–noise ratios (SNRs).
In the lower resolution spectra as well as in lower SNR spectra, the He I 5876 emission is often well-fit by a single Gaussian function, whereas in the higher resolution and the higher SNR spectra, we find that two Gaussians (a broad base and a narrower peak) are required to describe the emission line. The He II 4868 and He I 3889 emission lines are well fit by a single Gaussian.
During the fitting procedure, we forced the FWHM of the narrow lines close in wavelength to be the same. Furthermore, the wavelength separation of known line doublets has been fixed to their laboratory values. Both these actions served to reduce the number of degrees of freedom in the fit. The resulting values for the emission line parameters have been corrected for the instrumental broadening, using the values reported in Table 1. When the atmospherical seeing was smaller than the width of the slit, we calculate the instrumental resolution by multiplying the resolution element (measured from the arc lines) by the ratio between seeing and slit width. Due to the extended nature of the source, this may not be correct, as the resolution for lines emitted in the extended regions of the galaxy will depend on the geometry of those regions. As explained in Sec. 4, we propose that the He emission lines (i.e., the emission lines we are interested in) are mostly emitted in the nuclear region. We can therefore assume that the emitting region of the He lines is point-like and our calculation of the spectral resolution a valid approximation.
The position of the galaxy on a Baldwin, Phillips & Terlevich (BPT) diagram (Baldwin et al., 1981) is in the “composite” region, between H II regions and AGNs, suggesting that the galaxy is showing emission from both an AGN and star forming activity. This dual ionising source was already inferred by T17, where they also reported that the emission lines can have three components. We find that the FWHM of the narrow peaks varies somewhat with time. This can be explained if (part of) the narrow emission lines is caused by star formation from an extended, spatially resolved region of the galaxy. Then, the different slit widths, seeing conditions, and position angles of the slit contribute to us capturing a variable amount of light from the extended star-forming regions of the galaxy, causing the fraction of the emission line caused by star formation to vary. Furthermore, it is possible that the projected velocity of that component in the slit varies with our different spectra as well.
We focus our analysis on the He lines, as T17 reported the largest variations in the properties of these lines. In Fig. 3, we plot the evolution of the equivalent width (EW) and FWHM of the He emission lines. In order to trace the evolution of the He I 5876 emission line, we combine the results of the two components, when resolved, by adding the EW and adding in quadrature the FWHM. The uncertainties were also added in quadrature for both the EW and the FWHM. We check the effect of this combination by comparing the values of the FWHM and EW for both components, when resolved, before and after their combination. The value of the FWHM is dominated by the broad component. The value of the EW of the narrow component does not show variations above the measurement error and therefore the effect of the combination is a shift in the vertical direction. The average value of the EW of the narrow component is 2.3 Å. The lack of evolution of the narrow He I 5876 suggests that this component is due to star formation and is not related to the transient event. We tried to check this by investigating if a He I 5876 emission line would be detected in the pre-flare HST-STIS spectrum. To do this, we added a Gaussian curve at the resolution of the instrument (see Tab. 1) and with EW2.3 Å, to the spectrum. Unfortunately, the area around 5876 Å has a low SNR (see Fig. 1) and such an emission line could not be detected above the continuum noise in the HST spectrum.
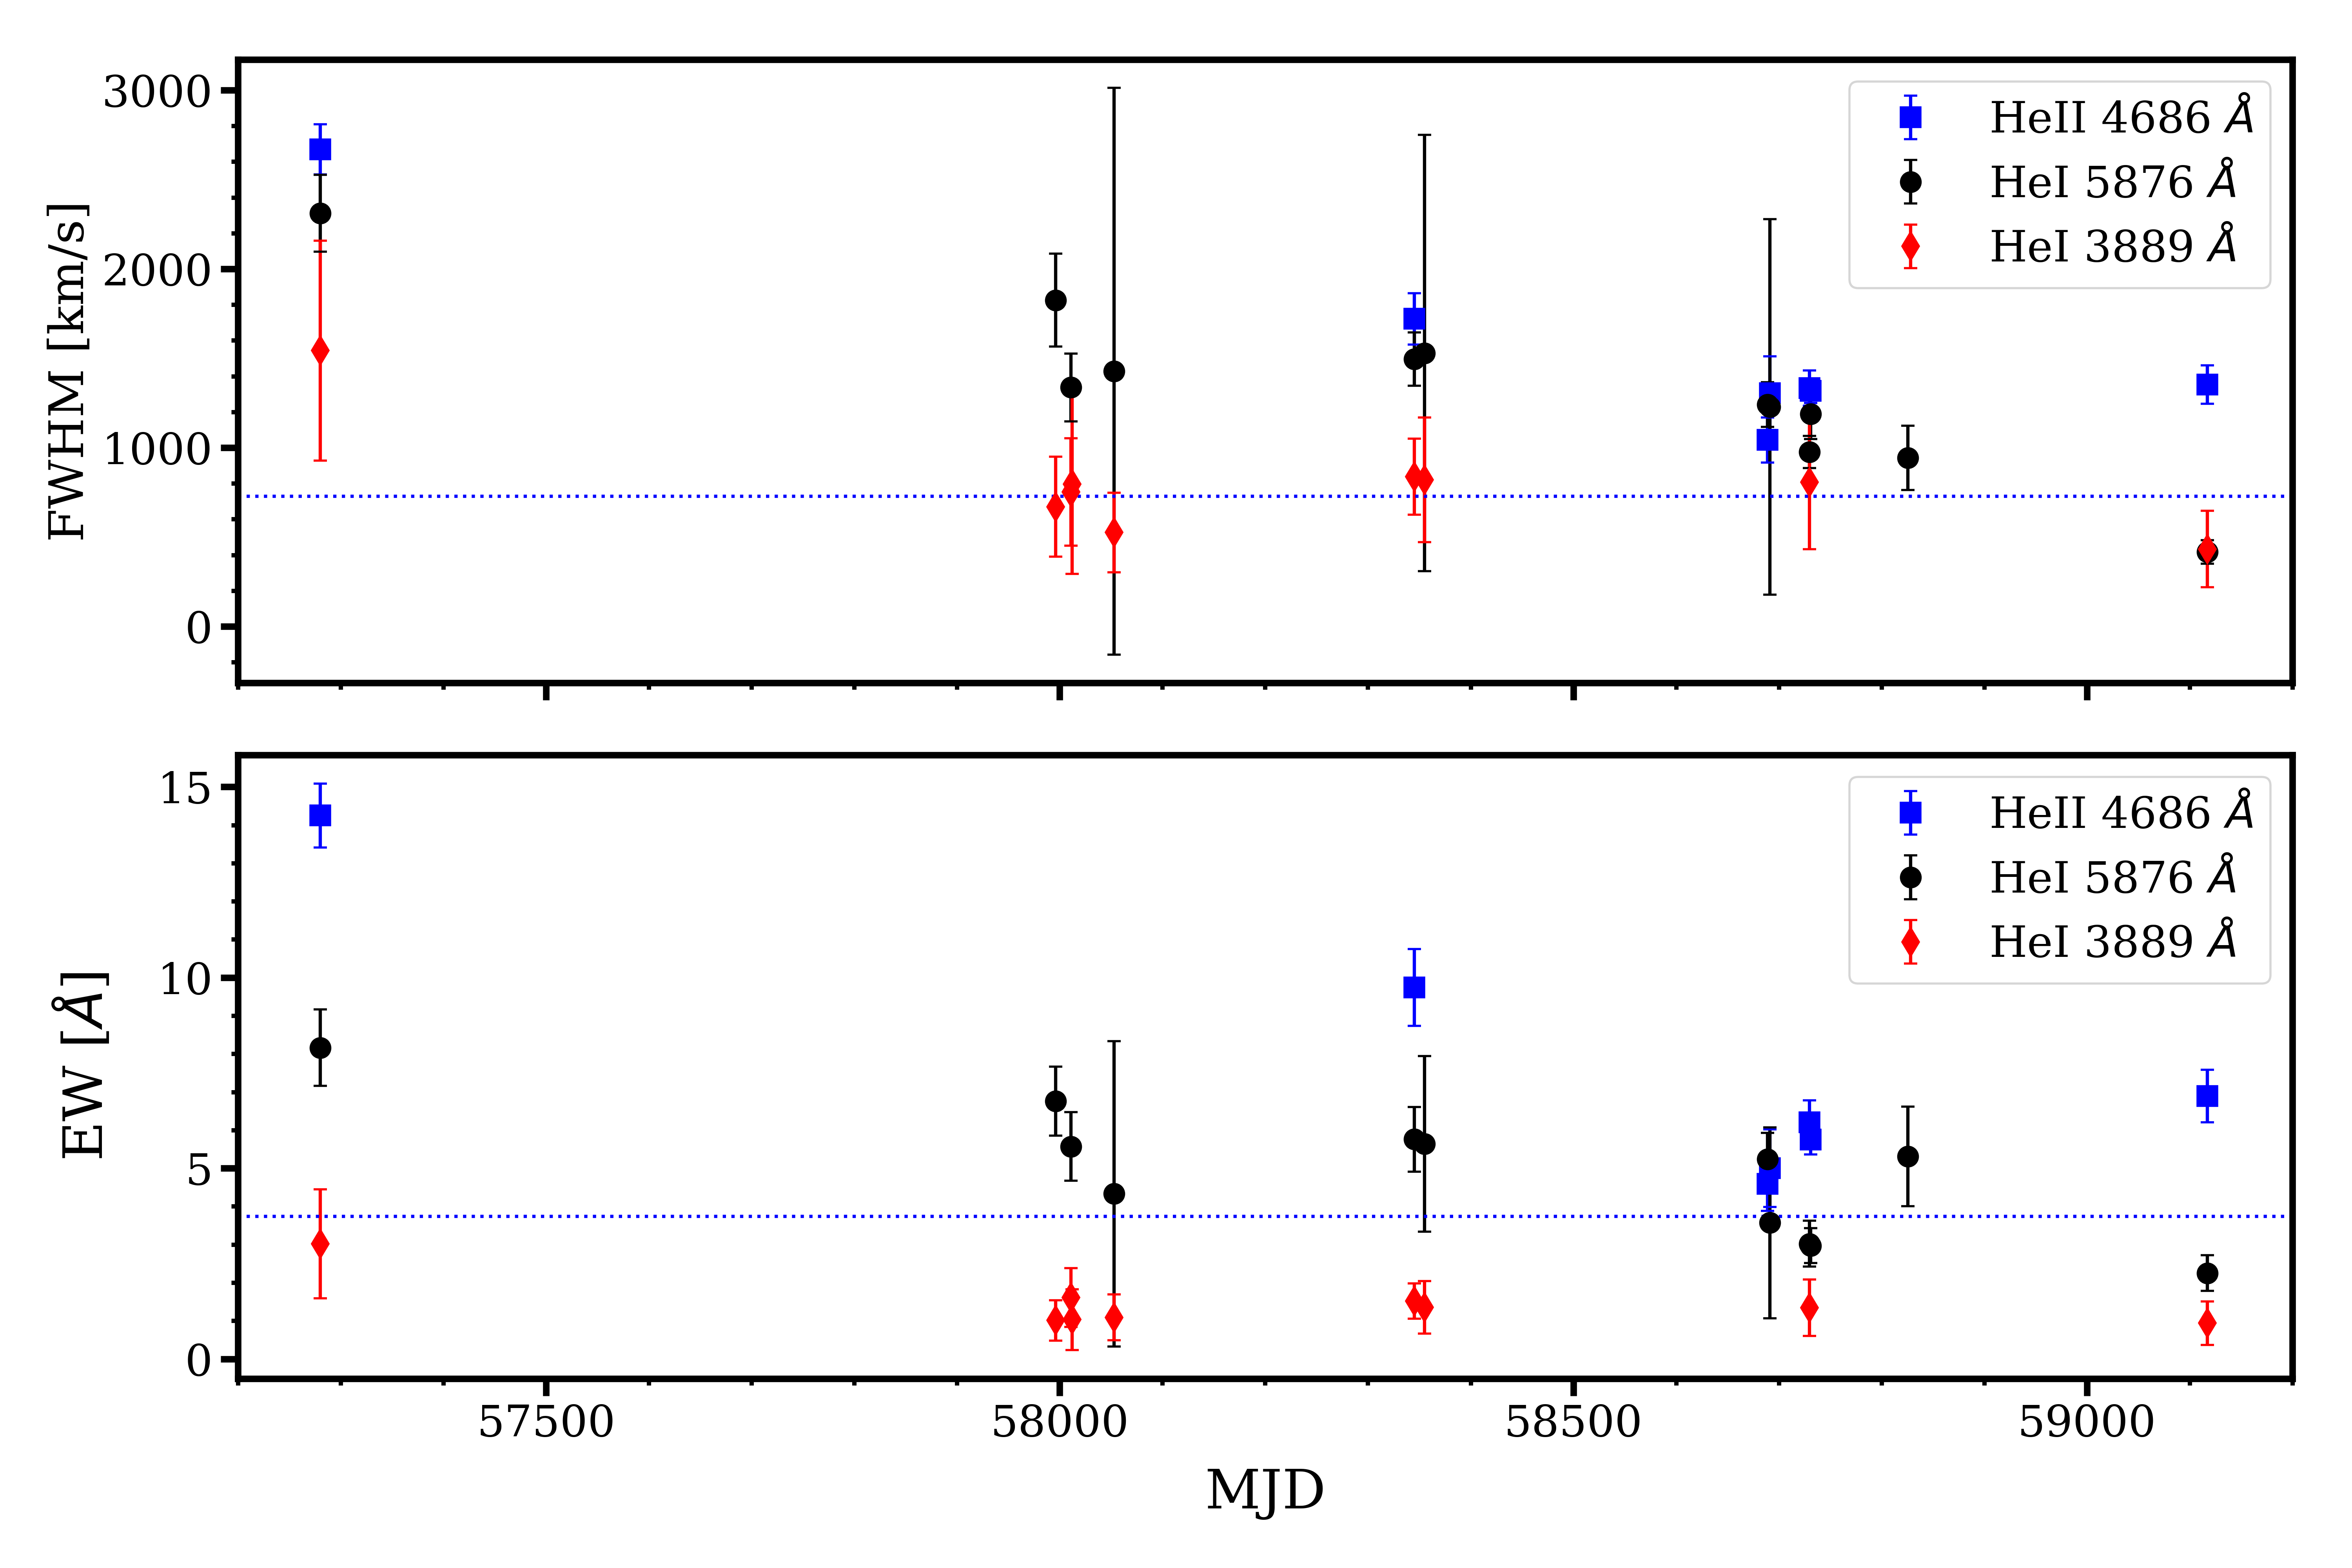
The FWHM and EW of the He II line show a gradual decrease over the duration of our follow-up campaign: the FWHM decreases from 2700 km s-1to 1350 km s-1and the EW from 14 Å to 7 Å. Both the FWHM and the EW have not yet returned to the values measured during the STIS spectrum. The evolution in the EW and FWHM of the He I lines is less clear, but especially that of the 5876 line seems to follow a similar trend as that of He II. In contrast, the other lines of similar width i.e. the broad bases of the other emission lines, do not show significant evolution with time in their FWHM, while the EW of some of them (mainly H and [O III]4959,5007) show an increase between MJD 57280 and 58345, to subsequently decay back to the initial value (see Table 2).
We measure the offset of the lines with respect to their rest-frame wavelength. It is important to note that in good observing conditions (i.e., when the value of the seeing in arcseconds is smaller than the slit width, which is the case for many of our observations, see Table 1) the wavelength calibration of the source spectrum could be slightly shifted with respect to that derived by the arc lines (as the latter do fill the whole slit), due to possible imperfections in centering of the source in the slit. This can in turn affect the velocity offset measurements by a few times 100 km s-1. However, the narrow lines do not show a significant offset with respect to their restframe wavelength (its absolute value is always below 200 km s-1), implying that the shifts in the wavelength scale caused by the potential imperfect centring of the source in the slit are smaller than a few hundred km s-1. This is in line with the fact that the extended nature of the source acts as a mitigating factor for any small imperfect centring of the source in the slit.
The broad bases of the emission lines are all blue-shifted. We measure the shift of the broad bases with respect to the central wavelength of the narrow lines, assuming that those are at their restframe wavelength. Each broad line has a different blueshift, but none of them show a clear evolution with time. The velocity offset values are all km s-1.
For the He I 5876 lines, we only separate the narrow and broader component of the emission line when the higher resolution gratings were used. Only in those cases can we reliably check for a potential shift between the two components. Therefore, for the other He lines as well as for the He I 5876 lines, we measure both the shift with respect to the restframe wavelength and with respect to the central wavelength of the closest narrow line (Ne III for He I 3889, [O III] 5007 for He II and [S II] 6731 for He I ). We find that the blueshift is a few 100 km s-1and the two measurements are consistent with being the same, within the 1 uncertainties. Again, no clear evolution in time was present and at some epochs, the shift is consistent with zero.
4 Discussion
Our optical spectroscopic observations of F01004 reveal a gradual decrease in the FWHM and EW of the He II and the He I line at . The error bars on the individual measurements for the He I 3889 line are larger, especially those on the FWHM, making it more difficult to detect any trend in the FWHM for this line. We find no strong evolution in the properties of the other detected emission lines.
In T17, the authors proposed that the flare and the spectral changes can be explained by a TDE happening 5 years prior the 2015 ISIS spectrum. Our spectroscopic monitoring provides evidence in support of this interpretation. We first discuss this supportive evidence, before comparing our results with those from Trakhtenbrot et al. (2019) who come to the conclusion that F01004 and a group of sources showing similar spectroscopic and photometric characteristics (i.e. a moderately broad He II and a flare in the optical light curve) is caused by new, so far unexplained AGN variability.
The presence of broad He emission lines is common in TDEs and especially a broad He II 4686 emission is considered a strong indicator of such phenomena (see van Velzen et al. 2020, e.g. ). However, while the FWHM of the He II 4686 emission line in F01004 can be called “broad”, in most TDEs the value of the FWHM is significantly larger than that observed in F01004 (cf. Trakhtenbrot et al. 2019). Nevertheless, as we showed in this paper, the evolution of its FWHM over time in F01004 is in line with what seen in other TDE candidates: the lines become narrower with time (Holoien et al., 2014; Brown et al., 2017; Onori et al., 2019) as the flare decays and the line EW becomes lower. This behaviour is opposite of that seen in AGNs, where reverberation mapping studies have shown that the lines become broader with decreasing source luminosity (e.g. Peterson et al., 2004). The evolution of the EW of the He lines follows a more shallow but similar decay.
As mentioned in Sec. 3, the different position angle and observing conditions of the slit at different epochs make us capture a varying amount of light from any spatially extended emission lines regions of F01004. In the pre-outburst spectrum, the He II and N III line complex is mostly caused by emission from Wolf-Rayet stars (T17). The variation observed in the He II line could, perhaps, be (partially) caused by this effect and not by an intrinsic change in the line emission properties. Whereas it is probably somewhat contrived that the combination of slit width, seeing, and parallactic angle work together to cause a gradual change in the EW, it is even more difficult to envisage how this would lead to a gradual decay in FWHM together with the observed evolution of EW. Finally, the N III line does not show the same evolution as the He II, further disfavouring this scenario. Therefore, we conclude that the observed trends in the EW and FWHM of the He II and the He I line at is caused by changes in the accretion flow around the central supermassive black hole.
If a TDE caused the flaring activity in F01004, it must be quite long-lived, as our last spectrum, 10 years after the inferred date of the TDE, still shows He II emission above the pre-outburst level. Such a long-lived TDE is rare but not unprecedented. Lin et al. (2017) reported on a TDE with X-ray emission lasting for more than a decade at around the Eddington level, explaining it as a TDE where the circularisation of the debris is slow. Late time X-ray observations of optically selected TDEs have also shown that the TDE phenomenon can be long lasting (Jonker et al., 2020). However, these examples are for the X-ray emission. So far, there is no reported optical emission that lasts this long. Perhaps, the presence of an AGN in F01004 could explain the decade-long signatures of a TDE. TDEs in AGNs are not well explored, but the interaction between the debris stream and the pre-existing accretion disk can significantly modify the canonical picture of a year long decay (Chan et al., 2019).
The BH mass of , calculated in Dasyra et al. (2006), is below the BH mass limit, for a non-rotating BH, above which the tidal radius for a sun-like star is inside the event horizon (and its disruption therefore impossible). In Dasyra et al. (2006), the authors also explore the limits of dynamical mass measurements in the case of ULIRGs, due to the typically recent merger activity of these galaxies, finding that for a post-merger object like F01004, the measurement is reliable. We stress that even taking the value as an order of magnitude estimate does not affect the interpretation of the transient event, since for a more massive star and/or a spinning BH, the BH mass limit for a TDE to be possible can increase up to (Kesden, 2012).
Trakhtenbrot et al. (2019) argues that F01004 and two other similar transients are due to unusual AGN activity rather than being triggered by the disruption of a star. Their main argument for this is the long duration of the flare and the FWHM of the He II line, which is smaller than what commonly observed in TDEs (e.g Arcavi et al., 2014). Furthermore, the He lines in F01004 show a lower blue-shift than typically seen in TDEs, where the broad emission lines are often blue-shifted by several 1000’s km s-1(e.g. Nicholl et al., 2020). It is important to note that optical TDEs are often selected on the width of their emission lines and, therefore, that a He II line is detected narrower than what seen in TDEs may be a product of selection bias.
Trakhtenbrot et al. (2019) associates the N III and He II emission with the Bowen fluorescence mechanism (BF, Bowen, 1934, 1935), a cascade of transitions initially triggered by enhanced UV and He II Ly emission. In the case of F01004, the N III and He II emission pre-outburst are associated with WR stars and the N III line emission is not enhanced during the outburst, unlike the He II emission line, implying that the He II line has a different origin in F01004 than perhaps in several other sources in the paper of Trakhtenbrot et al. (2019).
We also find a broad, blue-shifted component to the forbidden emission lines. In AGNs, broad emission lines typically come from the high-velocity broad line region (BLR; Peterson 2006). The density in the BLR is so high that the forbidden lines are collisionally suppressed. In F01004, the forbidden and permitted (hydrogen) emission lines have a similar structure, with a narrow peak and a broad base (with tentative evidence for a third, intermediate component). Furthermore, there is no evidence for changes in the FWHM and EW of these lines with time. This suggests that all the broad components to the forbidden and permitted lines are due to outflows from large spatial scales induced by the circumnuclear starburst and/or by the AGN, as commonly observed in ULIRGs (which of the two is the main driver of the outflow is still under debate (Rupke et al., 2005; Rodríguez Zaurín et al., 2013)).
In Trakhtenbrot et al. (2019), the authors associate the observed broad He II emission line with the BLR, illuminated by the enhanced UV emission. Given that in the case of F01004, both the forbidden as well as permitted lines have a broad component likely caused by an outflow, we do not seem to detect lines coming from the BLR, which may indicate that the BLR is obscured from our line of sight. This, together with the fact that the evolution of the FWHM of the He II line is unlike that in reverberation mapping studies of AGN, challenges the AGN scenario for the observed photometric and spectroscopic changes. Perhaps, following Roth & Kasen (2018), the TDE-induced lines originate in a more spherical photosphere, and the FWHM is determined in part by electron scattering. The observed decrease of FWHM may then trace a decrease in the ambient density.
Overall, the evolution of the He lines and the difference between their evolution and the evolution of the other lines seems to be inconsistent with typical TDE behaviour but also with typical AGN behaviour.
Data availability
All data will be made available in a reproduction package uploaded to Zenodo.
Appendix A Line fitting results
| [O II] | [Ne III] | He I | |||||||
|---|---|---|---|---|---|---|---|---|---|
| MJD | [Å] | FWHM [km s-1] | EW [Å] | [Å] | FWHM [km s-1] | EW [Å] | [Å] | FWHM [km s-1] | EW [Å] |
| 51583.73 | 3714.4 1.0 | 1100 200 | 4.3 1.0 | 3864.2 0.6 | 1900 110 | 18.3 1.4 | |||
| 57280.08 | 3719.0 1.8 | 1130 250 | 4.9 1.2 | 3862.2 2.2 | 1590 220 | 11.0 1.9 | 3885.1 5.2 | 1540 610 | 3.0 1.4 |
| 57996.19 | 3717.2 1.3 | 1160 210 | 5.9 1.2 | 3861.1 0.7 | 1660 100 | 13.0 1.2 | 3884.8 1.5 | 670 280 | 1.0 0.5 |
| 58011.00 | 3718.1 1.6 | 1160 260 | 6.1 1.5 | 3861.6 1.1 | 1530 140 | 12.9 1.5 | 3883.2 1.8 | 750 300 | 1.6 0.8 |
| 58012.12 | 3717.2 1.0 | 1220 190 | 6.1 1.1 | 3861.6 1.3 | 1570 160 | 13.4 1.6 | 3882.4 3.3 | 790 500 | 1.0 0.8 |
| 58052.99 | 3718.5 1.5 | 1080 250 | 7.0 1.7 | 3862.7 0.6 | 1700 110 | 14.7 1.3 | 3886.8 1.2 | 520 220 | 1.1 0.6 |
| 58345.15 | 3718.5 0.8 | 1200 140 | 5.9 0.8 | 3862.6 0.5 | 1600 60 | 16.0 0.8 | 3885.2 1.2 | 840 210 | 1.5 0.5 |
| 58355.22 | 3718.9 0.9 | 1090 170 | 5.7 1.0 | 3862.9 0.8 | 1510 110 | 14.6 1.2 | 3883.8 2.1 | 820 350 | 1.3 0.7 |
| 58689.20 | 3724.0 4.8 | 1100 620 | 6.6 4.1 | 3865.7 1.4 | 1590 280 | 13.6 4.0 | |||
| 58691.20 | |||||||||
| 58730.05 | 3717.4 1.6 | 1100 250 | 5.2 1.3 | 3861.8 0.9 | 1570 110 | 15.5 1.5 | 3882.9 2.3 | 810 370 | 1.3 0.7 |
| 58731.13 | |||||||||
| 58825.82 | |||||||||
| 59117.10 | 3723.8 9.7 | 1160 900 | 4.7 5.1 | 3865.3 0.9 | 1560 90 | 16.6 1.7 | 3887.6 1.1 | 430 210 | 0.9 0.6 |
| N III | He II | H | |||||||
| MJD | [Å] | FWHM [km s-1] | EW [Å] | [Å] | FWHM [km s-1] | EW [Å] | [Å] | FWHM [km s-1] | EW [Å] |
| 51583.73 | 4647.1 3.3 | 2680 640 | 8.8 2.7 | 4689.8 1.2 | 730 180 | 3.7 1.3 | 4848.1 5.0 | 1690 440 | 13.6 5.2 |
| 57280.08 | 4641.9 1.0 | 1990 130 | 7.7 0.6 | 4685.4 0.8 | 2670 140 | 14.2 0.8 | 4858.5 0.3 | 1490 50 | 18.5 0.9 |
| 57996.19 | 4857.6 0.5 | 2030 80 | 30.2 1.7 | ||||||
| 58011.00 | 4857.0 1.0 | 1840 160 | 20.8 2.6 | ||||||
| 58012.12 | |||||||||
| 58052.99 | |||||||||
| 58345.15 | 4641.9 1.8 | 2000 340 | 7.6 1.6 | 4685.2 0.9 | 1720 140 | 9.7 1.0 | 4857.1 0.6 | 2100 110 | 28.0 2.0 |
| 58355.22 | 4856.6 0.7 | 1940 120 | 25.3 2.2 | ||||||
| 58689.20 | 4644.5 1.9 | 2430 370 | 6.4 1.2 | 4685.6 0.8 | 1040 120 | 4.6 0.7 | 4854.3 0.8 | 1410 90 | 15.1 1.5 |
| 58691.20 | 4640.1 2.2 | 1910 410 | 4.7 1.3 | 4682.8 1.3 | 1300 210 | 5.0 1.0 | 4849.6 2.8 | 1330 270 | 9.1 2.4 |
| 58730.05 | 4645.1 1.4 | 2530 260 | 7.5 0.9 | 4684.5 0.7 | 1330 100 | 6.2 0.6 | 4854.4 0.5 | 1320 70 | 13.8 1.1 |
| 58731.13 | 4641.2 0.9 | 1950 160 | 4.9 0.5 | 4682.2 0.4 | 1320 70 | 5.7 0.4 | 4853.0 0.5 | 1460 50 | 14.2 0.8 |
| 58825.82 | 4854.5 5.2 | 1650 530 | 11.1 6.2 | ||||||
| 59117.10 | 4644.2 1.5 | 2510 292 | 7.5 1.2 | 4688.0 0.7 | 1353.1 110 | 6.9 0.7 | 4852.4 1.3 | 1470 140 | 10.2 1.2 |
| [O III] | He I | H | |||||||
| MJD | [Å] | FWHM [km s-1] | EW [Å] | [Å] | FWHM [km s-1] | EW [Å] | [Å] | FWHM [km s-1] | EW [Å] |
| 51583.73 | 4987.6 2.7 | 1340 230 | 69.7 17 | 6548.2 2.6 | 2290 180 | 180 18 | |||
| 57280.08 | 4992.8 0.5 | 1640 40 | 43.9 2.0 | 5880.2 1.2 | * 2310 210 | * 8.2 1.0 | 6559.7 0.2 | 1830 20 | 163.5 3.5 |
| 57996.19 | 4993.3 0.6 | 1600 50 | 52.4 2.9 | 5864.8 2.3 | * 1820 260 | * 6.8 0.9 | 6559.1 0.2 | 1770 20 | 174.1 2.8 |
| 58011.00 | 4995.8 0.4 | 1470 40 | 63.9 2.2 | 5867.4 2.1 | * 1340 190 | * 5.6 0.9 | 6556.9 0.4 | 1720 40 | 144.7 5.3 |
| 58012.12 | |||||||||
| 58052.99 | 5872.7 2.0 | * 1430 1590 | * 4.3 4.0 | 6559.8 0.3 | 1740 30 | 174.7 4.5 | |||
| 58345.15 | 4992.4 0.5 | 1690 40 | 64.2 2.7 | 5867.8 1.5 | * 1490 150 | * 5.8 0.8 | 6558.9 0.3 | 1900 30 | 196.2 5.5 |
| 58355.22 | 4992.0 0.5 | 1660 50 | 61.8 3.1 | 5857.1 5.1 | * 1530 1220 | * 5.6 2.3 | 6558.5 0.3 | 1910 30 | 192.0 5.4 |
| 58689.20 | 4991.0 0.9 | 1600 70 | 56.9 4.4 | 5862.0 5.4 | 1240 120 | 5.2 0.7 | 6556.3 0.5 | 1870 30 | 166.1 5.9 |
| 58691.20 | 4991.7 1.2 | 1400 120 | 52.1 5.0 | 5856.3 12.3 | * 1230 1050 | * 3.6 2.5 | 6554.4 0.5 | 1870 40 | 166.0 7.0 |
| 58730.05 | 4991.7 0.5 | 1630 40 | 56.0 2.8 | 5868.1 0.8 | * 980 90 | * 3.0 0.6 | 6557.1 0.2 | 1920 20 | 191.6 3.6 |
| 58731.13 | 4990.9 0.4 | 1670 30 | 58.7 2.0 | 5867.3 1.4 | * 1190 140 | * 3.0 0.5 | 6558.5 0.3 | 1850 20 | 179.2 4.0 |
| 58825.82 | 4993.2 3.7 | 1010 470 | 36 20 | 5877.7 1.3 | 940 180 | 5.3 1.3 | 6555.0 4.5 | 2040 190 | 117 22 |
| 59117.10 | 4995.1 0.7 | 1740 50 | 58.6 3.7 | 5879.1 0.5 | 420 70 | 2.3 0.5 | 6563.2 0.8 | 1970 50 | 154.7 8.1 |
Note. With we indicate an epoch in which the line in question could not be fit. For the He I 5876, the values marked with * are the combination of the values measured for the narrow and broad component.
References
- Arcavi et al. (2014) Arcavi, I., Gal-Yam, A., Sullivan, M., et al. 2014, ApJ, 793, 38, doi: 10.1088/0004-637X/793/1/38
- Baldwin et al. (1981) Baldwin, J. A., Phillips, M. M., & Terlevich, R. 1981, PASP, 93, 5, doi: 10.1086/130766
- Bowen (1934) Bowen, I. S. 1934, PASP, 46, 146, doi: 10.1086/124435
- Bowen (1935) —. 1935, ApJ, 81, 1, doi: 10.1086/143613
- Brown et al. (2017) Brown, J. S., Holoien, T. W. S., Auchettl, K., et al. 2017, MNRAS, 466, 4904, doi: 10.1093/mnras/stx033
- Cannizzaro et al. (2020) Cannizzaro, G., Fraser, M., Jonker, P. G., et al. 2020, MNRAS, 493, 477, doi: 10.1093/mnras/staa186
- Chan et al. (2019) Chan, C.-H., Piran, T., Krolik, J. H., & Saban, D. 2019, ApJ, 881, 113, doi: 10.3847/1538-4357/ab2b40
- Dasyra et al. (2006) Dasyra, K. M., Tacconi, L. J., Davies, R. I., et al. 2006, ApJ, 651, 835, doi: 10.1086/507834
- Drake et al. (2009) Drake, A. J., Djorgovski, S. G., Mahabal, A., et al. 2009, ApJ, 696, 870, doi: 10.1088/0004-637X/696/1/870
- Evans & Kochanek (1989) Evans, C. R., & Kochanek, C. S. 1989, ApJ, 346, L13, doi: 10.1086/185567
- Graham et al. (2017) Graham, M. J., Djorgovski, S. G., Drake, A. J., et al. 2017, MNRAS, 470, 4112, doi: 10.1093/mnras/stx1456
- Hills (1975) Hills, J. G. 1975, Nature, 254, 295, doi: 10.1038/254295a0
- Holoien et al. (2014) Holoien, T. W.-S., Prieto, J. L., Bersier, D., et al. 2014, MNRAS, 445, 3263, doi: 10.1093/mnras/stu1922
- Jonker et al. (2020) Jonker, P. G., Stone, N. C., Generozov, A., van Velzen, S., & Metzger, B. 2020, ApJ, 889, 166, doi: 10.3847/1538-4357/ab659c
- Kesden (2012) Kesden, M. 2012, Phys. Rev. D, 85, 024037, doi: 10.1103/PhysRevD.85.024037
- Lin et al. (2017) Lin, D., Guillochon, J., Komossa, S., et al. 2017, Nature Astronomy, 1, 0033, doi: 10.1038/s41550-016-0033
- Mattila et al. (2018) Mattila, S., Pérez-Torres, M., Efstathiou, A., et al. 2018, Science, 361, 482, doi: 10.1126/science.aao4669
- Merloni et al. (2015) Merloni, A., Dwelly, T., Salvato, M., et al. 2015, MNRAS, 452, 69, doi: 10.1093/mnras/stv1095
- Newville et al. (2014) Newville, M., Stensitzki, T., Allen, D. B., & Ingargiola, A. 2014, LMFIT: Non-Linear Least-Square Minimization and Curve-Fitting for Python, doi: 10.5281/zenodo.11813
- Nicholl et al. (2020) Nicholl, M., Wevers, T., Oates, S. R., et al. 2020, arXiv e-prints, arXiv:2006.02454. https://arxiv.org/abs/2006.02454
- Onori et al. (2019) Onori, F., Cannizzaro, G., Jonker, P. G., et al. 2019, MNRAS, 489, 1463, doi: 10.1093/mnras/stz2053
- Peterson (2006) Peterson, B. 2006, The Broad-Line Region in Active Galactic Nuclei (Berlin, Heidelberg: Springer Berlin Heidelberg), 77–100, doi: 10.1007/3-540-34621-X_3
- Peterson et al. (2004) Peterson, B. M., Ferrarese, L., Gilbert, K. M., et al. 2004, ApJ, 613, 682, doi: 10.1086/423269
- Prieto et al. (2016) Prieto, J. L., Krühler, T., Anderson, J. P., et al. 2016, ApJ, 830, L32, doi: 10.3847/2041-8205/830/2/L32
- Rees (1988) Rees, M. J. 1988, Nature, 333, 523, doi: 10.1038/333523a0
- Rodríguez Zaurín et al. (2013) Rodríguez Zaurín, J., Tadhunter, C. N., Rose, M., & Holt, J. 2013, MNRAS, 432, 138, doi: 10.1093/mnras/stt423
- Roth & Kasen (2018) Roth, N., & Kasen, D. 2018, ApJ, 855, 54, doi: 10.3847/1538-4357/aaaec6
- Rupke et al. (2005) Rupke, D. S., Veilleux, S., & Sanders, D. B. 2005, ApJ, 632, 751, doi: 10.1086/444451
- Tadhunter et al. (2017) Tadhunter, C., Spence, R., Rose, M., Mullaney, J., & Crowther, P. 2017, Nature Astronomy, 1, 0061, doi: 10.1038/s41550-017-0061
- Tody (1986) Tody, D. 1986, in Proc. SPIE, Vol. 627, Instrumentation in astronomy VI, ed. D. L. Crawford, 733, doi: 10.1117/12.968154
- Trakhtenbrot et al. (2019) Trakhtenbrot, B., Arcavi, I., Ricci, C., et al. 2019, Nature Astronomy, 3, 242, doi: 10.1038/s41550-018-0661-3
- van Dokkum (2001) van Dokkum, P. G. 2001, PASP, 113, 1420, doi: 10.1086/323894
- van Velzen et al. (2020) van Velzen, S., Holoien, T. W. S., Onori, F., Hung, T., & Arcavi, I. 2020, Space Sci. Rev., 216, 124, doi: 10.1007/s11214-020-00753-z