The Parallax Zero-Point of Gaia Early Data Release 3 from LAMOST Primary Red Clump Stars
Abstract
We present an independent examination of the parallax zero-point of the Third Gaia Early Data Release (hereafter EDR3), using the LAMOST primary red clump (PRC) stellar sample. A median parallax offset of around as, slightly larger than that found by examination of distant quasars, is found for both the five- and six-parameter solutions in EDR3, based on samples of over 63,000 and 2000 PRC stars, respectively. Similar to the previous investigation of Lindegren et al., to which we compare our results, the parallax zero-point exhibits clear dependencies on the magnitudes, colors, and positions of the objects. Based on our analysis, the zero-point of the revised parallax can be reduced to a few as, and some significant patterns, e.g., discontinuities with stellar magnitude, can be properly removed. However, relatively large offsets (as) are still found for the revised parallaxes over different positions on the sky.
1. Introduction
Based on observations from the first 34 months (from July 2014 to May 2017) from the European Space Agency’s Gaia mission (Gaia Collaboration et al. 2016), the Gaia Early Data Release 3 (EDR3; Gaia Collaboration et al. 2020a) just released astrometric and photometric data for over 1.8 billion sources. Of importance here, five astrometric parameters (position, parallax, and proper motions) are measured for over 81% of these sources (1.468 billion) in EDR3 (Lindegren et al. 2020a). These precisions are improved by 30% for parallaxes, and by a factor of two for proper motions, respectively, when compared to those in Gaia DR2 (Gaia Collaboration et al. 2018).
Investigation of the systematic bias of the measured parallax in EDR3 is very important for its further applications, especially for estimating distances to the more distant stars. The Gaia team has constructed a parallax zero-point model, depending on the -band magnitude, spectral shape (colors), and ecliptic latitude of the sources (Lindegren et al. 2020b). This model is derived based on a comprehensive analysis of quasars, binary stars, and stellar sources in the Large Magellanic Cloud (LMC). Evaluation of the parallax-bias dependencies for the three independent variables are different for sources with five- and six-parameter solutions111The descriptions of the five- and six-parameter solutions are given by Lindegren et al. (2020b). Briefly, a five-parameter solution is determined if the target has an accurate value of effective wavenumber () to select proper point-spread function (PSF) or line-spread function (LSF) in the data processing pipeline. For six-parameter solution, PSF or LSF at a default m-1 is adopted due to no accurate value of of the concerned source.. For faint sources, the parallax bias is estimated directly by a large number of quasars covering almost the entire sky (except for the Galactic disk region). However, for brighter sources and also sources with wider color ranges, the parallax bias is derived by an indirect way, based on physical binary stars and stars in the LMC.
In this letter, we perform an independent check on the parallax bias of EDR3 by using over 65,000 primary red clump (PRC) stars (Huang et al. 2020), identified from the LAMOST Galactic surveys (Deng et al. 2012; Liu et al. 2014). This provides an important test of the derived zero-points that need to be used for correction of the EDR3 stellar parallaxes and their application to problems of contemporary interest. This paper is structured as follows. We introduce the data employed in Section 2, and the main results are presented and discussed in Section 3. Finally, Section 4 presents a summary of our results.
2. Data
The current work adopts the PRC sample built by Huang et al. (2020; hereafter H20). With the information provided by high-quality Kepler asteroseismology data, the PRC stars were selected based on their positions in the metallicity-dependent effective temperature-surface gravity and color-metallicity diagrams (See Fig. 1 of H20). In total, nearly 140,000 PRC stars with spectral signal-to-noise ratios (SNR) higher than 20 were identified from the LAMOST Galactic surveys. In addition, stellar masses and ages are derived for those PRC stars using the kernel principal-component method. Unlike assuming a constant absolute magnitude for PRC stars, as in previous work, H20 performed a new calibration of the absolute magnitude for PRC stars, for the first time, by considering both the metallicity and age dependencies, using over 10,000 PRC stars with accurate distance estimates from Schönrich, McMillan & Eyer (2019; hereafter SME19). By application of the statistical method developed by Schönrich, Binney & Asplund (2012; hereafter SBA12), SME19 find an average parallax offset of as for Gaia DR2. They then present accurate Bayesian distance estimates (from the parallax measurements with offset properly corrected) for the full Gaia DR2 RVS sample stars (Katz et al. 2018). The distances for 10,000 PRC stars are taken from the RVS sample further by applying quality cuts as suggested by SME19 (see their Section 8). The distances derived in this manner are accurate to a few per cent, as confirmed by their statistical method (SBA12). Moreover, the distances of the PRC stars from this new calibration are also validated by the statistical method of SBA12 in H20. The test indicates that the distances (from the new calibration) are very accurately determined (to better than a few per cent) for all concerned populations with distances larger than 0.85 kpc (see Figs. 13 and A1 of H20).
The LAMOST PRC sample is then matched with Gaia EDR3, and the following cuts are made to control the data quality:
-
1)
LAMOST spectral SNR , distance larger than 0.85 kpc, stellar age Gyr, and 2MASS uncertainty smaller than 0.03 mag;
-
2)
The Renormalised Unit Weight Error (RUWE) ;
-
3)
An effective wavenumber for the five-parameter solution or pseudocolor for the six-parameter solution.
The RUWE is an statistical indicator of the quality of the Gaia data, given by the re-normalised square root of the reduced chi-square of the Gaia astrometric solution. The definitions of effective wavenumber and pseudocolor are described in Lindegren et al. (2020a). Generally, they represent the color information of the observed targets. The above cuts yield 63,138 and 2074 PRC stars with five- and six-parameter solutions in Gaia EDR3, respectively. If not specified otherwise, , , and represent the parallaxes given by the distances of PRC stars in H20 (), the parallaxes in EDR3, and the parallaxes in EDR3 with zero-point corrections from the code provided by Lindegren et al. (2020b), respectively.
3. Results and Discussion
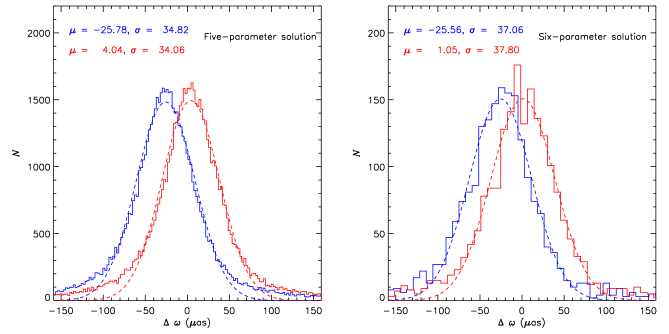
The comparison between and for the five- and six-parameter solutions are shown in Fig. 1. The median offsets are all around as, slightly larger than the value found from distant quasars (Lindegren et al. 2020b). The parallaxes of EDR3 with zero-point corrections using the model of Lindegren et al. (2020b) are also checked, and the results are shown in Fig. 1. The median values of the parallax difference between and are only 4.0 and 1.1 as for the five- and six-parameter solutions, respectively. These results confirm that the official parallax zero-point correction model can generally remove the global bias of EDR3 parallaxes.
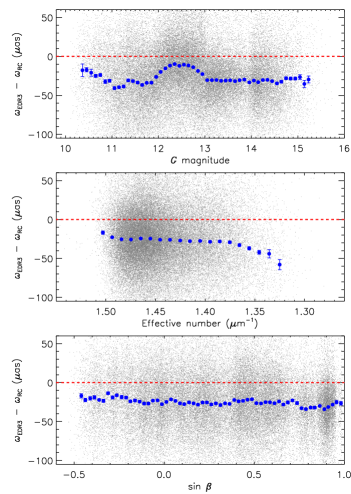
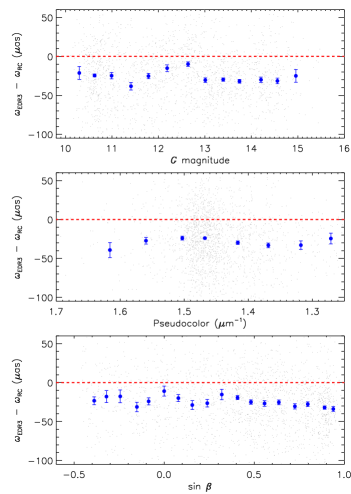
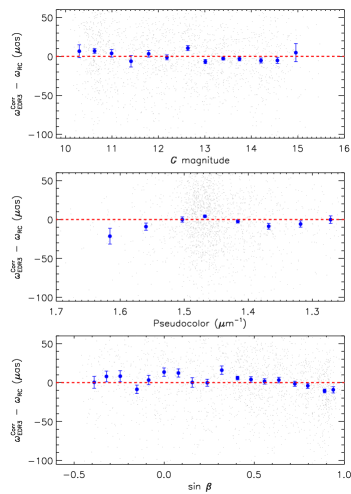
To further test the main dependencies of the parallax bias in EDR3, Figs. 2 and 3 show the parallax difference between and , as a function of , effective wavenumber/pseudocolor, and (where represents the ecliptic latitude) for the five- and six-parameter solutions, respectively. Thanks to the large number of PRC stars in the five-parameter solution in EDR3, the parallax-bias dependencies could be mapped in detail. As shown in Fig. 2, significant patterns are found for the EDR3 parallaxes as a function of magnitude. The discontinuous “jump-like” features found for and ranges are similar to those reported in Fabricius et al. (2020) and Lindegren et al. (2020b). This check also shows a positive trend for parallax bias with effective wavenumber, especially at the red end ( m), as also reported in Fabricius et al. (2020) and Lindegren et al. (2020b). For ecliptic latitude, no significant trend is found, except a clear dip feature around . For parallaxes derived from the six-parameter solution, the number of PRC stars is very limited, and most of the fine structures as a function of magnitude, pseudocolor, and cannot be mapped with high accuracy. We only note that the jump-like features in the parallax bias with magnitude can still be (marginally) seen.
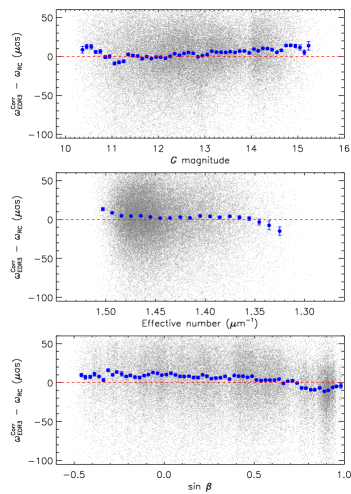
The dependencies of the corrected EDR3 parallax bias are also checked; the results shown in Figs. 2 and 3 for the five- and six-parameter solutions, respectively. From inspection of Fig. 2, the parallax biases (from the five-parameter solution), as a function of and effective wavenumber, are considerably reduced by the official zero-point correction model (Lindegren et al. 2020b). Most recently, the independent work by Zinn et al. (2021) has found similar results by using 2000 first-ascent red giant branch stars with asteroseismic parallaxes in the Kepler field. Here, we note that the offset of the parallax difference for and are as and as, respectively. This implies that the corrected Gaia parallax may over-correct the zero-point at and . The over-estimated value of the parallax zero-point by the official Gaia model for found here is similar to the values of as given by Riess et al. (2020) and as reported by Zinn et al. (2021). For ecliptic latitude, the dip feature around is still present. For the six-parameter solution shown in Fig. 3, the pattern of the parallax zero-point discontinuities with magnitude is largely removed.
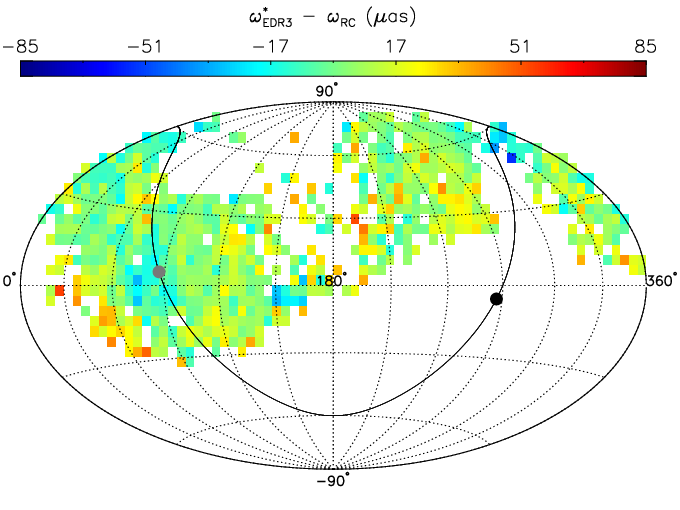
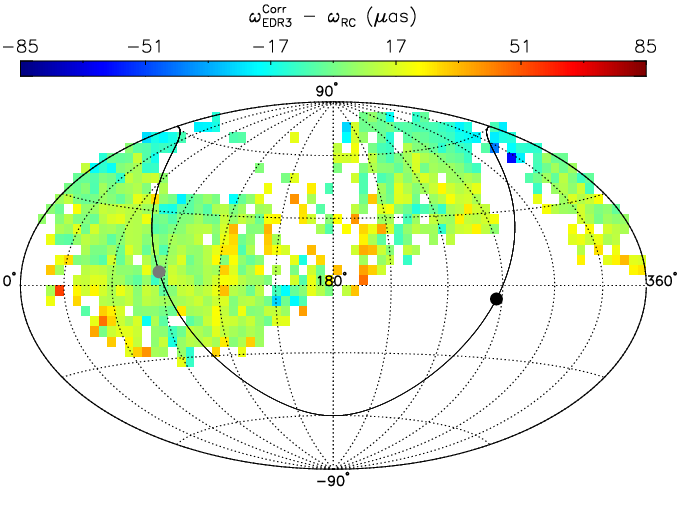
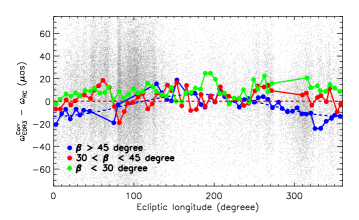
In the official parallax zero-point correction model (Lindegren et al. 2020b), the position-dependent bias of EDR3 parallax for bright stars is not well-explored. Here, Fig. 4 shows the 2D position-dependent bias of EDR3 parallaxes (from the five-parameter solution) in ecliptic coordinates. Significant variations (as) over the sky region covered by our PRC sample are clearly seen. To obtain an estimate of the systematic zero-point dependence on positions, the parallax difference between and , as a function of ecliptic longitude , is shown in Fig. 5. For stars with ecliptic latitude , the median differences for individual bins exhibit a clear trend, well-described by a one-term Fourier model function (listed in the figure caption). For stars with , the median differences as function of oscillate around zero with no significant trend. For stars with , the median differences as a function of oscillate around a positive global offset of as, again without any systematic trend. Given the similar sky coverage between the LAMOST observations and our PRC sample, we recommend correcting for the position-dependent bias of the EDR3 parallax found here when deriving distances from EDR3 parallaxes for LAMOST stars, and other samples covering similar regions of sky.
4. Summary
In this letter, both the EDR3 parallaxes and the revised EDR parallaxes obtained by the official zero-point correction model are checked independently by a sample of LAMOST PRC stars, which are believed to be good standard candles with distance accuracy better than 5 per cent. With over 65,000 PRC stars, the global median offset of EDR3 parallax is found to be around as for both the five- and six-parameter solutions. The parallax bias in EDR3 exhibits significant systematic trends with magnitudes, spectral shape (color), and positions. The global offset and the main bias dependencies can be largely reduced by application of the official zero-point correction model. However, the remaining biases in positions still remain, with variation amplitudes larger than 10 as.
Acknowledgements
We would like to thank the referee for his/her helpful comments. It is a pleasure to thank Prof. Xiaowei Liu for a thorough read of the manuscript and helpful comments. We gratefully thank Joel C. Zinn for helpful discussions. This work is supported by National Key R&D Program of China No. 2019YFA0405500 and National Natural Science Foundation of China grants 11903027, 11833006, 11973001, 11603002, 11811530289 and U1731108. Y. H. is supported by the Yunnan University grant C176220100006. We used data from the European Space Agency mission Gaia (http://www.cosmos.esa.int/gaia), processed by the Gaia Data Processing and Analysis Consortium (DPAC; see http://www.cosmos.esa.int/web/gaia/dpac/consortium). T.C.B. acknowledges partial support from grant PHY 14-30152, Physics Frontier Center/JINA Center for the Evolution of the Elements (JINA-CEE), awarded by the US National Science Foundation. His participation in this work was initiated by conversations that took place during a visit to China in 2019, supported by a PIFI Distinguished Scientist award from the Chinese Academy of Science.
The Guoshoujing Telescope (the Large Sky Area Multi-Object Fiber Spectroscopic Telescope, LAMOST) is a National Major Scientific Project built by the Chinese Academy of Sciences. Funding for the project has been provided by the National Development and Reform Commission. LAMOST is operated and managed by the National Astronomical Observatories, Chinese Academy of Sciences.
References
- Deng et al. (2012) Deng, L.-C., Newberg, H. J., Liu, C., et al. 2012, Research in Astronomy and Astrophysics, 12, 735
- Fabricius et al. (2020) Fabricius, C., Luri, X., Arenou, F., et al. 2020, arXiv:2012.06242
- Gaia Collaboration et al. (2016) Gaia Collaboration, Prusti, T., de Bruijne, J. H. J., et al. 2016, A&A, 595, A1
- Gaia Collaboration et al. (2018) Gaia Collaboration, Brown, A. G. A., Vallenari, A., et al. 2018, A&A, 616, A1
- Gaia Collaboration et al. (2020) Gaia Collaboration, Brown, A. G. A., Vallenari, A., et al. 2020, arXiv:2012.01533
- Huang et al. (2020) Huang, Y., Schönrich, R., Zhang, H., et al. 2020, ApJS, 249, 29
- Katz et al. (2019) Katz, D., Sartoretti, P., Cropper, M., et al. 2019, A&A, 622, A205
- Lindegren et al. (2018) Lindegren, L., Hernández, J., Bombrun, A., et al. 2018, A&A, 616, A2
- Lindegren et al. (2020) Lindegren, L., Klioner, S. A., Hernández, J., et al. 2020a, arXiv:2012.03380
- Lindegren et al. (2020) Lindegren, L., Bastian, U., Biermann, M., et al. 2020b, arXiv:2012.01742
- Liu et al. (2014) Liu X. -W., et al., 2014, in Feltzing S., Zhao G., Walton N., Whitelock P., eds, Proc. IAU Symp. 298, Setting the scene for Gaia and LAMOST, Cambridge University Press, pp. 310-321, preprint (arXiv: 1306.5376)
- Riess et al. (2020) Riess, A. G., Casertano, S., Yuan, W., et al. 2020, arXiv:2012.08534
- Schönrich et al. (2012) Schönrich, R., Binney, J., & Asplund, M. 2012, MNRAS, 420, 1281
- Schönrich et al. (2019) Schönrich, R., McMillan, P., & Eyer, L. 2019, MNRAS, 487, 3568
- Zinn (2021) Zinn, J. C. 2021, arXiv:2101.07252