11email: james.mason@lasp.colorado.edu 22institutetext: NOAA/National Centers for Environmental Information, 325 Broadway, Boulder, CO, USA
33institutetext: High Altitude Observatory, National Center for Atmospheric Research, P.O. Box 3000, Boulder, CO, USA
44institutetext: Naval Research Laboratory, Washington, DC, USA
55institutetext: Colorado Research Associates Division, NorthWest Research Associates, 3380 Mitchell Lane, Boulder, CO, USA
66institutetext: NASA Goddard Space Flight Center, 8800 Greenbelt Road, Greenbelt, MD, USA
77institutetext: Institute of Physics & Kanzelhöhe Observatory for Solar and Environmental Research, University of Graz, A-8010 Graz, Austria
88institutetext: Royal Observatory of Belgium, Avenue Circulaire 3, 1180 Uccle, Belgium
99institutetext: Reflective X-ray Optics LLC, New York, NY, USA
SunCET: The Sun Coronal Ejection Tracker Concept
Abstract
The Sun Coronal Ejection Tracker (SunCET) is an extreme ultraviolet imager and spectrograph instrument concept for tracking coronal mass ejections through the region where they experience the majority of their acceleration: the difficult-to-observe middle corona. It contains a wide field of view (0–4 ) imager and a 1 Å spectral-resolution-irradiance spectrograph spanning 170–340 Å. It leverages new detector technology to read out different areas of the detector with different integration times, resulting in what we call “simultaneous high dynamic range”, as opposed to the traditional high dynamic range camera technique of subsequent full-frame images that are then combined in post-processing. This allows us to image the bright solar disk with short integration time, the middle corona with a long integration time, and the spectra with their own, independent integration time. Thus, SunCET does not require the use of an opaque or filtered occulter. SunCET is also compact — 15 15 10 cm in volume — making it an ideal instrument for a CubeSat or a small, complementary addition to a larger mission. Indeed, SunCET is presently in a NASA-funded, competitive Phase A as a CubeSat and has also been proposed to NASA as an instrument onboard a 184 kg Mission of Opportunity.
keywords:
EUV instrument – Coronal Mass Ejections – high dynamic range – CubeSat1 Introduction and Science Drivers
The primary science question that the Sun Coronal Ejection Tracker (SunCET) instrument concept is designed to address is: What are the dominant physical mechanisms for coronal mass ejection acceleration as a function of altitude and time?
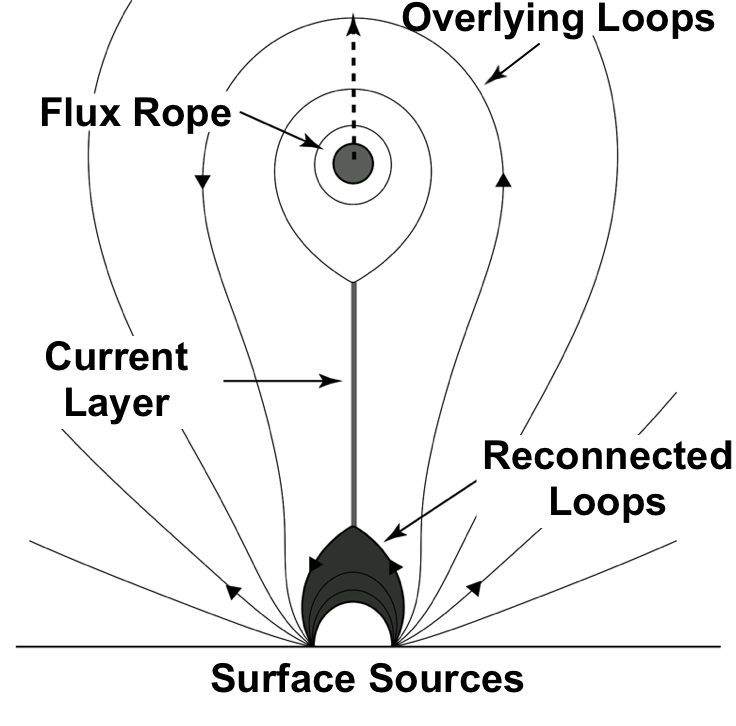
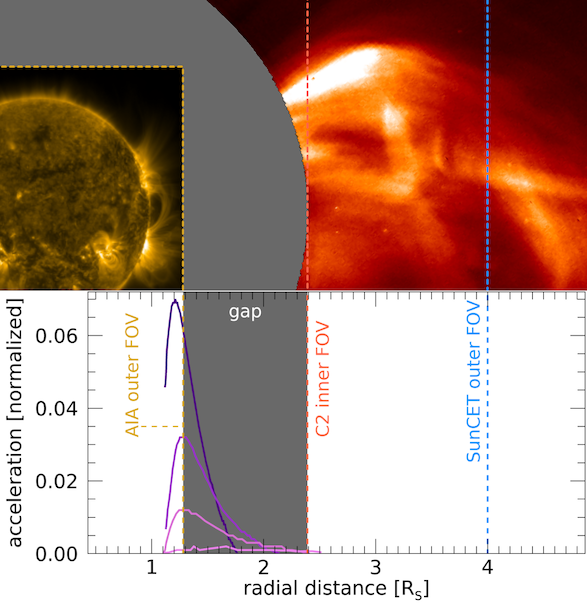
In the standard model configuration of a coronal mass ejection (CME; Figure 1), a CME must overcome the constraint of overlying field in order to escape. Perhaps the simplest model of this defines a 1D, horizontal background magnetic field that declines in strength with height, characterized by the “decay index” (Bateman, 1978; Kliem and Török, 2006). If the background field decays too rapidly, the so-called torus instability of the embedded flux rope occurs, meaning the flux rope erupts. The decay index has a direct impact on the CME kinematics. The acceleration curves in the bottom of Figure 2, derived from magnetohydrodynamic (MHD) simulations by Török and Kliem (2007), correspond to decay index profiles, with each increase in acceleration corresponding to an increase in in the decay index profile and the final CME speed. Thus, the acceleration profile of a CME acts as a natural probe of the surrounding magnetic field. There are many complications layered on top of this simple model in reality, described later in this introduction.
The bulk of the CME acceleration profile in all cases occurs either in the observational gap or in the region where existing instruments are not optimized. This gap exists between extreme ultraviolet (EUV) imagers (widest outer field of view [FOV] of 1.7 ) and coronagraphs (typical inner FOV of 2.5 but effectively higher due to diffraction-degraded spatial resolution). Some instruments observe only part of the low-middle corona (Solar TErrestrial RElations Observatory [STEREO; Kaiser et al. 2007] / Coronagraph-1 [COR1; Howard et al. 2008], Geostationary Operational Environmental Satellite [GOES] / Solar Ultraviolet Imager [SUVI; Martínez-Galarce et al. 2010] , Project for On-Board Autonomy [PROBA2] / Sun Watcher with Active Pixels and Image Processing [SWAP; Seaton et al. 2013]). Some have low signal to noise in the middle corona (SUVI, SWAP). Some are ground-based with duty cycles % (K-Cor). Some have limitations on cadence (COR1). SunCET, however, avoids all of these issues because it is specifically optimized for this study of CMEs. Directly observing the CME height-time profile through the whole low and middle corona allows the derivation of complete speed-time and acceleration-time profiles, and thus strong model constraints, requiring accurate modeling of the magnetic environment to obtain the observed profiles. Such constraints do not presently exist, but SunCET can provide them.
The torus instability is not the only mechanism involved in CME eruptions. Complicating factors are introduced by, e.g., the 3D structure of the erupting material and the surrounding magnetic field, by potential drainage of dense plasma, and by continued magnetic reconnection freeing more energy to drive the CME. The influence of these factors also evolve with altitude and time, as the CME dynamics play out. There have been at least 26 review papers on the topic over the last two decades (Green et al. 2018, and references therein) — a testament to the sustained, intense interest in this topic.
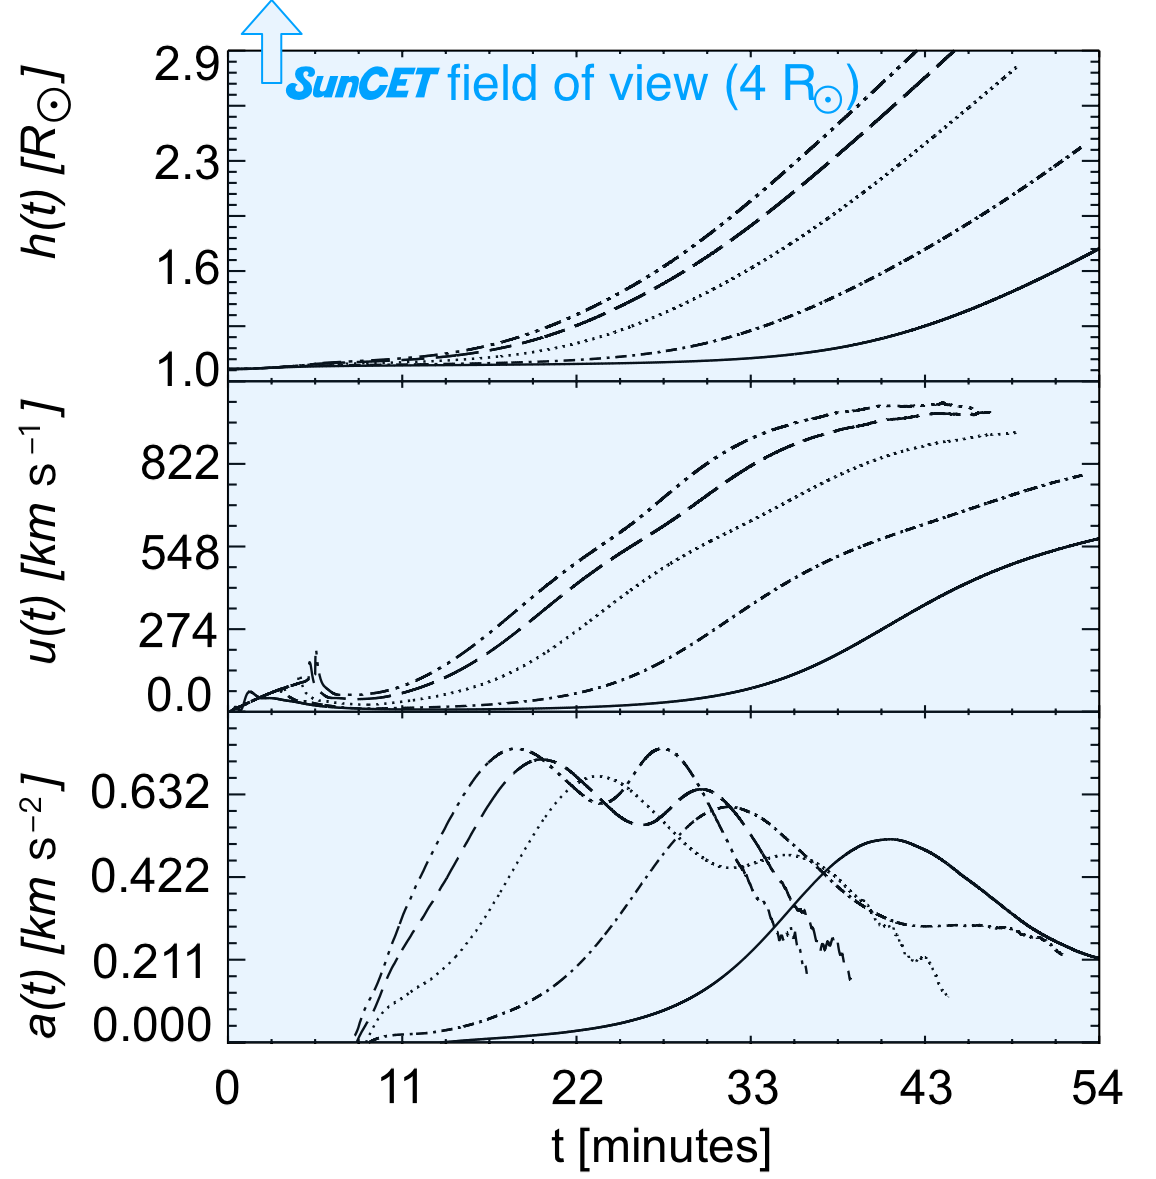
For example, a relatively modest complication to layer into the torus instability model is to add an upward velocity perturbation with finite duration. MHD simulations by Schrijver et al. (2008) showed that simply changing the duration of this perturbation results in fundamentally different acceleration profiles (Figure 3). With brief perturbations, the profile is single-peaked and occurs at later times. Increasing the duration of the perturbation does not simply result in an earlier peak, but in two peaks. Just as in Figure 2, the heights that these acceleration profiles differentiate themselves occurs across the Heliophysics System Observatory (HSO) measurement gap. SunCET observations can discriminate between single-peak versus double-peak CME acceleration profiles, which then determines the duration of a velocity perturbation in the torus instability model.
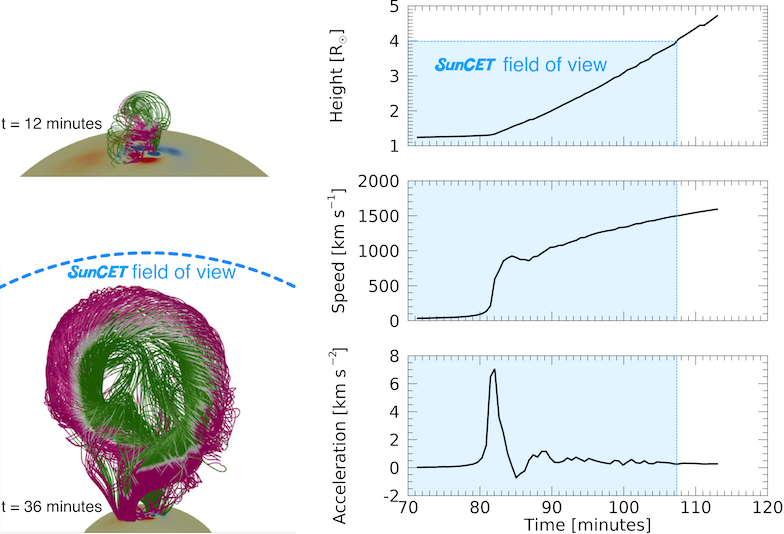
Another CME initiation mechanism arises from the magnetic field topology of the flux rope. Hood and Priest (1981) showed that if the total twist in a flux rope exceeds a critical threshold (448°), a “helical kink” instability will occur, causing the flux rope to erupt. Such contortions lead to an impulsive acceleration and a large rotation of the flux rope (Fan 2016, Figure 4). Note the substantial differences in the simulated acceleration profiles between Figures 2, 3, and 4; and that they all occur in the under observed region.
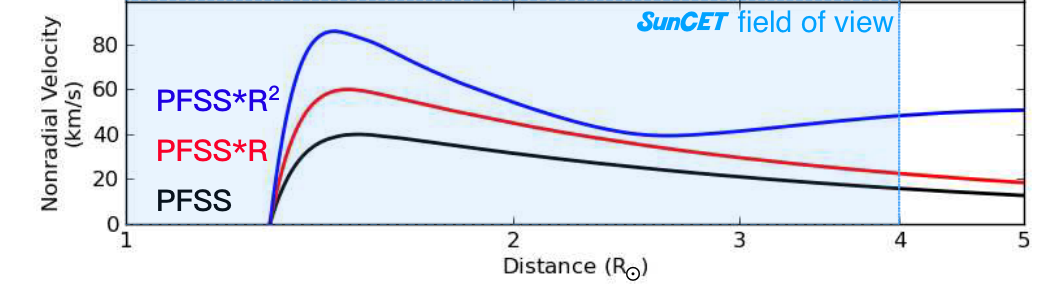
The other aspect of acceleration is direction: CMEs can be deflected away from “pure” radial propagation by as much as 30, which is again determined primarily by Bex (Figure 5). This force has a non-radial component because the field is not perfectly symmetric about the flux rope, causing a magnetic gradient on the CME’s sides as the loops drape around the rising CME. The Forecasting a Coronal Mass Ejection’s Altered Trajectory (ForeCAT) analytical model accounts for these and other forces on a CME to determine its non-radial velocity (Kay et al., 2013, 2015, 2016; Kay and Gopalswamy, 2018). Furthermore, Kay and Opher (2015) modeled 200 CMEs in ForeCAT and found that deflection occurring in the middle corona accounts for nearly all of the deflection that occurs between initiation and 1 AU. The background magnetic field and radial CME speed are two free parameters in ForeCAT that are critical to get right; SunCET observations can strictly constrain them via forward modeling.
Additionally, coronal dimming often occurs as a result of CMEs. The faster a CME departs, the steeper the decline in coronal emission. The more mass the CME takes with it, the deeper the drop in coronal emission. A large number of studies have demonstrated this link with coronal imagers (e.g., Aschwanden 2009; Aschwanden et al. 2009; Dissauer et al. 2018, 2019; Thompson et al. 2000) and with spectral irradiance data (Woods et al., 2011; Mason et al., 2014, 2016, 2019). A major advantage of dimming measurements is that they are effective measures of CME kinematics even when they occur at disk center. Coronagraphs and imagers suffer from the problem of determining halo CME speed and/or mass. Dimming is an effective measure of CME kinematics both on and off-disk (Dissauer et al., 2019; Chikunova et al., 2020). Thus, instrument suites that can capture both the dimming and direct observations of limb CMEs are ideal for CME observation. This is precisely what SunCET does.
SunCET will be the first mission that allows continuous measurements of CMEs during their initial acceleration phase using only a single instrument. This is advantageous compared to currently used instruments, where, e.g. EUV imagers in the low corona are combined with white-light coronagraphs higher up to track this phase. Artifacts can be introduced in the resulting CME kinematics using this combined data due to the tracking of different structures in the different instruments, since the observed emission is generated by different physical processes. SunCET is not dependent on other instruments to observe CME initiation and acceleration but does have a sufficiently wide field of view to overlap with coronagraphs for further expanded studies. The same challenges with different CME structures in EUV versus white light will be present, but SunCET’s broader temperature response should mitigate this somewhat.
2 Instrument Design
SunCET is an instrument with a Ritchey-Chrétien, wide-field-of-view telescope (4 ), an off-rowland-circle EUV spectrograph, and a novel, simultaneous-high-dynamic-range detector. This new detector technology allows us to image the bright solar disk and CMEs through the dim middle corona simultaneously. It also allows us to measure solar irradiance spectra on the unused portion of the same detector with an integration time independent of the telescope image. The entire design is compact, fitting in a 15 15 10 cm volume; or about 2.5 CubeSat Units. This makes it ideal as a CubeSat or as a compact instrument suite to include on larger spacecraft that requires few physical resources.
SunCET observes in the EUV rather than white light because 1) CMEs have already been demonstrated to be visible in the EUV and 2) it allows for major simplifications in the technical design of the instrument. While white-light observations are independent of temperature since they rely on light Thomson scattered from free electrons, SunCET observations do have the caveat that their temperature dependence (emission from ions at particular temperatures) means that CMEs whose plasma is not at ambient coronal temperatures will not be visible. The dynamic range between on and off disk in the EUV is already large (105 by 2 ) but this is orders of magnitude larger in white light (108), increasing the technical challenge. Moreover, the absolute brightness are vastly different; there are far more visible light photons. This presents a major challenge with scattered light: even small imperfections in optics would result in enough of the numerous disk photons to land on the part of the detector with the exceptionally faint middle corona, swamping out CME observations. This is further exacerbated by the fact that most surfaces scatter light more efficiently in visible light than in EUV light. Therefore, SunCET observes CMEs in the EUV.
3 Imager Design
The SunCET imager was designed to provide high-dyamic range with moderate spatial resolution while providing a large field-of-view not heard of in historical on-disk EUV imagers out to 4 . This section describes the technical design details that were traded in order to close on the science question.
3.1 Dynamic Range
The SunCET imager requires a dynamic range of at least , based on GOES-16/SUVI observations of CMEs and SunCET’s design optimizations. The dimmest target of interest is a CME at the outer FOV, and the brightest is the coronal loops of an active region associated with a CME.
SUVI-observed radiances are used to estimate brightness in SunCET (see Section 3.7). At 3.5 , CMEs are W/m2/sr. A few of the brightest pixels in active regions reach 70 W/m2/sr, but are typically 4.8 W/m2/sr in SunCET. Another factor of 10 is included to distinguish the loops from the background solar disk. Thus, we have a required dynamic range of (4.8 / ) 10 = . We allow solar flares and a small number of the brightest pixels inside active regions to saturate because 1) they are not our target of interest, 2) our entrance filter mesh mitigates diffraction (Section 3.4), and 3) the blooming in our detector is modest: only a few percent ranging across a few pixels (verified during the 33.336 NASA sounding rocket flight and in the lab).
Projected performance: CME brightness at the outer SunCET FOV of 4 is W/m2/sr. That implies a dynamic range of . From 0–1.05 , we run exposures of 0.025 seconds and from 1.05–4 the exposures will be 10 seconds — a factor of 400 dynamic range. Our detector has a native dynamic range of . 22 pixel binning provides an additional factor of 4. Combining these, we obtain SunCET’s high dynamic range of , well above the required range of . For comparison, the SDO/AIA dynamic range is (Lemen et al., 2012).
3.2 Field of View
Most CMEs accelerate through the low and middle corona (Bein et al., 2011; D’Huys et al., 2014). We set our required minimum field of view (FOV) at 0.5 , corresponding to 30 from disk-center. Lower than this and the events tend to be halo CMEs, which are difficult to obtain height-time profiles from. The outer FOV requirement is set to 3.5 . SunCET covers the gap between existing instruments and includes enough overlap to ensure a smooth transition in any complementary height-time profiles. SOHO/LASCO’s inner FOV is 2.4 and its upcoming replacement, NOAA’s GOES-U/CCOR and SWFO/CCOR, will have an inner FOV of 3 .
The aforementioned traditional CME measurements, which are from white-light coronagraphs, use occulters that are mechanically restricted to be a limited distance away; therefore these observations have significantly degraded spatial resolution in their inner FOV that is much worse than their stated plate-scale resolution, sometimes upwards of 1 arc-min in the inner FOV. These effects are primarily due to vignetting (e.g. Koutchmy 1988; Aime et al. 2019). This is not the case with SunCET as it does not require an occulter to observe the CMEs in the low- and middle-corona, so its spatial resolution is not diffraction limited and is superior even in the FOV region that overlaps with the coronagraphs.
Projected performance: The FOV of SunCET is 0–4 (5.6 in image corners).
3.3 Temporal Resolution: Exposure and Cadence
SunCET is required to observe CMEs with speeds up to at least 1000 km/s, which accounts for 98% of all CMEs (Gopalswamy et al., 2009; Barlyaeva et al., 2018). Given the cadence described below and the field of view, SunCET’s projected performance is to observe CMEs with speeds up to 3900 km/s. The fastest CME in the CDAW catalog is 3400 km/s, meaning that SunCET will be able to track CMEs with any previously observed speed.
SunCET requires an exposure time 23 seconds in order to avoid motion blur of the CME. Combining the fastest required CME to observe (1000 km/s), our required spatial resolution of 30\arcsec/resolution-element, and the conversion of angular to spatial resolution at 1 AU (750 km/arcsec), we obtain 750 30 / 1000 23 seconds/resolution-element. Projected performance - exposure: SunCET’s exposure times are 0.025 seconds from 0–1.05 and 10 seconds beyond that.
SunCET requires a cadence 3.2 minutes. SunCET must be able to track a 1000 km/s CME from the solar limb through its FOV, a range of 2.5 , or km. Therefore, the minimum time a CME would be in the FOV is 29 minutes. We require at least 9 height-time samples to distinguish acceleration profiles (Figure 3). Thus, our cadence must be less than 29 minutes / 9 samples = 3.2 minutes.
Projected performance - cadence: The SunCET mission is designed to downlink 1 minute cadence data. The designed FOV actually extends to 4 , meaning we will capture 38 height-time points for limb-CMEs traveling at a speed of 1000 km/s and more points for CMEs that start slightly on disk and/or with slower speeds. For example, the average CME speed is 490 km/s (Webb and Howard, 2012) and if it crosses from 0.7–4 , we will obtain 78 height-time points.
3.4 Bandpass: Coatings and Filters
| \rowcolor[HTML]1A73C9 Ion | [Å] | log10(T [K]) | Quiet Sun Irradiance [W/m2/Å] | ||
|---|---|---|---|---|---|
| Fe IX | 171.1 | 5.9 | 67 | ||
| Fe X | 174.5 | 6.1 | 73 | ||
| Fe X | 177.2 | 6.1 | 48 | ||
| Fe XI | 180.4 | 6.2 | 77 | ||
|
188.2 | 6.2 | 61 | ||
| Fe XII | 193.5 | 6.2 | 45 | ||
| Fe XII | 195.1 | 6.2 | 63 |
CMEs have been routinely identified in narrowband EUV imagers sensitive to temperatures between 0.6–1.6 MK (e.g., GOES/SUVI). Therefore, SunCET is required to observe at least one of the emission lines identified in Table 1.
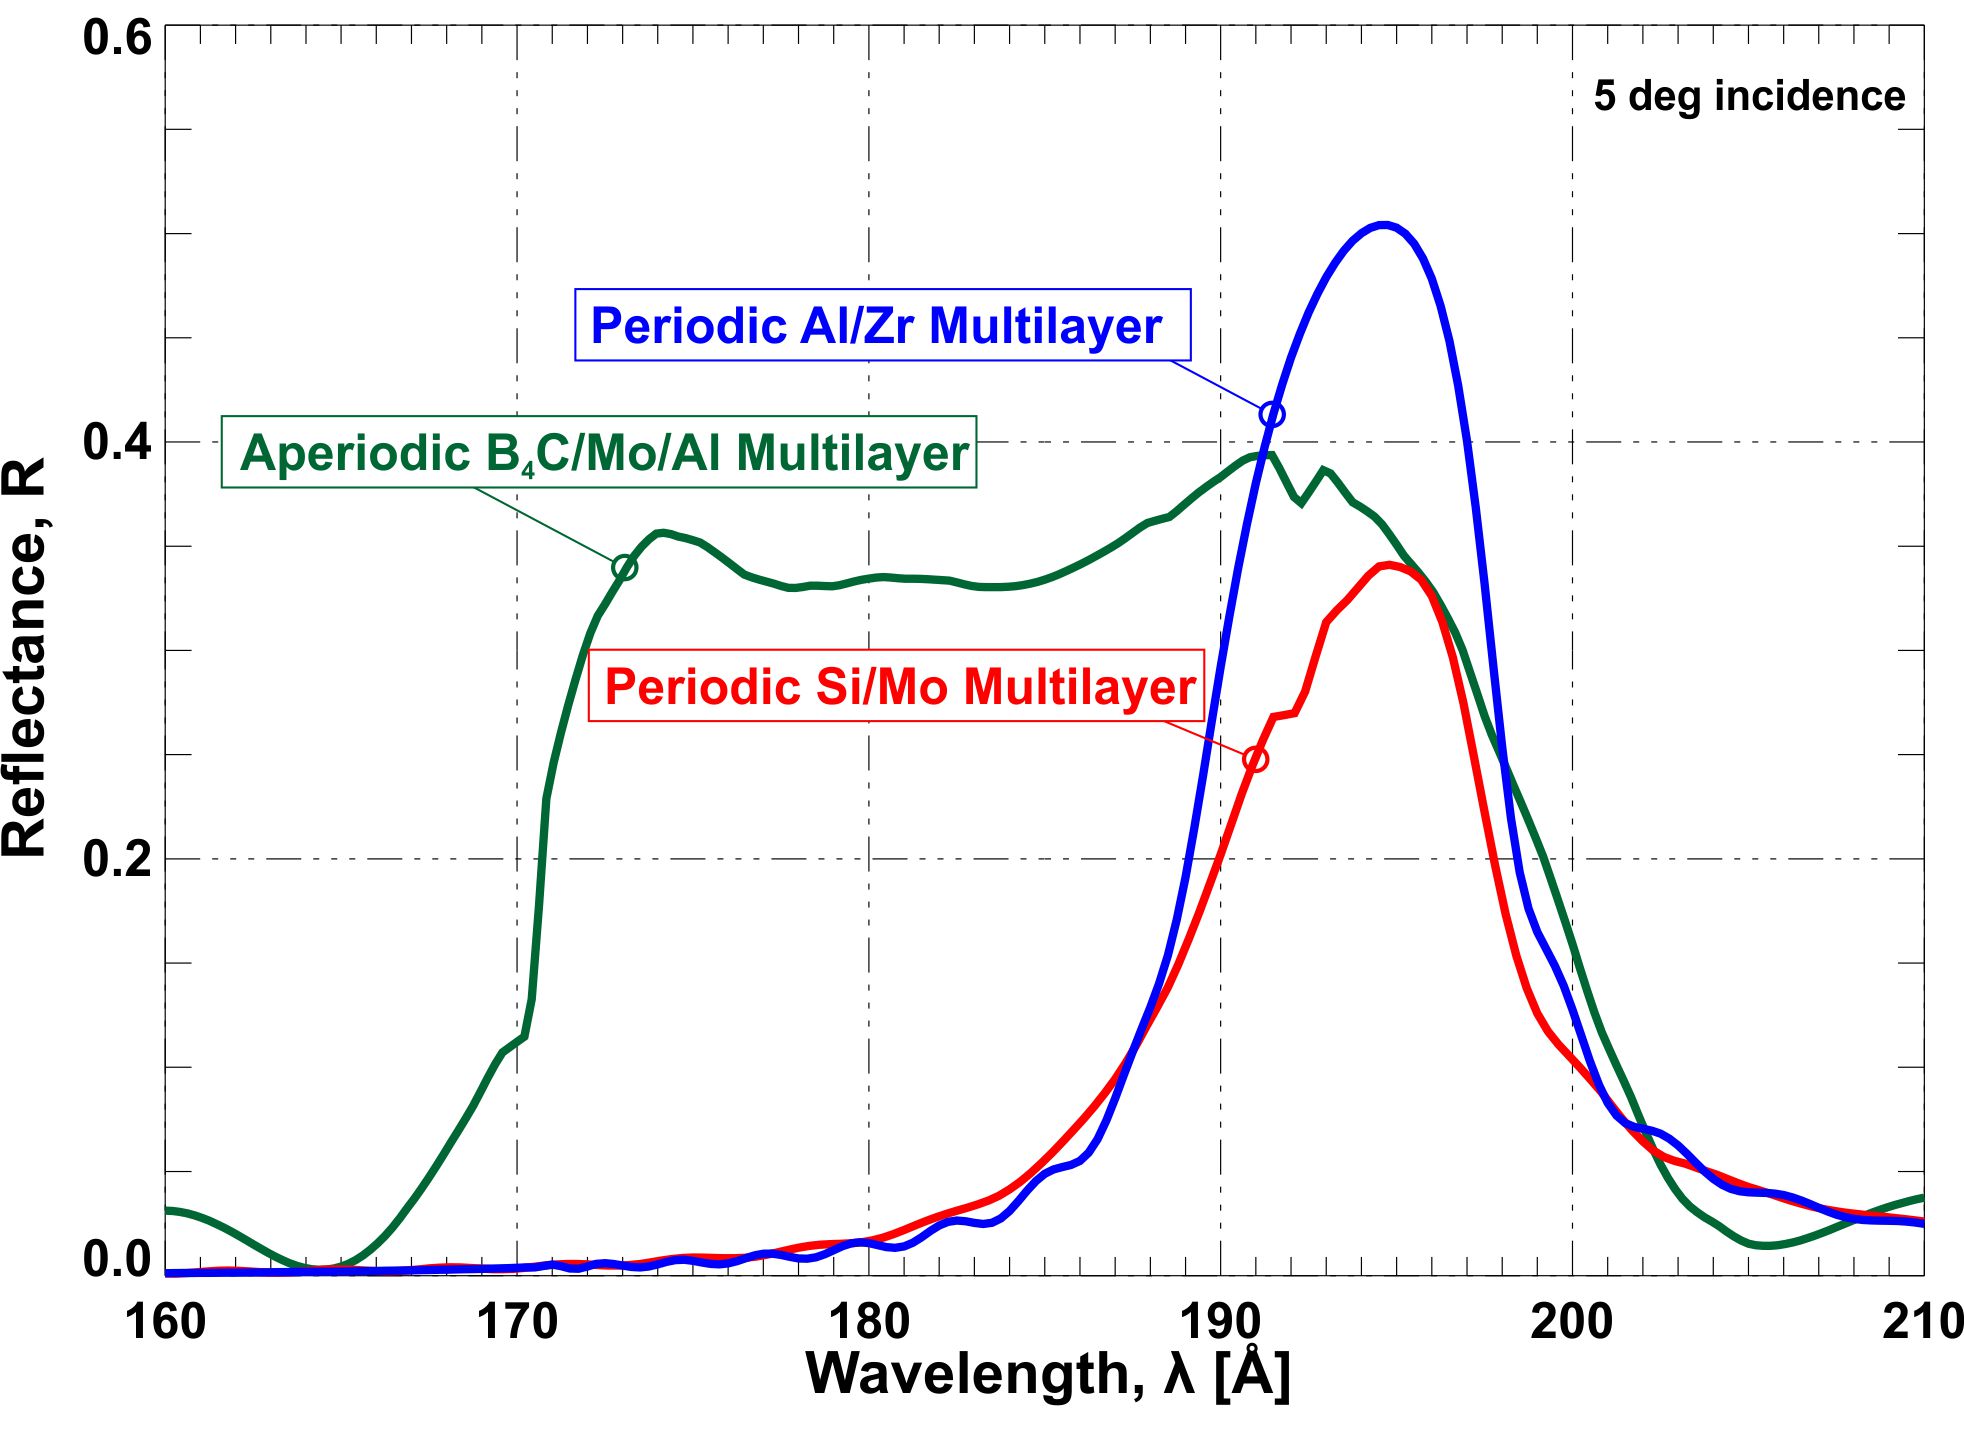
Projected performance: SunCET’s baseline bandpass is 170–200 Å — capturing all of the emission lines in Table 1, which boosts the signal (Section 3.7). The telescope mirrors employ reflective multilayer coatings designed to provide broad spectral response spanning the instrument bandpass. These coatings follow an aperiodic design, and comprise 15 repetitions of alternating layers of B4C, Mo, and Al, with individual layer thicknesses ranging from 5–100 Å. The aperiodic coating design provides an average reflectance of 33% from 170–200 Å, as shown in Figure 6. For reference, periodic multilayer coatings operating in this portion of the EUV are generally used for narrow-band response: for example, the periodic Si/Mo coatings used for the 195 Å channel of the GOES/SUVI instrument, also shown in Figure 6, achieve a peak reflectance of 34% with a spectral bandpass of 9.5 Å full-width-half-max (FWHM). Figure 6 also shows the periodic Al/Zr coatings used for the Hi-C rocket instrument (Kobayashi et al., 2014), which achieve a peak reflectance of 50% with a spectral bandpass of 8.5 Å FWHM. The aperiodic B4C/Mo/Al multilayer coatings are currently under development with funding from the NASA H-TIDeS program.
The C/Al/C entrance filter from Luxel Corporation prevents visible light from entering the chamber and has high heritage (24 of them in GOES/EXIS). It is supported by a 5 lines/inch mesh, which has heritage from the Hi-C sounding rocket flights and avoids the diffraction issues of the 70 lines/inch mesh used on SDO/AIA and TRACE (Lemen et al., 2012; Lin et al., 2001). A second C/Al/C filter directly in front of the detector eliminates visible light from possible pinholes in the primary filter or from stray light in the instrument.
3.5 Spatial Resolution
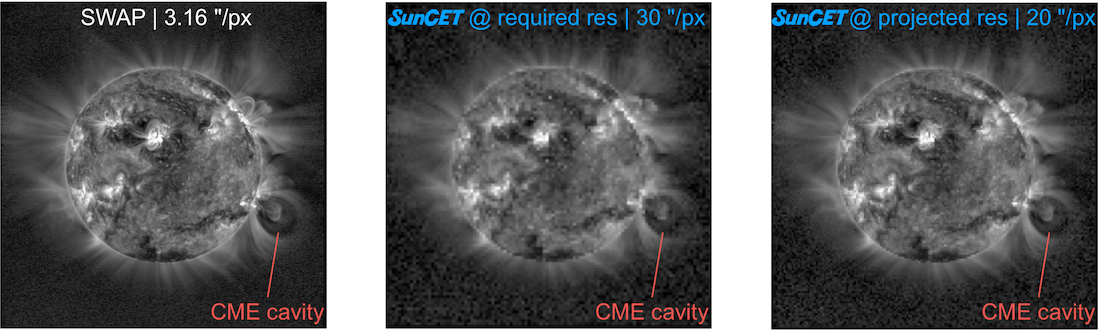
SunCET requires spatial resolution better than 30\arcsec. CME flux ropes often manifest observationally as a cavity which trails behind a bright front (Forsyth et al., 2006). The smallest cavities have a diameter of 0.2 (180\arcsec) and are approximately circular, which corresponds to a circumference of 600\arcsec (Fuller and Gibson, 2009). To account for non-circularities, we require 20 points outlining the cavity, which results in our spatial resolution requirement of 600\arcsec/20 = 30\arcsec. Figure 7 shows a cavity observed in PROBA2/SWAP (3.16\arcsec resolution) binned down to demonstrate that cavities can be resolved at this resolution in practice.
Projected performance: SunCET provides 20\arcsec resolution. Its plate scale is 4.8\arcsec/pixel so 22 binning can be applied, which meets the Nyquist sampling criterion.
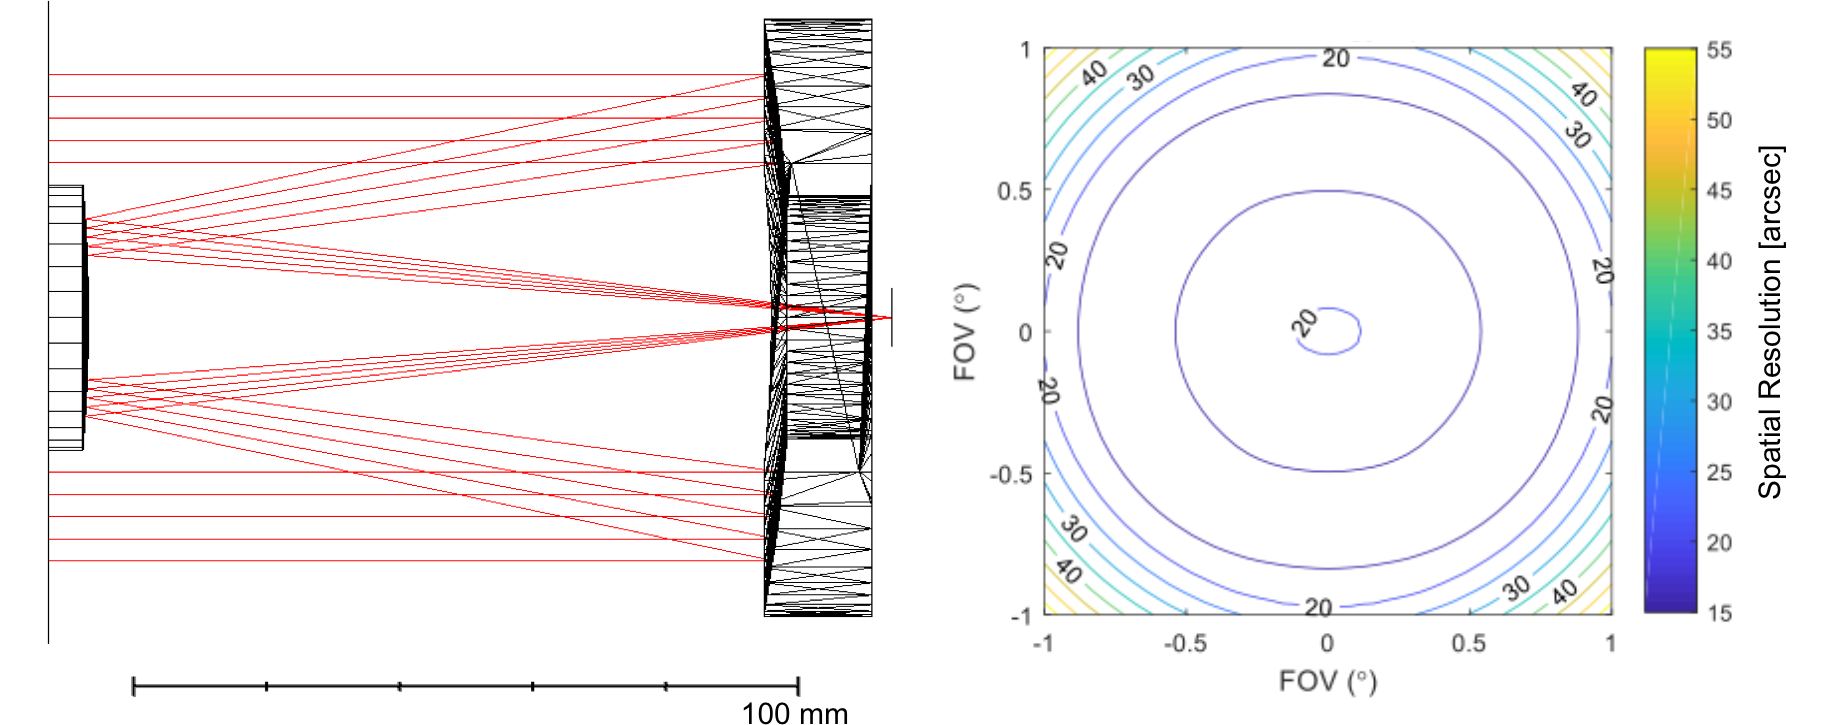
3.6 Mirrors
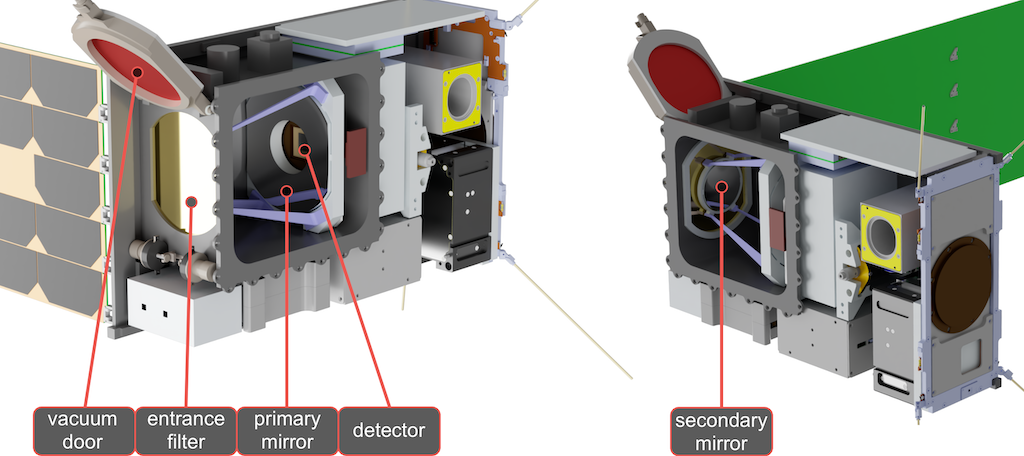
SunCET contains a Ritchey-Chrétien (RC) telescope encased in a vacuum chamber with a one-time-release door (Figure 8). This type of telescope has good performance for wide fields of view (Figure 9) and has been used frequently for similar instruments (e.g., SOHO/EIT, STEREO/EUVI, GOES/SUVI). Despite its compact size, the telescope achieves nearly flat resolution across the wide FOV. The mount for the secondary mirror is designed with a coefficient of thermal expansion matching the mirror to account for focus sensitivity.
3.7 Signal to Noise Ratio (SNR)
SunCET requires a signal to noise ratio (SNR) 10. This is the international standard that defines digital image quality as “acceptable” (ISO 12232, 2019). The same standard defines SNR of 40 as “excellent”. These numbers are in line with the expectations of experts that have done CME image processing with coronagraph and EUV imager data.
| \rowcolor[HTML]1A73C9 | Quiet Sun | Active Region | Flare | 1.05 | 1.5 | 2 | 3 | 3.5 | 4 | ||
|
0.1 | 10 | 40 | 0.2 | |||||||
| Effective exposure [s] | 0.025 | 0.025 | 0.025 | 0.025 | 10 | 10 | 10 | 10 | 10 | ||
| e-/res-element | |||||||||||
|
|||||||||||
| SNR | 122 | Saturated | Saturated | 172 | 944 | 422 | 133 | 77 | 42 |
Projected performance: Table 2 shows the SunCET SNR as a function of distance from the sun, based on the parameters shown in Table 3. Conservative radiance estimates come from GOES/SUVI 195 Å images of a CME that was tracked all the way to the edge of the SUVI 1.7 FOV (Seaton and Darnel, 2018). For the solar disk, the effective exposure is the median of three 0.025-second images; for 1.05–4 , it is the median of ten 1-second exposures. This removes energetic particle tracks and, for the long exposure, increases the full-well saturation limit of the detector by a factor of 10. These conservative estimates show that SunCET CME measurements would have an excellent SNR of 42 even out at 4 .
| \rowcolor[HTML]1A73C9 Instrument parameter | Value | Description | |||||
| Wavelength | 170–200 Å | Broadband response defined by mirror coating | |||||
|
44.9 cm2 |
|
|||||
|
6.88 |
|
|||||
| Pixel size | 7 m 7 m | e2v CIS115 datasheet and confirmed in house | |||||
| Pixel array | 1500 1500 | Full array is 1504 2000; 5 rows dedicated to dark | |||||
| FOV | 4 | Design FOV (requirement is 3.5 ) | |||||
| Plate scale | 4.8\arcsec/pixel |
|
|||||
|
0.06 |
|
|||||
| Quantum yield | 18.3 e-/ph | Average over 170–200 Å bandpass | |||||
| Dark noise | 0.08 e-/pixel/sec | At -10°C, from LASP lab tests | |||||
| Readout noise | 5 e-/pixel | From LASP lab tests | |||||
| Fano noise | 1.3 e-/pixel | Fano factor of 0.1 for Si | |||||
| Max read rate |
|
In SunCET, 500 rows corresponds to 0–1.33 |
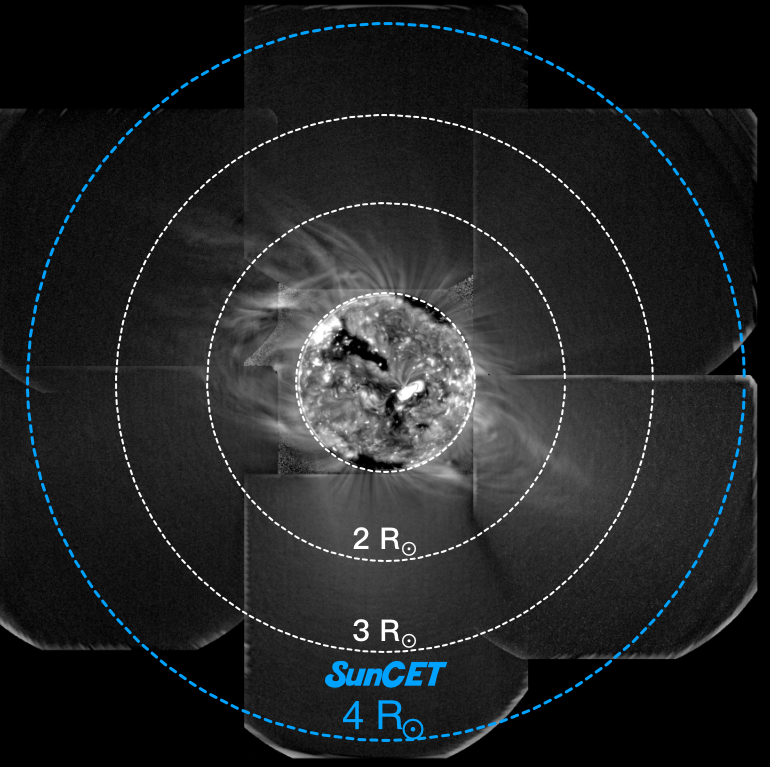
Few observations of the extended corona above 2 have been made in the EUV, but among these there is clear evidence that the CME signal will be detectable (Tadikonda et al. 2019, Figure 10). At about 3 , noise in SUVI becomes comparable to solar signal. SunCET, however, is optimized for this large FOV. SunCET has a larger primary mirror geometric area (3.5), broadband wavelength response (6.88), and larger pixel solid angle (16) for a total 385 boost in signal compared to SUVI. Furthermore, the SunCET mirrors will be polished to highest degree possible, up to 3 times the smoothness of SUVI’s, to minimize scattered light.
4 Spectrograph Design
The SunCET irradiance spectrograph channel is a high-heritage off-Rowland circle design based on the SDO/EVE Multiple EUV Grating Spectrographs A2 (MEGS-A2) channel (Crotser et al., 2007). It provides the full-Sun solar irradiance from 170-340 Å at 1 Å spectral resolution. This EUV range is important for overlapping with the SunCET imager EUV bands for calibration purposes and provides additional science capability. It observes Fe IX through Fe XVI emission lines that often experience coronal dimming during CMEs (Woods et al., 2011; Mason et al., 2014, 2016, 2019). This allows for halo CME kinematics to be tracked even if SunCET is not deployed on multiple platforms with stereoscopic viewing angles. It also enables study of the energetics powering the CME as a function of time. It shares the vacuum door and detector with the SunCET imager, but has its own optical path including the entrance slit, filters, and grating. These measurements are especially pressing because EVE/MEGS-A experienced a CCD electronics anomaly in 2014 May, preventing the continued solar observations by MEGS-A. While other EVE channels and new GOES EUV Sensor (EUVS) channels are continuing solar EUV observations in the 170-340 Å range, they are only broadband measurements that are not optimized for coronal dimming irradiance observations nor for detailed calibration of solar EUV imagers.
4.1 Spectrograph Dynamic Range
The solar irradiance values, as measured from SDO/EVE (Woods et al., 2012), from 170-340 Å range from – W/m2/nm due to variations in the peaks of the emission line in this range, the reduced irradiance values between the strong emission lines, as well as solar activity including solar minimum times and during the largest solar flares; therefore, the required dynamic range of the spectrograph is .
Projected performance: The dynamic range discussed in Section 3.1 is more than two orders of magnitude better than needed for the spectrograph.
4.2 Spectrograph Spectral Range and Resolution
The SunCET spectrograph requires a spectral range between 170-340 Å and 1 Å spectral resolution. The entrance to the spectrograph is a 3 0.028 mm in order to maximize the slit image height (cross-dispersion direction) on the allotted 500 pixel height of the detector to maximize the SNR, while the width is optimized to meet the 1 Å spectral resolution requirement — it is this slit width and the grating ruling that limits the spectral resolution. The grating ruling, distance and curvature are all optimized in order to meet the spectral range and resolution as well.
The optical path after being dispersed from the grating goes through the hole in the secondary imager mirror and onto the common detector. The grating is a Type-I concave imaging grating in order to image the slit onto the detector. There is an Al/C entrance filter mounted to the entrance slit in order to limit the spectral bandpass close to the required range, and an additional Al filter prior for additional bandpass rejection at the entrance to the imager optical cavity as well as to reduce any stray light or pinholes that may develop in the first filter.
Given the 1500 allotted pixels in the dispersion range, this gives a plate-scale resolution of approximately 0.11 Å per pixel; therefore the spectrograph will oversample the spectral resolution by about a factor of 9, or 4.5 with the 22 pixel binning. This allows for fits to spectral lines to be performed and allow for Doppler shift measurements of emission lines and plasma velocity flows during flares to be calculated (Chamberlin, 2016; Hudson et al., 2011)
Projected performance: SunCET provides 1 Å spectral resolution across the fully observed 170-340 Å spectral range.
4.3 Spectrograph Signal to Noise Ratio (SNR)
The SunCET spectrograph also requires a SNR of 10 or better as discussed in 3.7. This is achieved by using a long-slit and minimal optical elements, along with the high QE detector. The slit was also sized, and filter thickness optimized, to maximize the SNR without while conservatively not saturating or even go beyond the linear full well capacity of the the CMOS sensor. Even with a very large factor of 10 increase (Chamberlin et al., 2008, 2018) during flares for these lines given in Table 4, they will still be almost another factor of 2 below the full-well of this sensor.
| \rowcolor[HTML]1A73C9 Wavelength (Å) | 171 | 193.5 | 195 | 304 | 335 | ||
|---|---|---|---|---|---|---|---|
|
|||||||
| Integration [s] | 10 | 10 | 10 | 10 | 10 | ||
| Counts/Pixel | 737 | 495 | 693 | 1100 | 110 | ||
| SNR | 272 | 237 | 282 | 444 | 145 |
Projected performance: Table 4 shows the SunCET spectrograph SNR for five strong emission lines, based on the parameters shown in Table 5. These estimates show that SunCET solar spectral irradiance measurements would have an excellent SNR of better than 100.
| \rowcolor[HTML]1A73C9 Instrument parameter | Value | Description | ||||
| Wavelength | 170–340 Å |
|
||||
|
0.0098 cm2 | 3.0 mm tall 28 m wide | ||||
|
2000 |
|
||||
| Pixel size | 7 m 7 m | Teledyne e2v CIS115 datasheet and confirmed in house | ||||
| Pixel allocation | 500 1500 | Full array is 1504 2000; 5 rows dedicated to dark | ||||
| FOV | Full Sun | Solar Irradiance, image the slit | ||||
| Plate scale | 0.011 nm |
|
||||
|
0.0122 |
|
||||
| Quantum yield | 18.3 e-/ph | Average over 170-200 Å bandpass | ||||
| Dark noise | 0.08 e-/pixel/sec | At -10°C, from LASP lab tests | ||||
| Readout noise | 5 e-/pixel | From LASP lab tests | ||||
| Fano noise | 1.3 e-/pixel | Fano factor of 0.1 for Si |
5 Detector
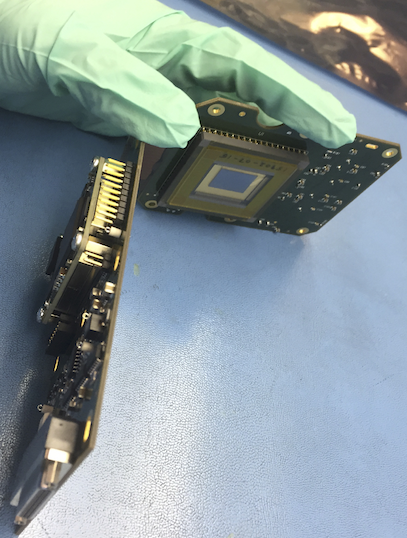
SunCET uses a Teledyne e2v CIS115 back-illuminated, back-thinned CMOS sensor (Table 3, Figure 11). This sensor is a 15042000 pixel array, where a square area of 15001500 pixels will be dedicated to the image while the remaining 5001500 pixels will record the spectrally dispersed slit image from the irradiance spectrograph. Using a single detector to record data from two technically different but scientifically complementary channels significantly reduces the technical resources needed while maximizing science potential.
In 2017, LASP developed custom electronics for readout of this sensor that enables independent exposure control per row. A per-pixel readout is now being developed. LASP’s “Compact Camera and Processor” (CCAP; Figure 11) system with this detector was successfully flown in 2018 on the NASA 36.336 sounding rocket (PI: T. Woods, U. of Colorado/LASP) and more recently in January 2020 on the NASA 36.356 sounding rocket (PI: S. Bailey, Virginia Tech). CCAP includes a Xilinx Kintex-7 FPGA with an embedded 32-bit processor and dedicated image compression core.
6 Instrument Requirements on Spacecraft
The instruments described above place requirements on the performance and capabilities of whatever spacecraft hosts them. They are primarily driven by the imager. Pointing accuracy must be better than 30\arcsecwith stability better than 30\arcsec RMS over 23 seconds and knowledge better than 10\arcsec. This ensures that the center of the sun stays in the center of portion of the detector dedicated to the imager and does not drift significantly during or between integrations. This pointing performance is achievable even on CubeSat platforms as demonstrated by the Miniature X-ray Solar Spectrometer (MinXSS), Arcsecond Space Telescope Enabling Research in Astrophysics (ASTERIA), Compact Spectral Irradiance Monitor (CSIM), and others (Mason et al., 2017; Pong, 2018). Prime science data generation is heavily dependent on CME occurrence rates, but downlink schemes can easily be designed for flexibility and the “poorest” CMEs can be ignored if there are bandwidth limitations. For CME occurrence rates at the middle of the rising phase of the solar cycle, SunCET generates 28 MB/day for the imager, and 65 MB/day of data for the spectrograph. These data are compressed using a lossless JPEG-LS scheme.
7 Conclusions
The SunCET instrument fills a crucial, historically under observed region of the Sun — the middle corona — precisely the region where CMEs experience the majority of their acceleration. This region is inherently very difficult to observe because of the extreme intensity dynamic range between the bright solar disk and the dim corona. SunCET introduces a new technology that avoids the limitations of previous instruments. By developing a detector that can vary exposure time across its surface, we can simultaneously observe the disk without saturating and the dim middle corona; allowing us to track CMEs from their initiation all the way through their primary acceleration phase. Moreover, we can image spectra on the same detector with their own, independent integration time.
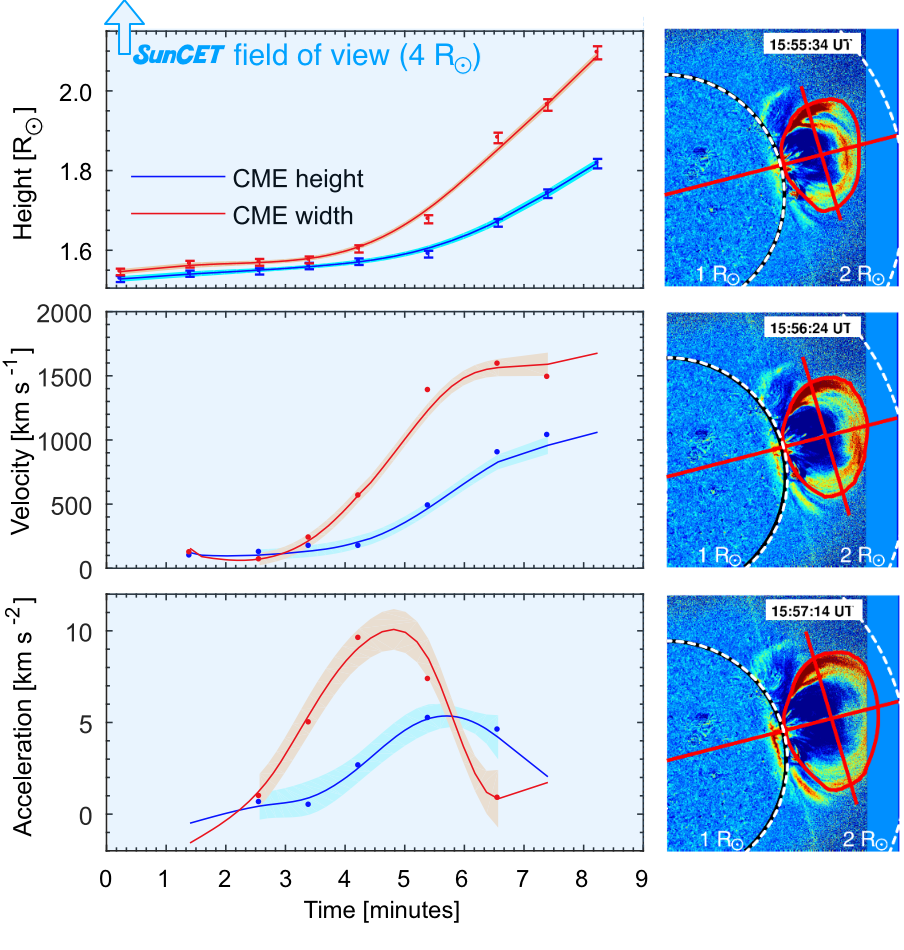
There is a large body of knowledge for tracking CMEs in coronagraphs and EUV imagers (Sarkar et al., 2019; O’Hara et al., 2019; Veronig et al., 2018; Byrne et al., 2014; Mierla et al., 2013; Bein et al., 2011; Gopalswamy et al., 2009; Vršnak et al., 2007). SunCET data processing will employ the techniques already developed for other observatories but improve the results because of its wider FOV (e.g., Veronig et al. 2018; Figure 12) and that it does not require the serendipitous alignment between instrument off-point campaigns and CME occurrence (e.g., O’Hara et al. 2019).
Below we summarize:
-
1.
The majority of CME acceleration occurs in a historical observational gap: the middle corona
-
2.
Observations of full CME acceleration profiles provide tight constraints on models and thus our physical understanding of how the magnetically-dominated corona influences CME kinematics
-
3.
SunCET provides these observations, overcoming the limits of traditional technologies with a novel simultaneous high-dynamic-range detector
-
4.
SunCET is compact and thus suitable for CubeSat missions or an instrument on a larger spacecraft
SunCET is presently in a NASA-funded, competitive Phase A as a 6U CubeSat and has also been proposed to NASA as an instrument onboard a 184 kg Mission of Opportunity.
8 Acknowledgements
J.P.M thanks the numerous people who contributed to the development of the SunCET concept design and the reviewers for their commments that made this paper stronger. A.M.V. and K.D. acknowledge the Austrian Space Applications Programme of the Austrian Research Promotion Agency FFG (ASAP-11 4900217 CORDIM and ASAP-14 865972 SSCME, BMVIT).
References
- Aime et al. (2019) Aime, C., C. Theys, R. Rougeot, and H. Lantéri, 2019. Principle of Fredholm image reconstruction in the vignetting zone of an externally occulted solar coronagraph: Application to ASPIICS. Astronomy & Astrophysics, 622, A212. 10.1051/0004-6361/201833843, URL https://doi.org/10.1051/0004-6361/201833843.
- Aschwanden (2009) Aschwanden, M. J., 2009. 4-D modeling of CME expansion and EUV dimming observed with STEREO/EUVI. Annales Geophysicae, 27(8), 3275–3286. 10.5194/angeo-27-3275-2009, URL http://www.ann-geophys.net/27/3275/2009/.
- Aschwanden et al. (2009) Aschwanden, M. J., N. V. Nitta, J.-P. Wuelser, J. R. Lemen, A. Sandman, A. Vourlidas, and R. C. Colaninno, 2009. First Measurements of the Mass of Coronal Mass Ejections From the EUV Dimming Observed With Stereo EUVI A + B Spacecraft. The Astrophysical Journal, 706(1), 376–392. 10.1088/0004-637X/706/1/376, URL http://stacks.iop.org/0004-637X/706/i=1/a=376?key=crossref.88f60571a09db37b8197341ac713fd1a.
- Barlyaeva et al. (2018) Barlyaeva, T., J. Wojak, P. Lamy, B. Boclet, and I. Toth, 2018. Periodic behaviour of coronal mass ejections, eruptive events, and solar activity proxies during solar cycles 23 and 24. Journal of Atmospheric and Solar-Terrestrial Physics, 177, 12–28. 10.1016/j.jastp.2018.05.012.
- Bateman (1978) Bateman, G., 1978. MHD Instabilities. MIT Press, Cambridge, Massachusetts. ISBN 9780262021319.
- Bein et al. (2011) Bein, B. M., S. Berkebile-Stoiser, A. M. Veronig, M. Temmer, N. Muhr, I. Kienreich, D. Utz, and B. Vršnak, 2011. Impulsive Acceleration of Coronal Mass Ejections. I. Statistics and Coronal Mass Ejection Source Region Characteristics. Astrophysical Journal, 738(2), 191. 10.1088/0004-637X/738/2/191, URL http://stacks.iop.org/0004-637X/738/i=2/a=191?key=crossref.f0398b90f91cbeb1263748f98e279bbd.
- Byrne et al. (2014) Byrne, J. P., H. Morgan, D. B. Seaton, H. M. Bain, and S. R. Habbal, 2014. Bridging EUV and white-light observations to inspect the initiation phase of a “two-stage” solar eruptive event. Solar Physics, 289(12), 4545–4562. 10.1007/s11207-014-0585-8.
- Chamberlin (2016) Chamberlin, P. C., 2016. Measuring Solar Doppler Velocities in the He ii 30.38 nm Emission Using the EUV Variability Experiment (EVE). Solar Physics, 291(6), 1665–1679. 10.1007/s11207-016-0931-0, URL https://link.springer.com/article/10.1007/s11207-016-0931-0.
- Chamberlin et al. (2018) Chamberlin, P. C., T. N. Woods, L. Didkovsky, F. G. Eparvier, A. R. Jones, et al., 2018. Solar Ultraviolet Irradiance Observations of the Solar Flares During the Intense September 2017 Storm Period. Space Weather, 16(10), 1470–1487. 10.1029/2018SW001866, URL https://agupubs.onlinelibrary.wiley.com/doi/full/10.1029/2018SW001866.
- Chamberlin et al. (2008) Chamberlin, P. C., T. N. Woods, and F. G. Eparvier, 2008. Flare Irradiance Spectral Model (FISM): Flare component algorithms and results. Space Weather, 6(5), n/a–n/a. 10.1029/2007SW000372, URL http://doi.wiley.com/10.1029/2007SW000372.
- Chikunova et al. (2020) Chikunova, G., K. Dissauer, T. Podladchikova, and A. M. Veronig, 2020. Coronal dimmings associated with coronal mass ejections on the solar limb. submitted. URL http://arxiv.org/abs/2005.03348.
- Crotser et al. (2007) Crotser, D. A., T. N. Woods, F. G. Eparvier, M. A. Triplett, and D. L. Woodraska, 2007. SDO-EVE EUV spectrograph optical design and performance. In S. Fineschi and R. A. Viereck, eds., Solar Physics and Space Weather Instrumentation II, vol. 6689, 66890M. SPIE. 10.1117/12.732592, URL http://proceedings.spiedigitallibrary.org/proceeding.aspx?doi=10.1117/12.732592.
- D’Huys et al. (2014) D’Huys, E., D. B. Seaton, S. Poedts, and D. Berghmans, 2014. Observational characteristics of coronal mass ejections without low-coronal signatures. Astrophysical Journal, 795(1), 49. 10.1088/0004-637X/795/1/49.
- Dissauer et al. (2019) Dissauer, K., A. M. Veronig, M. Temmer, and T. Podladchikova, 2019. Statistics of coronal dimmings associated with coronal mass ejections. II. Relationship between coronal dimmings and their associated CMEs. The Astrophysical Journal, 874(2), 123. 10.3847/1538-4357/ab0962, URL http://stacks.iop.org/0004-637X/874/i=2/a=123?key=crossref.833720587c5d6f444910c7dec84f30d9http://arxiv.org/abs/1810.01589.
- Dissauer et al. (2018) Dissauer, K., A. M. Veronig, M. Temmer, T. Podladchikova, and K. Vanninathan, 2018. Statistics of Coronal Dimmings Associated with Coronal Mass Ejections. I. Characteristic Dimming Properties and Flare Association. The Astrophysical Journal, 863(2), 169. 10.3847/1538-4357/aad3c6, URL http://stacks.iop.org/0004-637X/863/i=2/a=169?key=crossref.04b1e3af0e5af3d849583869b3fb6f27.
- Fan (2016) Fan, Y., 2016. Modeling the Initiation of the 2006 December 13 Coronal Mass Ejection in AR 10930: The Structure and Dynamics of the Erupting Flux Rope. The Astrophysical Journal, 824(93), 12. 10.3847/0004-637x/824/2/93, URL http://arxiv.org/abs/1604.05687http://dx.doi.org/10.3847/0004-637X/824/2/93.
- Forbes et al. (2018) Forbes, T. G., D. B. Seaton, and K. K. Reeves, 2018. Reconnection in the Post-impulsive Phase of Solar Flares. The Astrophysical Journal, 858, 70. 10.3847/1538-4357/aabad4.
- Forsyth et al. (2006) Forsyth, R. J., V. Bothmer, C. Cid, N. U. Crooker, T. S. Horbury, et al., 2006. ICMEs in the inner heliosphere: Origin, evolution and propagation effects: Report of working group G. Space Science Reviews, 123, 383–416. 10.1007/s11214-006-9022-0.
- Fuller and Gibson (2009) Fuller, J., and S. E. Gibson, 2009. A survey of coronal cavity density profiles. The Astrophysical Journal, 700, 1205–1215. 10.1088/0004-637X/700/2/1205.
- Gopalswamy et al. (2009) Gopalswamy, N., S. Yashiro, G. Michalek, G. Stenborg, A. Vourlidas, F. S. L, and R. A. Howard, 2009. The SOHO / LASCO CME Catalog. Earth Moon Planet, 104, 295–313. 10.1007/s11038-008-9282-7.
- Green et al. (2018) Green, L. M., T. Török, B. Vršnak, W. Manchester, and A. Veronig, 2018. The Origin, Early Evolution and Predictability of Solar Eruptions. Space Science Reviews, 214(1), 46. 10.1007/s11214-017-0462-5.
- Hood and Priest (1981) Hood, A. W., and E. R. Priest, 1981. Critical Conditions for Magnetic Instabilities in Force-Free Coronal Loops. Geophysical & Astrophysical Fluid Dynamics, 17(1), 297–318. 10.1080/03091928108243687.
- Howard et al. (2008) Howard, R. A., J. D. Moses, A. Vourlidas, J. S. Newmark, D. G. Socker, et al., 2008. Sun Earth Connection Coronal and Heliospheric Investigation (SECCHI). Space Science Reviews, 136(1-4), 67–115. 10.1007/s11214-008-9341-4, URL http://link.springer.com/10.1007/s11214-008-9341-4.
- Hudson et al. (2011) Hudson, H. S., T. N. Woods, P. C. Chamberlin, L. Fletcher, G. Del Zanna, L. Didkovsky, N. Labrosse, and D. Graham, 2011. The EVE Doppler Sensitivity and Flare Observations. Solar Physics, 273(1), 69–80. 10.1007/s11207-011-9862-y, URL http://link.springer.com/10.1007/s11207-011-9862-y.
- ISO 12232 (2019) ISO 12232, 2019. Photography – Digital Still Cameras – Determination of Exposure Index, ISO Speed Ratings, Standard Output Sensitivity, and Recommended Exposure Index. Tech. rep., International Organization for Standardization, Geneva, CH.
- Kaiser et al. (2007) Kaiser, M. L., T. A. Kucera, J. M. Davila, O. C. St. Cyr, M. Guhathakurta, and E. Christian, 2007. The STEREO Mission: An Introduction. Space Science Reviews, 136(1-4), 5–16. 10.1007/s11214-007-9277-0, URL http://link.springer.com/10.1007/s11214-007-9277-0.
- Kay and Gopalswamy (2018) Kay, C., and N. Gopalswamy, 2018. The Effects of Uncertainty in Initial CME Input Parameters on Deflection, Rotation, Bz , and Arrival Time Predictions. Journal of Geophysical Research: Space Physics, 123, 7220–7240. 10.1029/2018JA025780.
- Kay and Opher (2015) Kay, C., and M. Opher, 2015. The Heliocentric Distance Where the Deflections and Rotations of Solar Coronal Mass Ejections Occur. The Astrophysical Journal Letters, 811, L36. 10.1088/2041-8205/811/2/L36.
- Kay et al. (2016) Kay, C., M. Opher, R. C. Colaninno, and A. Vourlidas, 2016. Using ForeCAT Deflections and Rotations to Constrain the Early Evolution of CMEs. The Astrophysical Journal, 827(1), 70. 10.3847/0004-637X/827/1/70, URL http://arxiv.org/abs/1606.03460%****␣main.bbl␣Line␣250␣****http://dx.doi.org/10.3847/0004-637X/827/1/70http://stacks.iop.org/0004-637X/827/i=1/a=70?key=crossref.fd824e09edb6a2c662122ed885296355.
- Kay et al. (2013) Kay, C., M. Opher, and R. M. Evans, 2013. Forecasting a Coronal Mass Ejection’s Altered Trajectory: ForeCAT. The Astrophysical Journal, 775(1), 5. 10.1088/0004-637X/775/1/5, URL http://stacks.iop.org/0004-637X/775/i=1/a=5?key=crossref.60dd88082ab7f70bf71897944c86b722.
- Kay et al. (2015) Kay, C., M. Opher, and R. M. Evans, 2015. Global Trends of CME Deflections Based on CME and Solar Parameters. The Astrophysical Journal, 805(2), 168. 10.1088/0004-637X/805/2/168, URL http://stacks.iop.org/0004-637X/805/i=2/a=168?key=crossref.7f7c0fc9c0ff14b3f341631e5120e261.
- Kay (2016) Kay, C. D., 2016. ForeCAT - A Model for Magnetic Deflections of Coronal Mass Ejections. Ph.D. thesis, Boston University. URL https://search.proquest.com/docview/1767403214.
- Kliem and Török (2006) Kliem, B., and T. Török, 2006. Torus Instability. Physical Review Letters, 96(1), 4. 10.1103/PhysRevLett.96.255002.
- Kobayashi et al. (2014) Kobayashi, K., J. Cirtain, A. R. Winebarger, K. Korreck, L. Golub, et al., 2014. The High-Resolution Coronal Imager (Hi-C). Solar Physics, 289(11), 4393–4412. 10.1007/s11207-014-0544-4, URL http://link.springer.com/10.1007/s11207-014-0544-4.
- Koutchmy (1988) Koutchmy, S., 1988. Space-Born Coronagraphy. Space Science Reviews, 47, 95–143. URL http://articles.adsabs.harvard.edu/pdf/1988SSRv...47...95K.
- Lemen et al. (2012) Lemen, J. R., A. M. Title, D. J. Akin, P. F. Boerner, C. Chou, et al., 2012. The Atmospheric Imaging Assembly (AIA) on the Solar Dynamics Observatory (SDO). Solar Physics, 275(1-2), 17–40. 10.1007/s11207-011-9776-8, URL http://link.springer.com/10.1007/s11207-011-9776-8.
- Lin et al. (2001) Lin, A. C., R. W. Nightingale, and T. D. Tarbell, 2001. Diffraction pattern analysis of bright trace flares. Solar Physics, 198(2), 385–398. 10.1023/A:1005213527766.
- Martínez-Galarce et al. (2010) Martínez-Galarce, D., J. Harvey, M. Bruner, J. Lemen, E. Gullikson, R. Soufli, E. Prast, and S. Khatri, 2010. A novel forward-model technique for estimating EUV imaging performance: design and analysis of the SUVI telescope. In Space Telescopes and Instrumentation 2010: Ultraviolet to Gamma Ray, vol. 7732, 773,237–1. 10.1117/12.864577.
- Mason et al. (2019) Mason, J. P., R. Attie, C. N. Arge, B. Thompson, and T. N. Woods, 2019. The SDO/EVE Solar Irradiance Coronal Dimming Index Catalog. I. Methods and Algorithms. The Astrophysical Journal Supplement Series, 244(1), 13. 10.3847/1538-4365/ab380e, URL https://iopscience.iop.org/article/10.3847/1538-4365/ab380e.
- Mason et al. (2017) Mason, J. P., M. Baumgart, B. Rogler, C. Downs, M. Williams, et al., 2017. MinXSS-1 CubeSat On-Orbit Pointing and Power Performance: The First Flight of the Blue Canyon Technologies XACT 3-axis Attitude Determination and Control System. Journal of Small Satellites, 6(3), 651–662. URL http://arxiv.org/abs/1706.06967https://jossonline.com/letters/minxss-1-cubesat-on-orbit-pointing-and-power-performance-the-first-flight-of-the-blue-canyon-technologies-xact-3-axis-attitude-determination-and-control-system/.
- Mason et al. (2014) Mason, J. P., T. N. Woods, A. Caspi, B. J. Thompson, and R. A. Hock, 2014. Mechanisms and Observations of Coronal Dimming for the 2010 August 7 Event. The Astrophysical Journal, 789(1), 61. 10.1088/0004-637X/789/1/61, URL http://adsabs.harvard.edu/abs/2014ApJ...789...61M.
- Mason et al. (2016) Mason, J. P., T. N. Woods, D. F. Webb, B. J. Thompson, R. C. Colaninno, and A. Vourlidas, 2016. Relationship of EUV Irradiance Coronal Dimming Slope and Depth to Coronal Mass Ejection Speed and Mass. The Astrophysical Journal, 830(20), 12. 10.3847/0004-637X/830/1/20, URL http://stacks.iop.org/0004-637X/830/i=1/a=20?key=crossref.2d956aff9237fc3069d8edd80c37186d.
- Mierla et al. (2013) Mierla, M., D. B. Seaton, D. Berghmans, I. Chifu, A. De Groof, B. Inhester, L. Rodriguez, G. Stenborg, and A. N. Zhukov, 2013. Study of a Prominence Eruption using PROBA2/SWAP and STEREO/EUVI Data. Solar Physics, 286(1), 241–253. 10.1007/s11207-012-9965-0, URL http://link.springer.com/10.1007/s11207-012-9965-0.
- O’Hara et al. (2019) O’Hara, J. P., M. Mierla, O. Podladchikova, E. D’Huys, and M. J. West, 2019. Exceptional Extended Field-of-view Observations by PROBA2 /SWAP on 2017 April 1 and 3 . The Astrophysical Journal, 883(1), 59. 10.3847/1538-4357/ab3b08, URL http://dx.doi.org/10.3847/1538-4357/ab3b08.
- Pong (2018) Pong, C., 2018. On-Orbit Performance and Operation of the Attitude and Pointing Control Subsystems on ASTERIA. In AIAA/USU Conference on Small Satellites. Logan, UT. URL https://digitalcommons.usu.edu/smallsat/2018/all2018/361.
- Sarkar et al. (2019) Sarkar, R., N. Srivastava, M. Mierla, M. J. West, and E. D’Huys, 2019. Evolution of the Coronal Cavity From the Quiescent to Eruptive Phase Associated with Coronal Mass Ejection. The Astrophysical Journal, 875, 101. 10.3847/1538-4357/ab11c5.
- Schrijver et al. (2008) Schrijver, C. J., C. Elmore, B. Kliem, T. Torok, and A. M. Title, 2008. Observations and Modeling of the Early Acceleration Phase of Erupting Filaments Involved in Coronal Mass Ejections. The Astrophysical Journal, 674(1), 586–595. 10.1086/524294.
- Seaton et al. (2013) Seaton, D. B., D. Berghmans, B. Nicula, J. P. Halain, A. De Groof, et al., 2013. The SWAP EUV Imaging Telescope Part I: Instrument Overview and Pre-Flight Testing. Solar Physics, 286(1), 43–65. 10.1007/s11207-012-0114-6.
- Seaton and Darnel (2018) Seaton, D. B., and J. M. Darnel, 2018. Observations of an Eruptive Solar Flare in the Extended EUV Solar Corona. The Astrophysical Journal Letters, 852, L9. 10.3847/2041-8213/aaa28e.
- Tadikonda et al. (2019) Tadikonda, S. K., D. C. Freesland, R. R. Minor, D. B. Seaton, G. J. Comeyne, and A. Krimchansky, 2019. Coronal Imaging with the Solar UltraViolet Imager. Solar Physics, 294, 28. 10.1007/s11207-019-1411-0.
- Thompson et al. (2000) Thompson, B. J., E. W. Cliver, N. V. Nitta, C. Delannée, and J. P. Delaboudiniere, 2000. Coronal Dimmings and Energetic CMEs in April-May 1998. Geophysical Research Letters, 27(10), 1431–1434.
- Török and Kliem (2007) Török, T., and B. Kliem, 2007. Numerical simulations of fast and slow coronal mass ejections. Astronomische Nachrichten, 328(8), 743–746. 10.1002/asna.200710795.
- Veronig et al. (2018) Veronig, A. M., T. Podladchikova, K. Dissauer, M. Temmer, D. B. Seaton, D. Long, J. Guo, B. Vršnak, L. Harra, and B. Kliem, 2018. Genesis and Impulsive Evolution of the 2017 September 10 Coronal Mass Ejection. The Astrophysical Journal, 868, 107. 10.3847/1538-4357/aaeac5, URL https://doi.org/10.3847/1538-4357/aaeac5.
- Vršnak et al. (2007) Vršnak, B., D. Maričić, A. L. Stanger, A. M. Veronig, M. Temmer, and D. Roša, 2007. Acceleration phase of coronal mass ejections: I. Temporal and spatial scales. Solar Physics, 241(1), 85–98. 10.1007/s11207-006-0290-3, URL https://link.springer.com/article/10.1007/s11207-006-0290-3.
- Webb and Howard (2012) Webb, D. F., and T. A. Howard, 2012. Coronal Mass Ejections: Observations. Living Reviews in Solar Physics, 9, 3. 10.12942/lrsp-2012-3, URL http://link.springer.com/10.12942/lrsp-2012-3.
- Woods et al. (2012) Woods, T. N., F. G. Eparvier, R. A. Hock, A. R. Jones, D. L. Woodraska, et al., 2012. Extreme Ultraviolet Variability Experiment (EVE) on the Solar Dynamics Observatory (SDO): Overview of Science Objectives, Instrument Design, Data Products, and Model Developments. Solar Physics, 275, 115–143. 10.1007/s11207-009-9487-6, URL http://link.springer.com/10.1007/s11207-009-9487-6.
- Woods et al. (2011) Woods, T. N., R. A. Hock, F. G. Eparvier, A. R. Jones, P. C. Chamberlin, et al., 2011. New Solar Extreme-Ultraviolet irradiance Observations During Flares. The Astrophysical Journal, 739, 59. 10.1088/0004-637X/739/2/59.