QCD Critical Point and High Baryon Density Matter ††thanks: Presented at workshop on ”Criticality in QCD and the Hadron Resonance Gas”, Wroclaw (online), July 29-31, 2020
Abstract
We report the latest results on the search for the QCD critical point in the QCD phase diagram through high energy heavy-ion collisions. The measurements discussed are based on the higher moments of the net-proton multiplicity distributions in heavy-ion collisions. A non-monotonic variation in the product of kurtosis times the variance of the net-proton distribution is observed as a function of the collision energy with 3 significance. We also discuss the results of the thermal model in explaining the measured particle yield ratios in heavy-ion collisions and comparison of the different variants of hardon resonance gas model calculation to the data on higher moments of net-proton distributions. We end with a note that the upcoming programs in high baryon density regime at various experimental facilities will complete the search for the QCD critical point through heavy-ion collisions.
25.75.-q,25.75.Nq, 12.38.Mh, 12.38.-t,25.75.Gz
1 Introduction
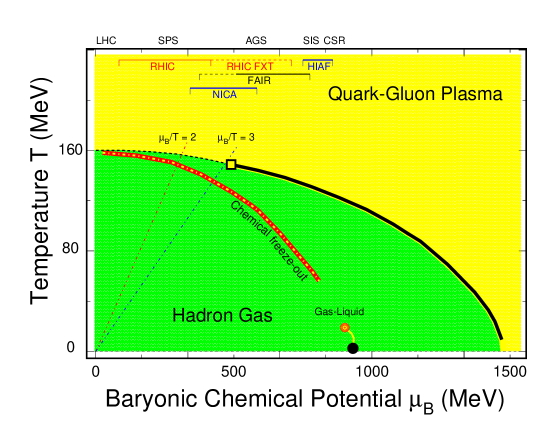
Relativistic heavy-ion collisions at varying center of mass energy () allows for the study of the phase diagram of nuclear matter [1]. The underlying theory is the one that governs the strong interactions - Quantum Chromodynamics (QCD). The conjectured phase diagram of QCD is shown in Fig. 1. The current status of the phase diagram is as follows. There are two distinct phases in the phase structure: de-confined state of quarks and gluons called the quark gluon plasma (QGP) and the confined state of gas of hadrons and resonances (HRG). The phase boundary (shown as a solid line in Fig. 1) between the hadronic gas phase and the high-temperature quark-gluon phase is a first-order phase transition line, which begins at large baryon chemical potential () and small temperature () and curves towards smaller and larger . This line ends at the QCD critical point whose conjectured position, indicated by a square, is uncertain both theoretically and experimentally. At smaller there is a cross over indicated by a dashed line. The region of / 2 is shown as dot-dashed line. A comparison between RHIC data and lattice QCD (LQCD) calculations disfavours the possible QCD critical point being located at / 2 [2, 3]. The red-yellow dotted line corresponds to the chemical freeze-out obtained from the fits of particle yields in heavy-ion collisions using a thermal model. The liquid-gas transition region features a second order critical point (red-circle) and a first-order transition line (yellow line) that connect the critical point to the ground state of nuclear matter ( 0 and 925 MeV) [4]. The regions of the phase diagram accessed by past (AGS and SPS), ongoing (LHC, RHIC, SPS and RHIC operating in fixed target mode), and future (FAIR and NICA) experimental facilities are also indicated.
In this proceeding, we discuss the success and tests of the hadron resonance gas model using the particle ratios and fluctuations in net-proton number produced in heavy-ion collisions. We also discuss the status of the search for the QCD critical point and future experimental directions in this connection at the upcoming facilities.
2 Particle ratio and thermal model
Thermal models, assuming approximate local thermal equilibrium, have been successfully applied to matter produced in heavy-ion collisions. Most popular variant of such a model employs Grand Canonical Ensemble (GCE), hence uses chemical potentials to account for conservation of quantum numbers on an average [5]. For systems created via elementary collisions (small system) or via low energy heavy-ion collisions, the Canonical Ensemble (CE) approach is used. In the large volume limit, the GCE and the CE formalisms should be equivalent. In heavy-ion collisions at energies spanning from few GeV to few TeV it may be worthwhile to ask at what collision energy a transition from GCE to CE occurs [6] ?
2.1 Success of thermal model
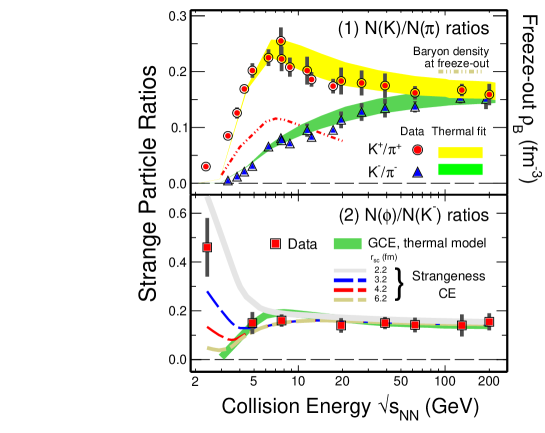
Figure 2 (1) in the upper panel shows the energy dependence of / particle yield ratio produced in heavy-ion collisions at AGS [7, 8, 9], SPS [10, 11] and RHIC [12]. The thermal model calculation explains the / ratios that reflect the strangeness content relative to entropy of the system formed in heavy-ion collisions. This can be treated as a success of the application of thermal model to heavy-ion collisions. A peak in the energy dependence of / could be due to associated production dominance at lower energies as the baryon stopping is large. The peak is consistent with the calculated net baryon density reaching a maximum [13] has been suggested to be a signature of a change in degrees of freedom (baryon to meson [14] or hadrons to QGP [15]) while going from lower to higher energies. The / ratio seems unaffected by the changes in the net-baryon density with collision energy and shows a smooth increasing trend.
2.2 Transition from grand canonical to canonical ensemble
Figure 2 (2) in the lower panel shows the energy dependence of / yield ratio measured in heavy-ion collisions [16, 17, 18]. As one moves from higher to lower collision energy, the / ratio changes rapidly from a constant value to larger values. The transition happens below the collision energy where the freeze-out net-baryon density peaks (see upper panel). Thermal model calculations with GCE explains the measurements up to collision energy of GeV. At lower energies the GCE model expectation is that the / ratio should decrease in contrast to that observed in experiments. On the other hand, the increase in / at lower energies is explained by thermal model with CE framework for strangeness production. The results are also sensitive to the choice of the additional control parameter, , in CE framework, which decides the typical spatial size of correlations. Hence, we find that a high statistics and systematic measurement of / yield ratio can be used to test the transition of GCE to CE in thermal models. As the size of the correlations depends on the medium properties, such studies will provide valuable data for estimation of the volume in which open strangeness is produced.
3 Net-proton number fluctuations and QCD critical point
The QCD critical point is a landmark on the QCD phase diagram. Experimental signatures for critical point is enhanced fluctuations coupled to the critical modes. In this respect the baryon number fluctuations are sensitive to the criticality [19]. At the critical point, generally, the correlation length takes large values, and that leads to non-Gaussian fluctuations [20]. Higher-order fluctuations are more sensitive to the criticality, the third order () and the fourth order () are common measures for the QCD critical point search, where , and are called the standard deviation, skewness and the kurtosis of the distribution, respectively. Experimentally, net-proton distribution is considered as a proxy for net-baryon distributions.
3.1 Net-proton number fluctuations
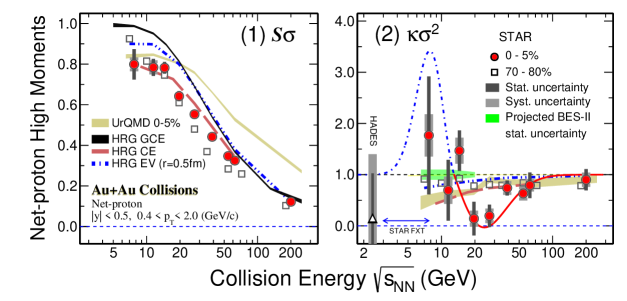
Figure 3 shows the most relevant measurements over the widest range in ( MeV) to date for the critical point search [21]. As we go from observables involving lower order moments () to higher order moments (), deviations between central and peripheral collisions for the measured values increases. Central collisions data show a non-monotonic variation with collision energy with respect to the statistical baseline of = 1 at a significance of 3 [21]. The deviations of below the baseline are qualitatively consistent with theoretical considerations including a critical point [22]. In addition, experimental data show deviation from heavy-ion collision models without a critical point. This can be seen from the table 1 which shows values of a test between the experimental data and various models. In all cases, within 7.7 (GeV) 27, the tests return -values that are less than 0.05. This implies that the monotonic energy dependence from all of the models are statistically inconsistent with the data. Although a non-monotonic variation of the experimental data with collision energy looks promising for the QCD critical point search, a more robust conclusion can be derived when the uncertainties get reduced and significance above is reached. This is the plan for the RHIC Beam Energy Scan Phase-II program.
| Moments | HRG GCE | HRG EV | HRG CE | UrQMD |
| (r = 0.5 fm) | ||||
| 0.001 | 0.001 | 0.0754 | 0.001 | |
| 0.00553 | 0.0145 | 0.0450 | 0.0221 |
3.2 Comparison to Lattice QCD inspired fits
In the previous sub-section we have seen that the data deviates from the expectations based on UrQMD and HRG models. Figures 4 and 5 show that several features of the data are qualitatively consistent with LQCD calculations of net baryon-number fluctuations up to NLO in [2]. Specifically, (a) , where is the mean of the net-proton distribution; is smaller than unity and tending to decrease with increasing ; and with increasing , the cumulant ratio departs further away from unity than the ratio for GeV. The LQCD inspired fits are of the form: = + ; = + and = + . Where , , , and are fit parameters and we have used the equivalence between product of the moments and ratios of cumulants as = ; = and = . The good agreement between data and LQCD inspired fits for range between 200 to 19.6 GeV, suggests that the heavy-ion collisions have produced a strongly interacting QCD matter.


4 Experimental programs for high baryon density
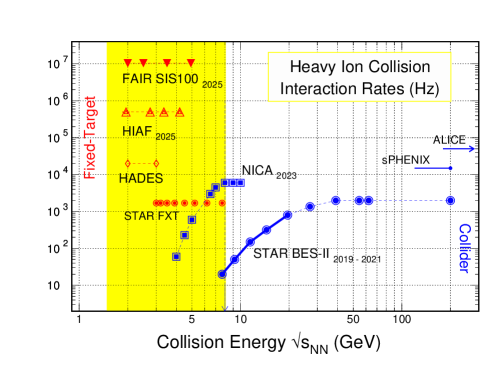
As seen from the measurements discussed in previous section, to complete the critical point search program a high statistics phase - II of the beam energy scan program at RHIC is needed. In addition, future new experiments, which are all designed with high rates, large acceptance, and the state-of-the-art particle identification, at the energy region where baryon density is high, i.e., 500 MeV 800 MeV, see Fig. 6, will be needed. The new facilities for studying high baryon density matter includes (a) Nuclotron-based Ion Collider fAcility (NICA) at the Joint Institute for Nuclear Research (JINR), Dubna, Russia [27], (b) Compressed Baryonic Matter (CBM) at Facility for Antiproton and Ion Research (FAIR), Darmstadt, Germany [28], and (c) CSR External-target Experiment (CEE) at High Intensity heavy-ion Accelerator Facility (HIAF), Huizhou, China [29].
5 Summary and Outlook
The workshop dealt with two topics: Criticality and hadron resonance gas models.
Criticality: A robust and vibrant research program is now established both experimentally (several facilities) and theoretically to study the QCD phase structure [30] and seeking for the QCD critical point in the phase diagram. The observables are well established and the results from a first systematic measurements are promising.
Thermal models: Another success story has been use of hadron resonance gas models to extract freeze-out dynamics, provide evidences for local thermalisation in heavy-ion collisions and act as baseline for several measurements in heavy-ion collisions. This can be extended further to test the details of the model, like GCE vs. CE, and applications to higher order fluctuations to probe true thermal nature of the system formed in heavy-ion collisions [31].
High baryon density: Gradual shift of attention of the heavy-ion
community is expected towards a return to the low energy collisions, where
state-of-art accelerator facility with large luminosity and much advances detector systems
with excellent particle identification will allow us to
unravel the physics of a rotating high baryon density QCD matter
subjected to magnetic field, similar to the neutron stars.
A̱cknowledgments F. Karsch, V. Koch, A. Pandav, and K. Redlich for exciting discussions. We also thank the colleagues from STAR and ALICE collaborations. B.M. was supported in part by the Chinese Academy of Sciences President’s International Fellowship Initiative and J C Bose Fellowship from Department of Science of Technology, Government of India. N.X. was supported in part by the Chinese NSF grant No.11927901 and the US DOE grant No.KB0201022.
References
- [1] STAR Internal Note - SN0493, 2009.
- [2] Bazavov, A. et al., Phys. Rev. D96, 074510 (2017).
- [3] Bazavov, A. et al., Phys. Rev. D95, 054504 (2017).
- [4] Fukushima, K. and Hatsuda, T., Rept. Prog. Phys. 74, 014001 (2011).
- [5] A. Andronic, P. Braun-Munzinger, K. Redlich and J. Stachel, Nature 561 (2018) no.7723, 321-330.
- [6] R. Hagedorn and K. Redlich, Z. Phys. C 27 (1985), 541.
- [7] L. Ahle et al. [E866 and E917], Phys. Lett. B 476 (2000), 1-8.
- [8] L. Ahle et al. [E-802 and E-866], Phys. Rev. C 60 (1999), 044904.
- [9] L. Ahle et al. [E866 and E917], Phys. Lett. B 490 (2000), 53-60.
- [10] S. V. Afanasiev et al. [NA49], Phys. Rev. C 66 (2002), 054902.
- [11] C. Alt et al. [NA49], Phys. Rev. C 77 (2008), 024903.
- [12] L. Adamczyk et al. [STAR], Phys. Rev. C 96 (2017) no.4, 044904.
- [13] J. Randrup and J. Cleymans, Phys. Rev. C 74 (2006), 047901.
- [14] J. Cleymans, H. Oeschler, K. Redlich and S. Wheaton, Phys. Lett. B 615 (2005), 50-54.
- [15] M. Gazdzicki and M. I. Gorenstein, Acta Phys. Polon. B 30 (1999), 2705.
- [16] B. I. Abelev et al. [STAR], Phys. Lett. B 673 (2009), 183-191.
- [17] J. Adam et al. [STAR], Phys. Rev. C 102 (2020) no.3, 034909.
- [18] G. Agakishiev et al. [HADES], Phys. Rev. C 80 (2009), 025209.
- [19] Y. Hatta and M. A. Stephanov, Phys. Rev. Lett. 91 (2003), 102003 [erratum: Phys. Rev. Lett. 91 (2003), 129901].
- [20] M. A. Stephanov, Phys. Rev. Lett. 102 (2009), 032301.
- [21] J. Adam et al. [STAR], [arXiv:2001.02852 [nucl-ex]].
- [22] M. A. Stephanov, Phys. Rev. Lett. 107 (2011), 052301.
- [23] P. Garg, D. K. Mishra, P. K. Netrakanti, B. Mohanty, A. K. Mohanty, B. K. Singh and N. Xu, Phys. Lett. B 726 (2013), 691-696.
- [24] A. Bhattacharyya, S. Das, S. K. Ghosh, R. Ray and S. Samanta, Phys. Rev. C 90 (2014) no.3, 034909.
- [25] P. Braun-Munzinger, B. Friman, K. Redlich, A. Rustamov and J. Stachel, [arXiv:2007.02463 [nucl-th]].
- [26] K. Fukushima, B. Mohanty and N. Xu, [arXiv:2009.03006 [hep-ph]].
- [27] N. S. Geraksiev [NICA/MPD], J. Phys. Conf. Ser. 1390 (2019) no.1, 012121.
- [28] T. Ablyazimov et al. [CBM], Eur. Phys. J. A 53 (2017) no.3, 60.
- [29] S. Ruan, J. Yang, J. Zhang, G. Shen, H. Ren, J. Liu, J. Shangguan, X. Zhang, J. Zhang and L. Mao, et al. Nucl. Instrum. Meth. A 892 (2018), 53-58.
- [30] S. Gupta, X. Luo, B. Mohanty, H. G. Ritter and N. Xu, Science 332 (2011), 1525-1528.
- [31] S. Gupta, D. Mallick, D. K. Mishra, B. Mohanty and N. Xu, [arXiv:2004.04681 [hep-ph]].