Analyzing Epistemic and Aleatoric Uncertainty for Drusen Segmentation in Optical Coherence Tomography Images
Abstract
Age-related macular degeneration (AMD) is one of the leading causes of permanent vision loss in people aged over 60 years. Accurate segmentation of biomarkers such as drusen that points to the early stages of AMD is crucial in preventing further vision impairment. However, segmenting drusen is extremely challenging due to their varied sizes and appearances, low contrast and noise resemblance. Most existing literature, therefore, have focused on size estimation of drusen using classification, leaving the challenge of accurate segmentation less tackled. Additionally, obtaining the pixel-wise annotations is extremely costly and such labels can often be noisy, suffering from inter-observer and intra-observer variability. Quantification of uncertainty associated with segmentation tasks offers principled measures to inspect the segmentation output. Realizing its utility in identifying erroneous segmentation and the potential applications in clinical decision making, here we develop a U-Net based drusen segmentation model and quantify the segmentation uncertainty. We investigate epistemic and aleatoric uncertainty capturing model confidence and data uncertainty respectively. We present segmentation results and show how uncertainty can help formulate robust evaluation strategies. We visually inspect the pixel-wise uncertainty and segmentation results on test images. We finally analyze the correlation between segmentation uncertainty and accuracy. Our results demonstrate the utility of leveraging uncertainties in developing and explaining segmentation models for medical image analysis.
Introduction
Age-related macular degeneration (AMD) is a retinal disease leading to permanent vision loss among the aged population worldwide. Early detection of AMD plays a vital role in limiting the disease progression. Drusen - protein or lipid deposits that usually accumulate between Bruch’s membrane and retinal epithelium layer - is a key biomarker that can indicate early developments of AMD. There are efforts aimed at detecting drusen in fundus and optical coherence tomography (OCT) images (Peng et al. 2019; Saha et al. 2019), however, most have focused mainly on the volumetric classification of drusen, categorizing it into different size (Keenan et al. 2020). There are also some effort in classification of AMD based on absence or presence of any pathology (Antony, Maetschke, and Garnavi 2019). A challenging and rarely attempted task is the precise segmentation a.k.a pixel-wise classification of the drusen in OCT images. This segmentation task is particularly challenging due to the drusen appearing in varied sizes and shapes, its resemblance to noise which is commonly present in OCT, as well as the low contrast.
Segmentation is ubiquitous in many areas of medical imaging. Over the years, convolutional neural networks (CNN) and its variations like U-Net (Ronneberger, Fischer, and Brox 2015; Li et al. 2018) have shown promising results on many medical images. However, deep learning algorithms applied to different segmentation tasks in medical imaging have not enjoyed the same level of success as natural images. The primary reason for such an impediment is the difficulty of having access to a large amount of high-quality labelled data. Annotating medical images is costly as it often requires the expertise of clinicians. In ambiguous cases, even expert annotations can be inconsistent, resulting in noisy annotations. The model will produce inaccurate segmentation when trained using such limited and noisy data. Quantification of uncertainties associated with the segmentation output is therefore important to determine the region of possible incorrect segmentation, e.g., region associated with higher uncertainty can either be excluded from subsequent analysis or highlighted for manual attention.
Epistemic and aleatoric uncertainty are two major types of uncertainty that one can quantify in Bayesian deep learning (Der Kiureghian and Ditlevsen 2009; Kendall and Gal 2017). Epistemic uncertainty captures the uncertainty in the model parameters due to the lack of knowledge about the underlying model that generated the given data. In contrast, aleatoric uncertainty captures noise inherent in the input data. While the epistemic uncertainty can be reduced by collecting more training data, aleatoric uncertainty can not be explained away by having more data (Kendall and Gal 2017).
The literature on uncertainty quantification in the context of diagnosing AMD mainly aim at analyzing the epistemic uncertainty for the relatively easier task of segmenting the retinal layers in OCT images (Sedai et al. 2019; Seeböck et al. 2019). We believe no work in the literature has attempted the task of quantifying and analyzing both the epistemic and aleatoric uncertainty associated with segmenting the drusen in OCT images. Hence, there exists a gap in the literature on developing a segmentation model for detecting drusen and quantifying the uncertainty towards building a robust system for early diagnosis of AMD.
In this quest, we develop a U-Net (Li et al. 2018) based segmentation framework for detecting the drusen in OCT images on a benchmark dataset. We model the segmentation uncertainty using both epistemic and aleatoric uncertainty measures. We evaluate the generalization performance of the model for drusen segmentation. We further show the utility of segmentation uncertainty in evaluating the model on specific regions of test images. We visualize the drusen segmentation and pixel-wise uncertainty measures on test images. We conclude by analyzing the association between segmentation uncertainty and accuracy. Our results demonstrate that both epistemic and aleatoric uncertainty helps to explain the erroneous region of drusen segmentation at test-time.
Drusen Segmentation and Uncertainty Quantification
Having only a limited number of labelled data - which is often the reality of developing deep learning models in medical applications - we augment the training set by introducing different patches containing drusen from a single image. We create the patches by cropping an image with windows of sizes 128, 192, and 256. This technique of lowering the resolution of the image also helps us to avoid resizing the images to preserve important aspects of the pathologies. To be consistent with the training data, we also generate patches from test data by using a window of size 128.
We use a standard U-Net (Li et al. 2018) model with the encoder-decoder architecture. Both the encoder and decoder have four blocks wherein each block in the encoder comprises of four convolutional units followed by batch normalization (Ioffe and Szegedy 2015) and leaky rectified linear unit (Maas, Hannun, and Ng 2013). We use skip connections (Drozdzal et al. 2016) between the output of the encoder blocks and input of the decoder blocks. In the final layer, we use a convolution layer with channel number equal to the number of classes and a softmax activation function. In our U-Net architecture, we use spatial dropout (Tompson et al. 2015) before every convolutional layer. We train the model and subsequently compute the segmentation and uncertainty maps.
We compute the pixel-wise epistemic uncertainty using Monte-Carlo dropout (Gal and Ghahramani 2016) which characterizes the dropout regularization (spatial dropout in our model) as a variational Bayesian inference problem. The Monte-Carlo dropout (Gal and Ghahramani 2016) quantifies the uncertainty by having stochastic forward passes during inference where the dropout is enabled at each pass. For a given class and pixel in an input image, we obtain the output by averaging the softmax probabilities over multiple forward passes as,
| (1) |
where denotes each forward pass, denotes the weights of the model after applying dropout at pass and is the training dataset. We use in our experiments.
Quantifying the variations in the predictions by augmenting data at test-time is a simple yet effective strategy for estimating aleatoric uncertainty (Ayhan and Berens 2018). Motivated by this, we quantify the pixel-wise aleatoric uncertainty for drusen segmentation using test-time augmentation. During inference, we feed the model with transformations of the input image generated using different augmentation techniques to obtain probability distribution over the predictions. Similar to epistemic, we average the softmax probabilities over multiple transformations as,
| (2) |
where denotes the transformation operation at and is the model weight. The reverse transformation is only applied in case of geometrical augmentation techniques like rotation. Additionally, is an identity operation for image processing based transformations like blurring. The current work uses randomized augmentation techniques that include adjusting brightness, contrast, blurring and rotation of the images.
We evaluate the uncertainty for a pixel using the entropy of predictive probability distribution as,
| (3) |
where is the average of softmax probabilities computed using Equations (1) and (2) for epistemic and aleatoric methods respectively. Similarly, we compute the average segmentation uncertainty of drusen as,
| (4) |
where is the number of pixels that satisfy .
| Methods | Large | Medium | Small | ||||||
|---|---|---|---|---|---|---|---|---|---|
| Dice | Precision | Recall | Dice | Precision | Recall | Dice | Precision | Recall | |
| no-uncertainty | 0.72 | 0.83 | 0.67 | 0.65 | 0.71 | 0.61 | 0.55 | 0.63 | 0.51 |
| epistemic | 0.72 | 0.84 | 0.65 | 0.64 | 0.72 | 0.58 | 0.53 | 0.68 | 0.48 |
| aleatoric | 0.73 | 0.83 | 0.67 | 0.64 | 0.71 | 0.6 | 0.54 | 0.64 | 0.5 |
| epistemic-thresholded | 0.8 | 0.93 | 0.72 | 0.71 | 0.85 | 0.64 | 0.57 | 0.75 | 0.5 |
| aleatoric-thresholded | 0.8 | 0.91 | 0.74 | 0.71 | 0.82 | 0.63 | 0.57 | 0.72 | 0.5 |
Results
We conduct experiments on a benchmark dataset that is publicly available (Farsiu et al. 2014). The dataset consists of OCT volumes for 269 subjects diagnosed with AMD and 115 normal subjects. We extract 286 images from the 143 AMD OCT volumes by sampling B-scans which have visible drusen. We then obtain the expert annotations for the drusen in all the images. We create a training set with images sampled from 70% of the subjects and use the remaining for validation. We augment the training data by flipping the images horizontally and rotating them. We evaluate the model on a holdout test dataset. To gain more insights into the generalization performance of the model across varied sizes of drusen, we divide the images into large, medium, and small based on the size of drusen.


In Table 1, we report the generalization performance of the following instances of a U-Net model: a, with no uncertainty estimation, b, with epistemic uncertainty, and c, with aleatoric uncertainty. The evaluation metrics include dice, precision and recall scores. All the methods achieve similar performance. While the models perform reasonably well on images containing large drusen, they struggle to segment medium and small-sized drusen. These results confirm the difficulty of the drusen segmentation task.
We now devise an evaluation strategy by utilizing the fact that higher uncertainty can imply less confidence in model predictions. We thus evaluate the model only on certain regions of the image by excluding the pixels where the segmentation uncertainty is larger than a certain threshold. We record these results in the last two rows of the Table 1. This evaluation strategy reveals a significant improvement in the model performance which is reflected across different metrics in Table 1. On average, this evaluation method has excluded 2-3% of pixels that reported higher uncertainty. Such an evaluation strategy can essentially help us avoid evaluating the model on noisy regions (either poor-quality data or annotation inconsistencies) of the image.
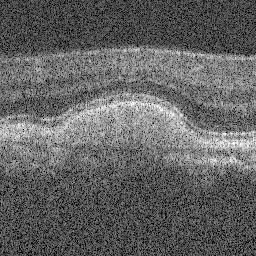
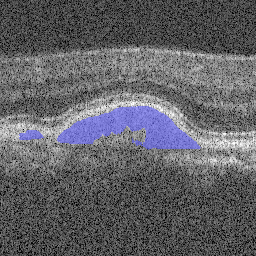
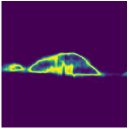
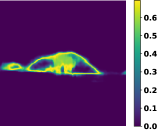
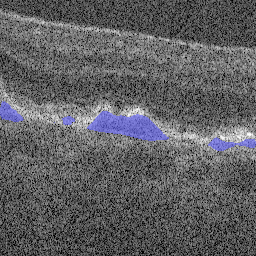
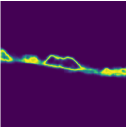
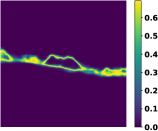
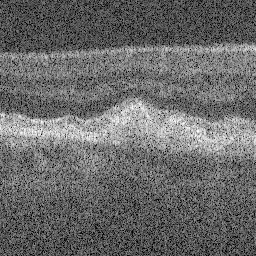
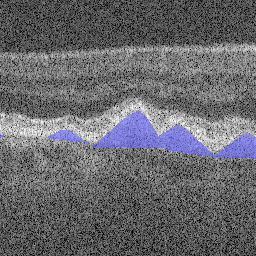
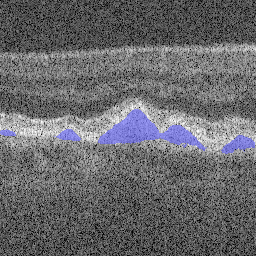
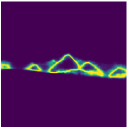
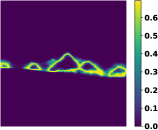
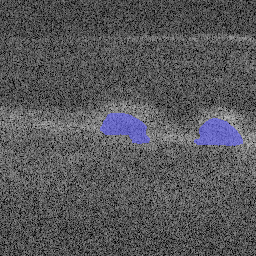
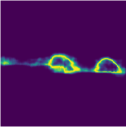
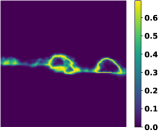
We visualize the drusen segmentation and pixel-wise epistemic and aleatoric uncertainty in Figure 1 along with the input test images and ground truth labels. As one would expect the segmentation uncertainties are higher along the borders of the drusen. Figure 1 shows that segmentation uncertainty is relatively high for the small-sized drusen compared to larger ones. Figure 1 also reveals that the segmentation uncertainty can detect erroneous segmentation by producing higher uncertainty in those regions. Moreover, epistemic and aleatoric uncertainty differs in some regions of the image implying they represent different aspects of the model and data. These results outline the utility of uncertainty quantification methods in identifying segmentation inconsistencies at test-time.
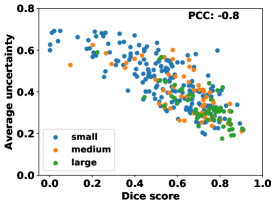
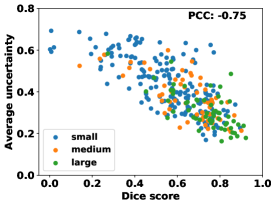
We now analyze the correlation between average segmentation uncertainty and dice scores. We compute the Pearson correlation coefficients between segmentation uncertainty and dice score and visualize the results in Figure 2. The results show that the segmentation uncertainty exhibits strong negative linear correlation with dice score where lower uncertainties are associated with images having higher scores and vice versa. This analysis also explains the poor performance of the model on medium and small-sized drusen where both the epistemic and aleatoric uncertainty exhibits strong negative correlation with dice scores. Figure 2 further illustrates that the uncertainty, in general, can help explain incorrect drusen segmentation irrespective of their size. From the correlation plots and coefficients, epistemic uncertainty seems to exhibit stronger negative correlation with accuracy than aleatoric. In short, these results demonstrate that the uncertainty measures can be helpful in providing more insights into model predictions.
Conclusion
This paper presents the results from an initial attempt at tackling the challenging task of segmenting the drusen in OCT images for the early detection of AMD. We investigate the usefulness of quantifying both the epistemic and aleatoric uncertainty in our segmentation task. We evaluate the generalization performance of the segmentation model in detecting large, medium and small-sized drusen. Utilizing the pixel-wise segmentation uncertainty, we show its significance in developing a robust evaluation framework. The visualization of the drusen segmentation and associated uncertainty measures confirm the utility of quantifying uncertainty in inspecting segmentation results at test-time. Our analysis of the relationship between segmentation uncertainty and accuracy reveals a strong negative correlation implying the utility of uncertainty measures in identifying and explaining incorrect segmentation.
On a broader note, clinical machine learning community can benefit from the quantification of uncertainty in building robust and trustworthy models. In particular, it can offer robust ways of evaluating clinical machine learning models and provide additional insights to clinical decision makers as they process the results generated by AI-powered system. It also provides a utility to develop cost-effective training strategies like active learning that can consume the uncertainty measures to selectively sample the training data.
References
- Antony, Maetschke, and Garnavi (2019) Antony, B. J.; Maetschke, S.; and Garnavi, R. 2019. Automated summarisation of SDOCT volumes using deep learning: Transfer learning vs de novo trained networks. Plos one 14(5): e0203726.
- Ayhan and Berens (2018) Ayhan, M. S.; and Berens, P. 2018. Test-time Data Augmentation for Estimation of Heteroscedastic Aleatoric Uncertainty in Deep Neural Networks. In International conference on Medical Imaging with Deep Learning.
- Der Kiureghian and Ditlevsen (2009) Der Kiureghian, A.; and Ditlevsen, O. 2009. Aleatory or epistemic? Does it matter? Structural safety 31(2): 105–112.
- Drozdzal et al. (2016) Drozdzal, M.; Vorontsov, E.; Chartrand, G.; Kadoury, S.; and Pal, C. 2016. The importance of skip connections in biomedical image segmentation. In Deep Learning and Data Labeling for Medical Applications, 179–187. Springer.
- Farsiu et al. (2014) Farsiu, S.; Chiu, S. J.; O’Connell, R. V.; Folgar, F. A.; Yuan, E.; Izatt, J. A.; and Toth, C. A. 2014. Quantitative classification of eyes with and without intermediate age-related macular degeneration using optical coherence tomography. Ophthalmology 121(1): 162–172.
- Gal and Ghahramani (2016) Gal, Y.; and Ghahramani, Z. 2016. Dropout as a bayesian approximation: Representing model uncertainty in deep learning. In international conference on machine learning, 1050–1059.
- Ioffe and Szegedy (2015) Ioffe, S.; and Szegedy, C. 2015. Batch normalization: Accelerating deep network training by reducing internal covariate shift. arXiv preprint arXiv:1502.03167 .
- Keenan et al. (2020) Keenan, T. D.; Chen, Q.; Peng, Y.; Domalpally, A.; Agrón, E.; Hwang, C. K.; Thavikulwat, A. T.; Lee, D. H.; Li, D.; Wong, W. T.; et al. 2020. Deep learning automated detection of reticular pseudodrusen from fundus autofluorescence images or color fundus photographs in AREDS2. Ophthalmology .
- Kendall and Gal (2017) Kendall, A.; and Gal, Y. 2017. What uncertainties do we need in bayesian deep learning for computer vision? In Advances in neural information processing systems, 5574–5584.
- Li et al. (2018) Li, X.; Chen, H.; Qi, X.; Dou, Q.; Fu, C.-W.; and Heng, P.-A. 2018. H-DenseUNet: hybrid densely connected UNet for liver and tumor segmentation from CT volumes. IEEE transactions on medical imaging 37(12): 2663–2674.
- Maas, Hannun, and Ng (2013) Maas, A. L.; Hannun, A. Y.; and Ng, A. Y. 2013. Rectifier nonlinearities improve neural network acoustic models. In Proc. icml, volume 30, 3.
- Peng et al. (2019) Peng, Y.; Dharssi, S.; Chen, Q.; Keenan, T. D.; Agrón, E.; Wong, W. T.; Chew, E. Y.; and Lu, Z. 2019. DeepSeeNet: a deep learning model for automated classification of patient-based age-related macular degeneration severity from color fundus photographs. Ophthalmology 126(4): 565–575.
- Ronneberger, Fischer, and Brox (2015) Ronneberger, O.; Fischer, P.; and Brox, T. 2015. U-net: Convolutional networks for biomedical image segmentation. In International Conference on Medical image computing and computer-assisted intervention, 234–241. Springer.
- Saha et al. (2019) Saha, S.; Nassisi, M.; Wang, M.; Lindenberg, S.; Sadda, S.; Hu, Z. J.; et al. 2019. Automated detection and classification of early AMD biomarkers using deep learning. Scientific reports 9(1): 1–9.
- Sedai et al. (2019) Sedai, S.; Antony, B.; Rai, R.; Jones, K.; Ishikawa, H.; Schuman, J.; Gadi, W.; and Garnavi, R. 2019. Uncertainty Guided Semi-supervised Segmentation of Retinal Layers in OCT Images. In International Conference on Medical Image Computing and Computer-Assisted Intervention, 282–290. Springer.
- Seeböck et al. (2019) Seeböck, P.; Orlando, J. I.; Schlegl, T.; Waldstein, S. M.; Bogunović, H.; Klimscha, S.; Langs, G.; and Schmidt-Erfurth, U. 2019. Exploiting epistemic uncertainty of anatomy segmentation for anomaly detection in retinal OCT. IEEE transactions on medical imaging 39(1): 87–98.
- Tompson et al. (2015) Tompson, J.; Goroshin, R.; Jain, A.; LeCun, Y.; and Bregler, C. 2015. Efficient object localization using convolutional networks. In Proceedings of the IEEE conference on computer vision and pattern recognition, 648–656.