Optical coherence and energy-level properties of a Tm3+-doped LiNbO3 waveguide at sub-Kelvin temperatures
Abstract
We characterize the optical coherence and energy-level properties of the 795 nm 3H6 to 3H4 transition of Tm3+ in a Ti4+:LiNbO3 waveguide at temperatures as low as 0.65 K. Coherence properties are measured with varied temperature, magnetic field, optical excitation power and wavelength, and measurement time-scale. We also investigate nuclear spin-induced hyperfine structure and population dynamics with varying magnetic field and laser excitation power. Except for accountable differences due to difference Ti4+ and Tm3+-doping concentrations, we find that the properties of Tm3+:Ti4+:LiNbO3 produced by indiffusion doping are consistent with those of a bulk-doped Tm3+:LiNbO3 crystal measured under similar conditions. Our results, which complement previous work in a narrower parameter space, support using rare-earth-ions for integrated optical and quantum signal processing.
I Introduction
Rare-earth-ion-doped crystals (REICs) cooled to cryogenic temperatures offer several exceptional properties for optical and radio-frequency processing tasks that range from amplifier development to quantum signal manipulation Liu and Jacquier (2006); Macfarlane and Shelby (1987). These properties include desirable energy-level structures and population dynamics, long-lived optical and spin coherence, as well as their ability to be integrated on a chip Thiel et al. (2011); Tittel et al. (2010). Of the many crystals that can host REIs, LiNbO3 is attractive due to its transparency at optical wavelengths, high second-order nonlinearity, and ability to be modified to allow optical guiding, among other properties Weis and Gaylord (1985). These attributes underpin the use of LiNbO3 for several optical applications, including modulators that are used by the telecommunication industry Wooten et al. (2000).
An early study of an ensemble of Tm3+ ions in a Ti-indiffused LiNbO3 waveguide (Tm3+:Ti4+:LiNbO3) at 3 K demonstrated properties that were inferior to those measured in a Tm3+-doped LiNbO3 bulk crystal under similar conditions Sinclair et al. (2010). This difference was attributed to the perturbation of Tm3+ ions by Ti4+, which is used to raise the index of refraction of LiNbO3 for waveguiding. However, a study of Tm3+:Ti4+:LiNbO3 at 0.8 K revealed a tenfold improvement of properties compared to those measured at 3 K, matching those of a Tm3+-doped bulk LiNbO3 crystal under similar conditions Sinclair et al. (2017). Here we complement this study by measuring detailed coherence properties, population dynamics and sub-level structure of the 3H6 to 3H4 transition of a Tm3+:Ti4+:LiNbO3 waveguide at temperatures as low as 0.65 K.
More precisely, using two- and three-pulse photon echo techniques, we measure coherence properties with varied laser excitation power and wavelength, temperature, magnetic field, and measurement time-scale Liu and Jacquier (2006); Moerner and Bjorklund (1988); Macfarlane and Shelby (1987). We then characterize excited-level population dynamics and lifetimes using spectral hole burning. We also quantify nuclear spin-induced hyperfine energy level structure under the application of a magnetic field and with varying laser wavelength. The hyperfine structure is probed further by coherent excitation and emission of light. Finally, we quantify the dependence of spectral hole widths and lifetimes on laser excitation power, both of which impact the suitability of Tm3+:Ti4+:LiNbO3 for the aforementioned applications.
Overall, we find equivalent properties to those measured using a 0.1%-doped Tm3+:LiNbO3 bulk crystal at temperatures of less than 1 K except for accountable differences due to different Ti4+- and Tm3+-doping concentrations. Our results are relevant for integrated quantum and classical light processing, and clarify how properties of REIs are affected by crystal modification and measurement conditions in the technologically-significant LiNbO3 material system.
II Experimental methods
Measurements are carried out using a 15.7 mm-long Tm3+:Ti4+:LiNbO3 waveguide. It is created by raising the index of refraction of a 4 m-wide strip by thermally indiffusing Ti into a 0.9 mm-thick, up to 0.7% Tm3+-indiffused, lithium niobate crystal wafer. More details regarding the composition and fabrication of the waveguide can be found in Ref. Sinclair et al. (2017). The crystal is mounted inside an adiabatic demagnetization refrigerator on an oxidized Cu stage and held down by a Macor lid that is attached to the Cu stage by spring-tensioned Ti screws. The Cu stage is mounted on an Au-coated Cu plate that is attached to a magnetically-shielded GGG paramagnetic salt pill that generates temperatures as low as 0.65 K by adiabatic demagnetization. The temperature is measured on the Macor lid using RuOx thermoelectric sensors. Light is directed into, and out of, the waveguide by butt-coupling single-mode fiber at around 800 nm wavelength to the waveguide end facets. Each fiber is mounted on a three-axis nanopositioning stage to optimize the efficiency of the butt-coupling. Transmission through the entire cryogenic setup is 10-20% due to imperfect overlap between the spatial modes of the fiber and the waveguide, reflections from uncoated surfaces, and imperfect fiber splices. Magnetic fields of up to 20 kG are applied parallel to the c-axis of the crystal using a superconducting solenoid. The magnetic field strength is determined using a Hall sensor mounted directly above the Macor lid.
We employ a continuous-wave external-cavity diode laser with an output power of up to 50 mW, an estimated linewidth of a few hundred kHz over millisecond timescales, and producing linearly-polarized light oriented approximately normal to the c-axis of the crystal (sigma polarization). The laser operating wavelength is tuned between 791 and 798 nm (vac.) by a diffraction grating that forms part of the laser cavity and monitored using a HeNe-referenced wavemeter featuring an accuracy better than 1 GHz. A 400 MHz acousto-optic modulator is used to produce pulses as short as 50 ns for photon echo measurements, or as long as 100 ms for hole burning and spectral tailoring of the absorption profile of the transition. Spectral features are probed by varying the laser detuning through serrodyne modulation using a standard 20 GHz-bandwidth LiNbO3 phase modulator for frequency sweeps of MHz. A field-effect-transistor wired in parallel with the laser diode is used for frequency sweeps of MHz. The laser power is varied from 1-10 mW for coherent transient (e.g. photon echo) measurements. It is kept at 1 mW for creating spectral features in order to avoid power broadening.
Optical transmission is detected using a 1 GHz (2 MHz) AC (DC)-coupled amplified diode for photon echo (spectral tailoring-based) measurements and digitized using a 3 GHz digital oscilloscope. In cases where it is undesired, persistent spectral hole burning Moerner and Bjorklund (1988); Macfarlane and Shelby (1987) is mitigated by continuously varying the laser frequency over several GHz in tens of seconds using the diffraction grating. Moreover, we record photon echoes of largest intensities to further avoid spectral hole burning during photon echo excitation measurements. For all other measurements, we average over many repetitions of the same experiment to minimize errors due to laser power fluctuations, frequency jitter, and noise.
III Results
III.1 Optical coherence properties
Frequency-selective modification of the lineshape of an inhomogeneously-broadened transition of an ensemble of REIs is necessary for many optical processing applications Tittel et al. (2010); Thiel et al. (2011). The maximum spectral resolution of the modification is ultimately determined by the homogeneous linewidth of the transition, which is inversely-proportional to the coherence lifetime Mims (1968). Accordingly, decoherence can be interpreted as a broadening of the homogeneous linewidth Macfarlane and Shelby (1987). This broadening is due to a time-varying detuning of the transition frequency of each REI due to dynamic perturbations caused by the lattice or neighboring ions Liu and Jacquier (2006). These perturbations depend on the REIC and the experimental conditions used in the measurement. Thus, to better understand the nature of coherence in Tm3+:Ti4+:LiNbO3, we quantify as a function of laser excitation power and wavelength, temperature, magnetic field, and measurement time scale (i.e. we perform time-dependent spectral diffusion).
III.1.1 Wavelength dependence
The large inhomogeneous linewidth of REIs in crystals is one of their unique features, which allows broadband or spectrally-multiplexed light-matter interactions Macfarlane and Shelby (1987); Tittel et al. (2010). Therefore, we quantify the inhomogeneous lineshape and probe optical coherence at various wavelengths to determine the bandwidth for which coherence properties are invariant. This lineshape may be determined using the Beer-Lambert relation in units of optical absorbance . At 0.9 K, we generate a weak laser pulse, direct it into the waveguide, and detect its intensity at the output as a function wavelength of the laser light. The laser is then tuned to an operating wavelength of 800 nm, off-resonant from the Tm3+ transition, and the intensity of the weak pulse is recorded to yield the absorption lineshape (Fig. 1, circles).
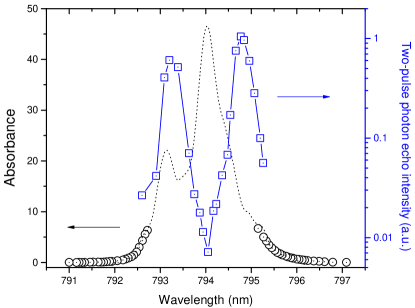
Note that the absorbance between 793 and 795 nm is too high to resolve the profile. This is expected due to the large oscillator strength of Tm3+:Ti4+:LiNbO3, waveguide length, and doping concentration Sinclair et al. (2010); Thiel et al. (2010); Sun et al. (2012); Thiel et al. (2012a). To compliment the measured data, Fig. 1 also shows a absorbance profile (dotted line) measured using a 0.1%-doped Tm3+:LiNbO3 bulk crystal under similar conditions Sun et al. (2012) that has been vertically scaled by a factor of two. This absorbance profile predicts a high between 793 and 795 nm for the waveguide while the scaling factor suggests an effective doping concentration of 0.2%, which is consistent with the results of Ref. Sinclair et al. (2010). Future measurements using a shorter sample or a lower Tm3+ concentration will allow better characterization of the optical lineshape of Tm3+:Ti4+:LiNbO3. Nonetheless, our measurements unambiguously reveal for wavelengths between 795 and 797 nm, which is within the zero-phonon line Macfarlane and Shelby (1987); Liu and Jacquier (2006) and hence suitable for efficient and broadband signal processing.
We now characterize wavelength-dependent decoherence at 0.9 K using two-pulse photon echos. Specifically, two pulses, each separated by a time duration of , are directed into the waveguide and, due to the coherent response of the ions, a photon echo is produced a time later Mims (1968). The intensity of the echo is described by Sun et al. (2012); Thiel et al. (2012b)
| (1) |
Re-absorption inhibits observation of an echo in the presence of high optical absorbance (). Therefore, using a 20 kG magnetic field, we generate a 300 MHz-wide spectral pit of reduced optical absorbance by optically pumping Tm3+ ions to long-lived nuclear-hyperfine levels (see Sec. III.2.2) Macfarlane and Shelby (1987); Sinclair et al. (2016). To avoid stimulated decay of population in the 3H4 excited level, we wait 5 ms, which is an order of magnitude longer than the 100 s lifetime of this level (see Sec. III.2.1), and perform two pulse photon echo excitation for a fixed and varied wavelength to determine (Fig. 1, squares).
Our optical pumping sequence is performed with maximum laser power for all measurements, resulting in a varying residual absorbance as a function of wavelength at the bottom of the spectral pit. Yet this absorbance is still high () for wavelengths around 794 nm where we expect maximum absorbance. Accordingly, is reduced for wavelengths around 794 nm likely due to re-absorption rather than reduced Sun et al. (2012), an effect that is not taken into account in Eq. 1. Consequently, we are unable to accurately determine using Eq. 1. Note that was found to be invariant over 300 GHz of bandwidth around 794.5 nm using bulk Tm3+:LiNbO3 at 1.6 K Sun et al. (2012). Nonetheless, we observe photon echoes over 100 GHz of bandwidth, suggesting coherence over this range.
As a last step, we vary the laser power and detuning to generate a spectral population grating Macfarlane and Shelby (1987); Sinclair et al. (2017) instead of a spectral pit. After a time delay of 5 ms, we generate a laser pulse that scatters from the grating to produce an echo 200 ns later. This protocol is similar to three-pulse photon echo excitation (see Sec. III.1.5) Macfarlane and Shelby (1987). We repeat this procedure at various wavelengths, finding that the intensity of the echo varies with wavelength similar to that of the two-pulse photon echos shown in Fig. 1. This suggests that the coherence properties along with the underlying level structure and dynamics are suitable for wide-band optical processing.
III.1.2 Temperature dependence
Phonon interactions are a fundamental cause of decoherence of REIs Liu and Jacquier (2006). Therefore, temperature-dependent measurements are critical for determining the limitations of coherence properties of REICs. Here we tune the laser operating wavelength to 795.0 nm and measure as a function of temperature by measuring the decay of two-pulse photon echo intensities as the time delay between the two excitation pulses is varied. This wavelength is used to ensure strong light-matter interaction without the reduction of signal intensity due to reabsorption. This and similar wavelengths are also used for several other measurements in this work (e.g. photon echo excitation and hole burning) for the same reasons. The echo intensity is measured and fit using the Mims expression
| (2) |
where is the echo intensity at , and is an empirical parameter determined by spectral diffusion (also discussed in Secs. III.1.3 and III.1.5) Mims (1968). At 4 K the decay is exponential (i.e. ), indicating that it is dominated by phonon scattering Liu and Jacquier (2006); Sun et al. (2012), with kHz. However, at lower temperatures the decay becomes non-exponential (Fig. 2, circles).
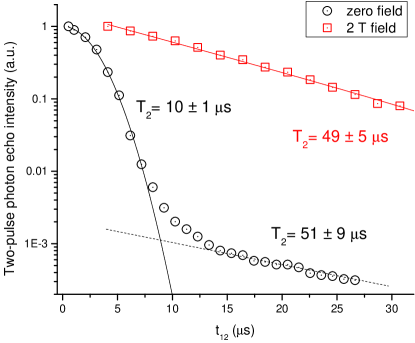
The initial part of the decay shows a time-dependent increase of decoherence due to spectral diffusion (indicated by a black line in Fig. 2), while the later part of the decay becomes again exponential – a characteristic of motional narrowing (dotted line in Fig. 2) Liu and Jacquier (2006); Thiel et al. (2010); Sun et al. (2012). The motional narrowing regime, in which the accumulated dephasing is reduced due to spins flipping back to their original state, is distinguished by the lack of time-dependent spectral diffusion. The time at which motional narrowing appears suggests a spectral diffusion rate of 100 kHz, which is similar to that measured using bulk Tm3+:LiNbO3 at 1.7 K and a wavelength of 794.26 nm Thiel et al. (2010); Sun et al. (2012). The decay for s is used for the temperature-dependent characterization and, from fits to Eq. 2, the temperature-dependent homogeneous linewidth is determined (Fig. 3).
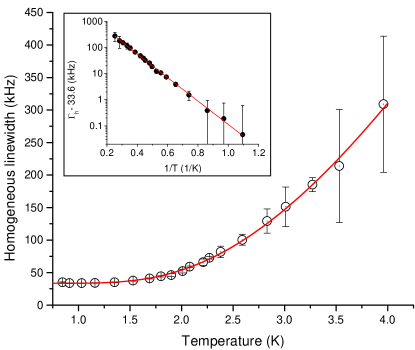
We expect to be limited by direct phonon excitation to a higher-lying crystal field level in the ground state manifold Liu and Jacquier (2006); Sun et al. (2012):
| (3) |
where is the homogeneous linewidth at zero temperature, is the phonon coupling coefficient, is the phonon energy, is temperature, and is the Boltzmann constant. A fit of Eq. 3 to the data in Fig. 3, yields an intrinsic linewidth of kHz, agreeing with the 30 kHz predicted from measurements of a bulk Tm3+:LiNbO3 crystal at a wavelength of 794.26 nm Sun et al. (2012). We also find cm-1 and MHz. The former agrees well with the ground-state crystal field splitting of 7.2 cm-1 of bulk Tm3+:LiNbO3 while the latter is three times higher than the 1.1 MHz observed using the bulk crystal at 795.01 nm Sun et al. (2012). This supports our previous observation of non-ideal coherence properties of Tm3+:Ti4+:LiNbO3 compared to bulk Tm3+:LiNbO3 at 3 K Sinclair et al. (2010). The large phonon coupling may be due to the higher, up to 0.7%, doping concentration of Tm3+:Ti4+:LiNbO3 compared to 0.1%-doped bulk Tm3+:LiNbO3 Thiel (2019). Since for all of our measurements, exhibits an exponential dependence with respect to (Fig. 3 inset, the fit using Eq. 3 is also shown).
III.1.3 Magnetic field dependence
Decoherence beyond that induced by direct phonon-ion interactions is due to spectral diffusion. This may be caused by fluctuating fields within the host crystal that are generated by dynamic interactions between host spins or impurities Liu and Jacquier (2006). Spectral diffusion results in a broadening of the measured homogeneous linewidth because each ion experiences a slightly-different dynamic environment. A magnetic field is expected to reduce the impact of spectral diffusion by increasing the energy-splitting between magnetic levels beyond the phonon energy, inducing spin polarization and reducing the number of spin flips Liu and Jacquier (2006). Furthermore, the applied field reduces decoherence through the ’frozen core’ effect in which the large magnetic moment of REIs create a localized magnetic field gradient that inhibits spin flips of nearby nuclear spins, creating a spin diffusion barrier Shelby et al. (1978). Spectral diffusion is expected due to coupling between Tm3+ and 93Nb, 7Li, other Tm3+, and possibly Ti4+ nuclear spins in Tm3+:Ti4+:LiNbO3 Thiel et al. (2010); Sun et al. (2012); Thiel et al. (2012a).
We apply a magnetic field of 20 kG and measure a two-pulse photon echo decay at a temperature of 0.89 K and wavelength of 795.0 nm. We find an exponential decay that is free of time-dependent spectral diffusion (Fig. 2, squares), consistent with Tm3+:LiNbO3 bulk crystal measurements at a wavelength of 794.26 nm Thiel et al. (2010); Sun et al. (2012). Moreover, fitting this decay using Eq. 2 reveals a coherence lifetime of s, which is consistent with the s observed in the motional narrowing regime of the zero field data. We attribute the reduction of coherence lifetimes compared to the 117 s reported in Ref. Sinclair et al. (2017) to non-zero excitation-induced decoherence during our measurement (see Sec. III.1.4 for an analysis of this effect).
To further investigate magnetic field-dependent decoherence, we measure two-pulse photon echo decays for varying magnetic fields at a temperature of 0.86 K and fit the decays using Eq. 2 to determine (Fig. 4).
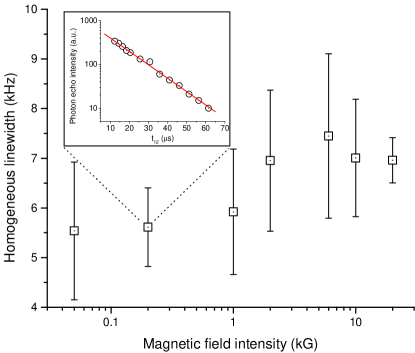
For reliable fits, we perform echo decays for s when echo modulation has diminished (see Sec. III.2.3). We find little field dependence and that 100 G of field is enough to achieve coherence properties comparable to that of the zero-field motional narrowing regime. Note that we observe a similar field dependence when performing the measurement using three times less excitation power in order to avoid the impact of excitation-induced spectral diffusion.
III.1.4 Excitation-induced spectral diffusion
One source of spectral diffusion is due to optical excitation. Its effect on reducing coherence lifetimes is referred to as instantaneous spectral diffusion (ISD) Liu et al. (1987); Thiel et al. (2014). As REIs are excited, the change in their permanent electric dipole moment perturbs the resonance frequencies of neighboring ions via electric dipole interactions. Consequently, the coherence lifetime that is inferred from a two-pulse photon echo decay may be underestimated if intense excitation pulses are employed. To determine the limitations of the coherence lifetime due to ISD, we set the temperature to be between 0.81 and 0.89 K and measure two-pulse photon echo decays at a wavelength of 795.6 nm with varying excitation powers and magnetic fields of 300 G and 20 kG. The echo decays are fit using Eq. 2, and we observe that the homogeneous linewidth rises with excitation power until saturation (Fig. 5).
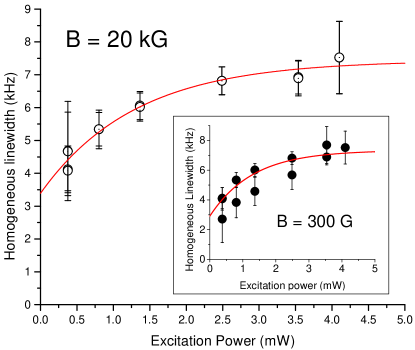
This behavior is supported by the following rate equation model for ISD:
| (4) |
where is the homogeneous linewidth at zero excitation power, is the full-width at half maximum spectral broadening due to ISD and is a constant Thiel et al. (2014). A fit of our data using this model yields kHz ( kHz) and kHz ( kHz) for the measurements at 300 G (20 kG) field, consistent with values reported in Ref. Thiel et al. (2014). The constant is related to a parameter that only depends on the strength and the nature of the ion-ion interaction. It is intrinsic to the material. For our measurements, may be estimated using
| (5) |
where is the radius of waveguide mode, is the optical excitation wavelength, is the absorption coefficient and is the duration of the excitation pulse Thiel et al. (2014). The waveguide features m and cm-1 at nm, and we employ excitation (-)pulses of duration ns. This yields Hzcm3 ( Hzcm3) for the 300 G (20 kG) data, which is consistent with the Hzcm3 measured using bulk Tm3+:LiNbO3 at 1.7 K and a wavelength of 794.27 nm Thiel et al. (2014). Note that the effects of ISD could not be quantified at zero field due to a weak photon echo intensity. Furthermore, varying amounts of ISD are measured at different wavelengths around 795.6 and 794.2 nm, consistent with observations using bulk Tm3+:LiNbO3 Thiel (2019). This suggests more complicated ion-ion or spin-spin interactions that go beyond the model discussed here Thiel et al. (2012a, 2014), and should be addressed in future work.
III.1.5 Time-dependent spectral diffusion with magnetic field
In the presence of a magnetic field, spectral diffusion is known to occur over timescales longer than the maximum value of 50 s used for our two pulse photon echo excitation measurements Liu and Jacquier (2006); Macfarlane and Shelby (1987). Since many optical signal processing applications using REIs rely on spectral features being created and probed over long timescales Thiel et al. (2011); Tittel et al. (2010); Macfarlane and Shelby (1987), we study spectral diffusion on such timescales. Towards this end, we use three-pulse photon echos at magnetic fields of 300 G and 20 kG. Specifically, we generate two pulses that are separated by a time duration of to create a population grating. Here, this grating is formed by optical pumping and trapping of population in the 3H4, nuclear-hyperfine, or superhyperfine levels (see Secs. III.2.1, III.2.2, and III.2.3). A third pulse, generated after the second pulse, is scattered from the grating to produce a photon echo of intensity
| (6) |
where is the time-dependent homogeneous linewidth, is a normalization constant, and represents the reduction in echo intensity due to population decay Böttger et al. (2006). For Tm3+:Ti4+:LiNbO3 at low temperatures and under magnetic fields, , where each are constants and s is the population lifetime of the 3H4 level, ms is the bottleneck level population lifetime (see Sec. III.2.1), and s is the population lifetime of the hyperfine levels (see Secs. III.2.2 and III.2.3). All lifetimes are much longer than .
Specifically, at temperature of 0.80 K, a wavelength of 795.3 nm, and using a magnetic field of 300 G, we vary , and fit the echo decay using Eq. 2 () to determine up to s (Fig. 6, triangles).
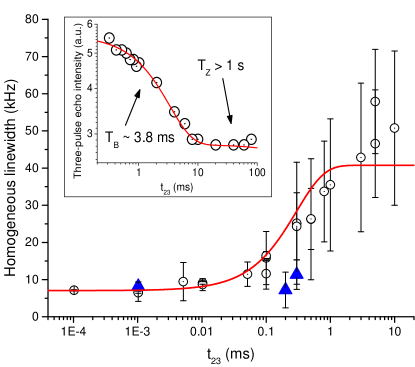
We find that spectral diffusion is negligible over the entire measurement timescale. An 8 kHz homogeneous linewidth is observed, which is consistent with the magnetic field-dependent results presented in Fig. 4 given the strong ISD present during the measurement, and represents a slight improvement over the 10 kHz measured using bulk Tm3+:LiNbO3 at 1.7 K and 794.26 nm wavelength, perhaps due to lowered temperature Sun et al. (2012); Thiel et al. (2010, 2012a).
Next, we increase the field to 20 kG and repeat the measurement at 0.95 K (Fig. 6, circles). We find a linewidth that grows to 50 kHz after 10 ms, indicating a small rate of nuclear spin flips in the host, which may be due to the frozen core effect.
To quantify the processes driving spectral diffusion, we fit our data using a spin fluctuation model
| (7) |
where is the homogeneous linewidth at , and is the maximum linewidth broadening due to spin fluctuations at a rate Mims (1968); Böttger et al. (2006); Klauder and Anderson (1962); Mims (1972a). We find kHz, which is consistent with the magnetic field- and excitation power-dependence of shown in Figs. 4 and 5, respectively. Our fit also yields kHz, which is a factor of two larger than that measured using bulk Tm3+:LiNbO3 with zero magnetic field at 1.7 K and 794.26 nm wavelength Sun et al. (2012). Moreover, we also find kHz, which is nearly 40 times smaller than that measured using the aforementioned bulk crystal and experimental conditions Sun et al. (2012). While the reduced spectral diffusion rate is probably due to differences in field and temperature compared to those used for the measurements of bulk Tm3+:LiNbO3, the increased maximum broadening may be due to additional (and not yet understood) dynamics under strong fields, at long timescales, and at this wavelength, which will be explored in future studies.
Note that despite the strong excitation powers used in this measurement, we do not observe the distinct increase (decrease) in decoherence over 1 s 10 s (at 110 s) that was observed using bulk Tm3+:LiNbO3 at a wavelength of 794.27 nm and zero magnetic field Thiel et al. (2012a, 2014). This decoherence was ascribed to the magnetic character of the 3H4 multiplet and population decay of these levels. The strong magnetic field and low temperature used here likely inhibits these magnetic interactions by spin polarization.
To examine the effects of spectral diffusion beyond timescales of 10 ms, we perform three pulse photon echo excitation and measure the echo intensity with varied from 0.2 to 100 ms for fixed ns (Fig. 6 inset). A fit using Eq. 6 reveals that the echo intensity depends only on with (since ), ms and s. Our fit suggest that for ms, remains constant and any reduction in echo intensity is solely due to population decay from the hyperfine levels. This is consistent with the model of Eq. 7 to describe the spectral diffusion dynamics in which the homogeneous linewidth saturates at long time delays.
III.2 Population dynamics and energy level structure
In addition to long coherence lifetimes of the optical transition, long-lived energy levels are required to realize optical technology with REIs Liu and Jacquier (2006); Macfarlane and Shelby (1987); Thiel et al. (2011). For instance, these levels are used as a population reservoir for spectral tailoring of diffraction gratings or quantum memories. Therefore, we characterize both the energy-level structure and population dynamics of the 3H6 to 3H4 transition of the Tm3+:Ti4+:LiNbO3 waveguide under varying conditions.
III.2.1 Lifetimes and dynamics of excited levels
We perform time-resolved spectral hole burning, in which interaction of a short laser pulse excites a subset of ions and, after a varying time delay , the resultant increase in optical transmission is assessed by varying the laser frequency and measuring the depth of the spectral hole Moerner and Bjorklund (1988); Macfarlane and Shelby (1987). We aim to determine the population lifetimes of the 3H4 excited level () and the 3F4 ‘bottleneck’ level () as shown in the simplified energy level diagram of the inset of Fig. 7 Liu and Jacquier (2006). The 3H5 level has a lifetime much shorter than and cannot be observed in the hole decay. Our measurements are performed at zero field, a temperature of 0.85 K, and at a wavelength of 795.50 nm. Note that, in accordance with the results of Ref. Thiel et al. (2012a), measurements at this wavelength probe ions that experience more local strain or those that occupy multiple sites.
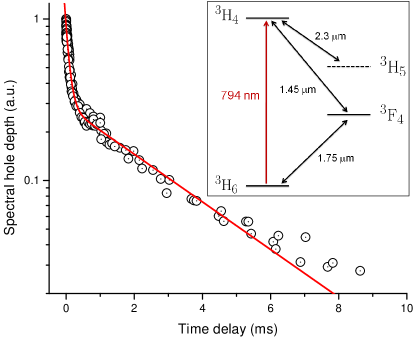
The variation of spectral hole depth with time delay reveals the expected double-exponential (Fig. 7). Note that the hole depth is proportional to the number of excited ions because spectral diffusion has saturated after 10 s. A fit of the decay using
| (8) |
where is the branching ratio to the bottleneck level Sun et al. (2012), revealing s, ms, and a branching ratio .
We find a difference in lifetimes and branching ratio to those measured previously at 795.52 nm and 3.5 K, where s, , and ms is reported Sinclair et al. (2010). We attribute this difference to the possibility of addressing different subsets of ions Sun et al. (2012); Thiel et al. (2012a) or a very weak signal-to-noise ratio that distorted the previous results. Comparing our measured lifetimes with those obtained using bulk Tm3+:LiNbO3 Thiel et al. (2010), where s, , and ms was measured at a wavelength of 794.28 nm, we find shorter lifetimes and a larger branching ratio. This could again be due to the difference in wavelength or, more likely, to a larger doping concentration of Tm3+:Ti4+:LiNbO3. Increased doping enhances the Tm3+-Tm3+ cross-relaxation rate via decay through the 3H5 and 3F4 level Cantelar et al. (2005). For example, measurements using a 2% Tm3+-doped LiNbO3 crystal revealed s and ms Cantelar et al. (2005).
III.2.2 Structure of Tm3+ nuclear-hyperfine levels
We apply a magnetic field and perform spectral hole burning to investigate field-activated atomic-level structure and dynamics Moerner and Bjorklund (1988); Liu and Jacquier (2006). We expect to observe an atomic-level structure that arises from 169Tm hyperfine splitting of the 3H6 and 3H4 levels. This is due to coupling between the nuclear spin and the enhanced electronic magnetic moment, combined with a weaker nuclear Zeeman effect contribution Sun et al. (2012); Thiel et al. (2010). Previous measurements of Tm3+:Ti4+:LiNbO3 have shown these levels to have lifetimes of up to several hours at 795.5 nm and 0.85 K with 600 G field Sinclair et al. (2017), matching that of bulk Tm3+:LiNbO3 measured under similar conditions Sinclair et al. (2013).
Exposing the Tm-doped crystal at non-zero magnetic field to narrow-band laser light will result in one additional pair of side-holes and up to three pairs of anti-holes in the observed transmission spectrum due to population redistribution among the Tm3+ nuclear-hyperfine ground levels Macfarlane and Shelby (1987). The depth of the side-holes and anti-holes depends on the measurement timescale and the relative transition rates between hyperfine levels within the excited and ground manifolds. However, if strong selection rules prevent optical transitions involving a change in the Tm3+ nuclear spin, the spectral hole structure is simplified so that only a single pair of anti-holes appears. Furthermore, if magnetic anisotropy or contributions from magneticially-inequivalent sites exist in the crystal, then holes and anti-holes may be broadened or non-resolvable. Previous work using bulk Tm3+:LiNbO3 indicates that several different Tm3+ sites may be probed at any given excitation wavelength Thiel et al. (2012a); Sun et al. (2012).
We do not immediately resolve anti-holes or side-holes arising from Tm3+ hyperfine splitting at a temperature of 0.85 K and field of 600 G for excitation between 794.26 and 795.50 nm wavelengths. This is likely due to a strong broadening of the (anti-)hole structure or the high optical absorbance at wavelengths close to 794 nm (see Fig. 1). Anti-hole broadening has been observed using bulk Tm3+:LiNbO3 Sun et al. (2012); Thiel et al. (2012a) as well as bulk and waveguiding Er3+:LiNbO3 Askarani et al. (2019, 2020).
To determine the anti-hole structure, we perform a modified hole-burning method. We simultaneously excite narrow-band subsets of ions at laser frequencies referred to as reference () and control () and measure the resulting absorbance spectrum at zero magnetic field (i.e. we burn and measure spectral holes at frequencies of and ). A conceptual example of the absorbance spectrum with non-zero magnetic field depicts exaggerated holes and anti-holes for clarity, where a single pair of anti-holes is ascribed to each hole (Fig. 8a, grey).
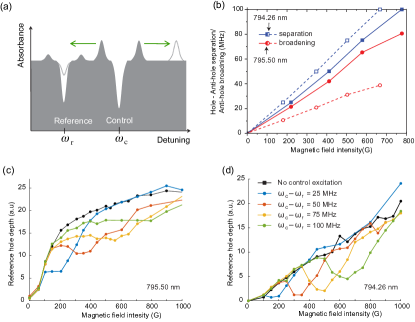
Next, the magnetic field strength is increased to 1 kG while monitoring the shape of the hole at . When the anti-hole generated by the light at begins to spectrally overlap with the hole at , the reference hole depth decreases (Fig. 8a, dotted line). Subsequently, the frequency difference between the two holes, at minimum hole depth, gives the value of the median separation between the hole and anti-hole. Repeating this process for varying frequency differences of gives rise to anti-hole profiles that broaden with increasing field due to spin inhomogeneous broadening (Fig. 8c and d for wavelengths of 795.50 nm and 794.26 nm, at 3.5 K and 0.85 K, respectively).
We determine to vary linearly with field (Fig. 8b), finding kHz/G and kHz/G, for excitation wavelengths of 795.5 and 794.3 nm, respectively. We attribute to the difference between the hyperfine energy splitting in the 3H6 excited level and 3H4 ground level. Our result is consistent with the 140 kHz/G measured directly from field-dependent anti-hole shifts in bulk Tm3+:LiNbO3 at 794.28 nm and 1.8 K, indicating a similar electronically-enhanced effective nuclear moment in the Tm3+:Ti4+:LiNbO3 waveguide Thiel et al. (2010); Sun et al. (2012). The differences in with wavelength is attributed to inequivalent Tm3+ sites Thiel et al. (2012a). In addition, our analysis reveals the anti-holes to be Gaussian-shaped, with an inhomogeneous broadening of and for measurements at wavelengths of 795.50 nm and 794.26 nm, respectively (Fig. 8b). This indicates a variation of splittings in either the ground or excited state, and similar to what was observed using bulk Tm3+:LiNbO3, also likely due to inequivalent Tm3+ sites Thiel et al. (2012a). More studies are needed to determine if this broadening can be reduced or how this limits the applicability of Tm3+:Ti4+:LiNbO3 for broadband signal processing.
III.2.3 Structure of superhyperfine sub-levels
Spectral hole burning measurements. With increased magnetic fields beyond 1 kG, we expect to resolve more holes and anti-holes due to superhyperfine splitting caused by the weak coupling of the ions of the host crystal to the electronic levels of the REIs Macfarlane and Shelby (1987). Superhyperfine ground levels in Tm3+:Ti4+:LiNbO3 can have lifetimes of at least several minutes at 0.85 K for these fields Sinclair et al. (2017), similar to those of bulk Tm3+:LiNbO3 under similar conditions Sinclair et al. (2013). We probe the superhyperfine structure of the 3H4 to 3H6 transition using spectral hole burning at a temperature of 0.90 K, with magnetic fields of up to 19 kG, and at wavelengths of 794.26 nm and 795.46 nm.

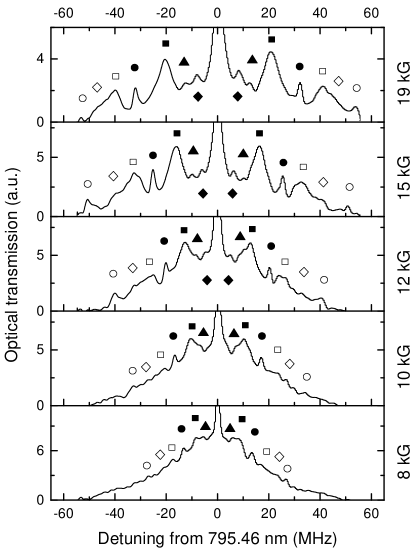
The resultant spectra (Figs. 9 and 10) reveal no distinct anti-hole structure but rather side-holes due to transitions to different superhyperfine levels in the 3H4 excited state Macfarlane and Shelby (1987). To identify the spin transitions that are associated with the side-holes, a linear fit of each set of field-dependent side-hole detunings (relative to the main hole) is performed to determine all effective spin gyromagnetic ratios. We find that the hole structure originates from 6,7Li, 93Nb, and 47,49Ti nuclei in the Ti4+:LiNbO3 crystal. The ascribed nuclei and transitions, indicated by the difference in magnetic quantum number , average gyromagnetic ratios , associated uncertainties from our fits are indicated in Table I (II) for measurements at a wavelength of 794.26 (795.46) nm.
At 794.26 nm, the splittings are distinctive and match well with those observed using bulk Tm3+:LiNbO3 at a similar wavelength Thiel et al. (2009) despite the presence of more spin inhomogeneous broadening or laser-power broadening (see Sec. III.2.4).
At 795.46 nm, the structure is different, likely due to ions experiencing enhanced local strain compared to those probed at 794.26 nm Sun et al. (2012); Thiel et al. (2012a). Side-holes corresponding to transitions of 93Nb and 6,7Li have profiles and detunings that are easily identifiable since they compose the two main lattice constituents, and are similar to those observed from measurements using bulk Tm3+:LiNbO3 Thiel et al. (2009) and the results at 794.26 nm. The remaining side-holes are attributed to the normally forbidden transitions for 93Nb, 7Li, and 47,49Ti spins. Moreover, the 93Nb sideband is split into two – likely corresponding to different relative positions to Tm3+ ions – with relative detunings and areas of the two holes giving a center-of-gravity that is similar to the free-ion gyromagnetic ratio. Further studies, such as spin double-resonance measurements Kispert (1976), are required to fully characterize the nature of the observed superhyperfine splitting and confirm our assignments of spins.
| element | |||
|---|---|---|---|
| 6Li | 1 | 0.57 | 0.03 |
| 93Nb | 1 | 1.11 | 0.05 |
| 7Li | 1 | 1.71 | 0.01 |
| element | |||
|---|---|---|---|
| 47,49Ti | 2 | 0.50 | 0.01 |
| 6Li | 1 | 0.60 | 0.03 |
| 93Nb | 1 | 1.04 | 0.01 |
| 7Li | 1 | 1.65 | 0.01 |
| 93Nb1 | 2 | 1.93 | 0.03 |
| 93Nb2 | 2 | 2.42 | 0.03 |
| 7Li | 2 | 3.31 | 0.01 |
Next, we set the magnetic field to 19 kG and perform spectral hole burning with varying laser wavelength across the inhomogeneous line to further probe variations of the superhyperfine structure (Fig. 11).
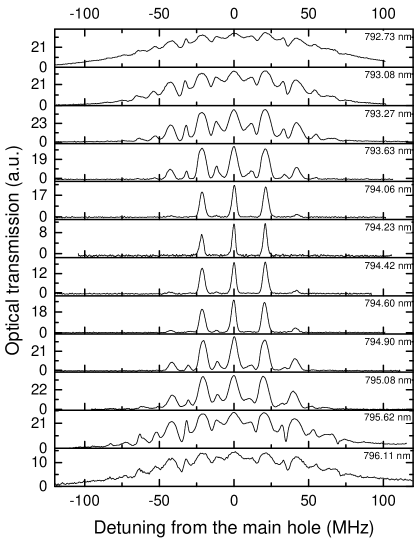
We find that the hole structure varies across the inhomogeneous line, with more complex structure at detunings farthest from 794.2 nm, corresponding to Tm3+ ions that likely experience higher local strain or are positioned in alternative sites Sun et al. (2012); Thiel et al. (2012a).
At 794.23 nm, the hole spectrum is dominated by the 93Nb splitting, similar to that in Fig. 9.
This is likely due to the strong absorbance that limits observation of the other weaker transitions.
Varying the excitation wavelength towards either 794.9 or 793.6 nm increasingly reveals the splittings from 6Li and 7Li as well as the transition of 93Nb.
The side-hole corresponding to 47,49Ti is hidden, owing to power broadening of the holes.
As the detuning is varied more, either to 796.1 or 792.7 nm (addressing ions experiencing higher strain) more side holes than those in Fig. 10 appear.
Although ascribing transitions to these additional holes is challenging without a measurement with varied magnetic field, we tentatively attribute the split side-hole, corresponding to the transition of the 93Nb ion, to different transitions.
Specifically, we ascribe these two holes to the and transitions of 93Nb, acknowledging the limited resolution of Fig. 10.
This new assignment is consistent with the additional side-holes being from the and transitions of 93Nb.
Nevertheless, further studies are required for a complete interpretation of the hole structure.
Photon echo measurements. If a broad optical inhomogeneous distribution obscures transitions that have small differences in energy splitting, such as the superhyperfine levels in our case, then a two-pulse photon echo decay may feature a modulation due to the interference between any of the sublevels Macfarlane and Shelby (1987); Mims (1972b, c). Similarly, echo modulations may be observed in a three-pulse photon echo decay. In the simple case of two doublets with a splitting of in the ground (excited) state, the system is composed of four optical transitions, leading to a two- or three-pulse photon echo decay described by
| (9) |
Here the first part is the Mims decay function of Eq. 2, is the ratio of absorption cross-sections between spins of same or different , and is a modulation function that describes the quantum interference between the four possible optical transitions:
| (10) |
Finally, is the nuclear transition linewidths for the ground (excited) states Mims (1972b, c); Thiel et al. (2010).
We perform two- and three-pulse photon echo decay measurements using 300 G field at a wavelength of 795.5 nm and temperature of 0.65 K. For the latter, was fixed at 300 s. The results are depicted in Fig. 12 (circles and squares, respectively).
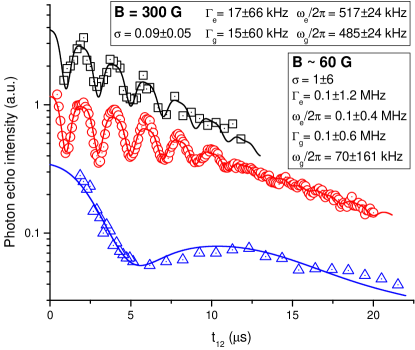
We simultaneously fit both decays using Eq. 9. Our four-transition model describes the observed behavior likely because the transitions are weak and any nuclear quadrupole splitting is very small Thiel et al. (2010). The fit reveals modulation frequencies of 485 24 (51724) kHz that, considering the results presented in Table II, correspond to the splitting of the 7Li nucleus (495 kHz) with a nuclear quadrupole shift of 22 kHz Thiel et al. (2010). Linewidths 1560 (1766) kHz and a cross-section ratio of 0.090.05 are extracted from the fits. All parameters extracted from the fit are consistent with 498 (520) kHz, 18 kHz, and , measured using a Tm3+:LiNbO3 bulk crystal at 1.8 K, a wavelength of 794.26 nm, and the same field Thiel et al. (2010, 2009), which was also ascribed to the same 7Li transition.
Finally, to verify the field-dependence of the modulation, we reduce the magnetic field to 60 G, and measure a two-pulse photon echo decay shown in Fig. 12 using triangles.
For these measurements, the temperature is 0.8 K.
A fit using Eq. 9 yields 70161 (100400) kHz, which is consistent with the measurements using 300 G field.
Note that we do not observe a modulation due to any other superhyperfine transition, consistent with the observation using bulk Tm3+:LiNbO3 at 794.26 nm.
This may be due to similar superhyperfine splittings from different transitions of 7Li in the 3H6 and 3H4 levels, or weak emission from levels split by other nuclear spins Thiel et al. (2010, 2009).
Measurements using continuous coherent excitation. Superhyperfine structure may also be revealed by continuous coherent narrow-band excitation of the optical transition.
Due to inhomogeneous broadening, this results in coherent emission by optical transitions that differ in energies given by the superhyperfine splittings.
This produces a modulation of the transmitted field, sometimes referred to as a quantum beat Haroche et al. (1973).
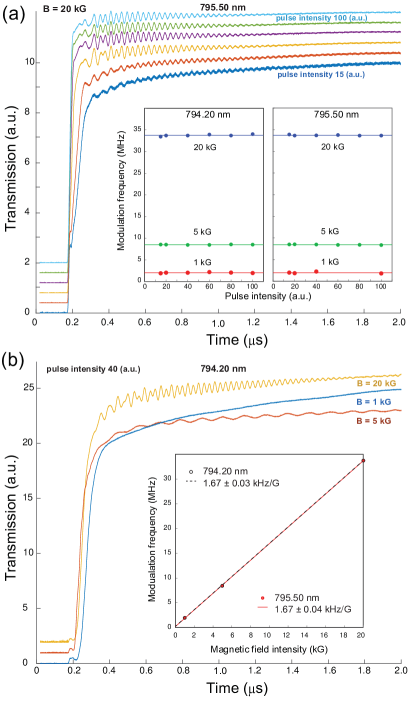
To this end, for two different laser excitation wavelengths, three different magnetic fields, and using varying optical excitation power, we observe the modulation of a long optical pulse after being transmitted through the waveguide. These measurements are performed at 1 K. Figs. 13a and insets show that the modulation is similar for all optical powers. This modulation cannot be related to optical nutation, which is the coherent driving, and hence modulation, of atomic population between optical transitions, which has a rate that is proportional to the square root of the excitation power. Further, we observe the amplitude and periodicity of the modulation at the same magnetic field to be similar for both wavelengths (Figs. 13a and b). As the field is increased, the modulation becomes damped, while the modulation frequency increases and becomes more complex. As shown in the inset of Fig. 13b, fits of the most discernible modulation frequency for both excitation wavelengths reveal a linear and identical dependence with respect to the magnetic field, with a slope of kHz/G and zero offset (within error). The modulation frequency is similar to that observed using photon echoes, and, according to Tables I and II, consistent with the splitting caused by coupling to 7Li. Moreover, the weak intensity of the modulation is consistent with the small absorption cross-sections predicted by the echo data. The damping of the modulation is due to spin inhomogeneous broadening, occurs faster for higher magnetic fields, and is more pronounced at a wavelength of 795.5 nm, consistent with the broadening of the nuclear-hyperfine levels. The additional frequency components of the modulation at high fields could be due to the similar transitions caused by 7Li in the 3H6 and 3H4 levels. However, more measurements are required to evaluate this interpretation.
III.2.4 Excitation-power dependence of spectral hole widths and depths
Spectral tailoring of an optical inhomogeneous line is key to realizing optical applications with REICs such as optical filters or dispersion elements Moerner and Bjorklund (1988); Thiel et al. (2011).
Narrow-band excitation will produce a spectral hole whose depth and width depend not only on the level structure and dynamics, but also on the intensity and the duration of the excitation pulse Moerner and Bjorklund (1988).
Here we investigate the effects of laser power on the widths and depths of spectral holes using the Tm3+:Ti4+:LiNbO3 waveguide.
Power dependence of hole width. Strong laser powers can rapidly drive transitions.
This leads to laser-induced broadening of a spectral hole, an effect referred to as power broadening Maniloff et al. (1995).
To measure power broadening, we perform spectral hole burning at 0.85 K, zero magnetic field, and 795.5 nm wavelength with varying laser power.
Ions are excited using a pulse of 1 ms duration and, by varying the laser detuning after a delay of 400 s, the shape of the spectral hole is measured. The full-width-at-half-maximum width of the hole is fit using a Lorentzian (Fig. 14).
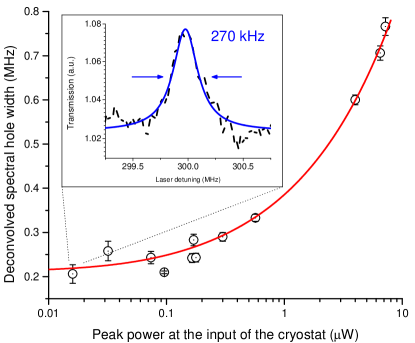
For excitation powers of nW, we observe no power dependence of the hole width, indicating that our narrowest spectral hole width is limited by laser frequency jitter and spectral diffusion. Power broadening increases with excitation power according to
| (11) |
where the initial absorbance of the transition is , is the fitted homogeneous linewidth that includes linewidth broadening due to laser frequency instability, and is proportional to the excitation power Maniloff et al. (1995). We fit our data using Eq. 11, yielding ( which is comparable to the from Fig. 1) and kHz, which, given the 100 kHz laser linewidth, is compatible with the kHz measured using bulk Tm3+:LiNbO3 at 1.7 K and 794.27 nm wavelength Thiel et al. (2010); Sun et al. (2012); Thiel et al. (2014).
Power dependence of hole depth. It is a recurrent observation when spectrally tailoring Tm3+:Ti4+:LiNbO3 that wide spectral features may not be burned to full transparency. This may be due to accumulation of population in near-detuned inhomogeneously broadened hyperfine levels, which results in a reduction of hole depth, or ISD that also results in hole broadening and depth reduction Thiel et al. (2014). However, as described below, we rule out all of these causes and attribute the limitation to spin-lattice relaxation that is induced by laser excitation.
To investigate this effect, we perform the following experiment using a 3 kG field at 3 K and a wavelength of 795.5 nm (Fig. 15a). We consecutively burn two spectral holes, first one at 700 MHz detuning using a fixed excitation power and then one at 0 MHz detuning with varying excitation power, starting with none. The detuning avoids the impact of anti-holes from population accumulation in nuclear-hyperfine levels. After a 2 ms delay, we record the optical absorbance profile and fit the hole depths and widths at the two detunings with varying excitation power used to burn the 0 MHz detuned hole (Figs. 15b, c, d).
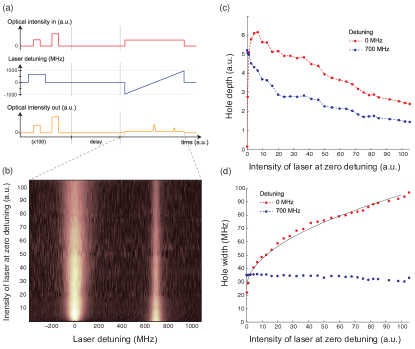
As expected, we observe that the depth of the hole at 0 MHz initially increases as the increased power allows more ions to be optically pumped. However, a further increase in optical power results in a decrease in hole depth. Note that the width of this hole increases with the square-root of the power, as expected from power broadening. Meanwhile, the hole at 700 MHz detuning decreases as soon as optical power is applied to burn the 0 MHz hole. Since the power employed to burn the 700 MHz hole is constant, we do not expect any power broadening of that hole. Specifically, we observe that the width of the hole at 700 MHz detuning is constant with excitation power at 0 MHz detuning. Since the area of the hole at 700 MHz detuning is not conserved, we cannot ascribe the reduction of this hole to ISD. Although its width is increased by power broadening, we expect that the reduction of the hole at 0 MHz detuning also cannot be explained by ISD.
We note that this measurement procedure has also been performed using an Er3+:Ti4+:LiNbO3 waveguide, with similar conclusions (i.e. ruling out population redistribution in hyperfine levels and ISD) Askarani et al. (2020). However, excitation-power dependence of hole depth has not been observed in bulk REI-doped LiNbO3 Thiel (2019), likely because its effect is significantly enhanced by light confinement in a waveguide. Following the discussion in Ref. Askarani et al. (2020), the reduction in hole depth is furthermore not caused by accelerated spin diffusion, i.e. spin flip-flops due to nuclear spin excitation and decay during the burning procedure, and likely not by coupling of laser-excited two-level tunneling systems (TLSs) to nuclear spins as we have not observed any clear signature of TLS in any of our previous (coherence) measurements. Alternatively, spin-lattice relaxation from non-equilibrium phonon dynamics during the laser excitation Liu and Jacquier (2006); Graf et al. (1998), in which phonons are generated due to electron-phonon interactions and the decay of optically-excited levels of REIs, could play a role. Nonetheless, further measurements are needed to clarify the presence of these dynamics, (e.g. using varying laser detuning and magnetic fields) or using laser excitation that is far detuned from the REI transition to determine if the effects are caused by the Ti4+:LiNbO3 crystal itself.
IV Conclusion
We analyzed the coherence and energy-level properties of the 3H6 to 3H4 optical transition of a Tm3+:Ti4+:LiNbO3 waveguide at temperatures as low as 0.65 K, with fields up to 20 kG, over varying measurement timescales as well as laser excitation wavelengths and powers. Complementing our previous work, we characterize properties that limit the performance of this material for optical signal processing applications, shedding light on underlying mechanisms behind important parameters such as optical coherence or hole spectra.
Importantly, we find properties that are consistent with those of a Tm3+:LiNbO3 bulk crystal at temperatures of less than 1 K except for differences that can be explained by Tm3+ or Ti4+-doping concentration. For example, Tm3+-doping appears to impact the temperature-dependence of homogeneous linewidth and reduces the excited-level lifetime compared to that measured in the bulk crystal, while mode confinement provided by Ti4+-doping yields additional side-holes while facilitating strong laser intensities that enhance the spin-lattice relaxation rate of the hyperfine levels. Still, some properties could not be compared because they were not measured in the bulk crystal, e.g. time-dependent spectral diffusion using a 20 kG field or wavelength-dependent superhyperfine structure.
Our study indicates that REIs retain their properties when the crystal is co-doped for integrated applications, thereby establishing new directions for optical signal processing in this widely-used electro-optic crystal.
V Acknowledgments
We thank M. George, R. Ricken and W. Sohler for fabricating the waveguide, and to M. Hedges, H. Mallahzadeh, T. Lutz, L. Veissier, C. Deshmukh, and M. Falamarzi Askarani for discussions. We acknowledge funding through the Natural Sciences and Engineering Research Council of Canada (NSERC), Alberta Ministry for Jobs, Economy and Innovation’s Major Innovation Fund on Quantum Technology, Alberta Innovates Technology Futures (AITF) research program, Defense Advanced Research Projects Agency (DARPA) Quiness program (Contract No. W31P4Q-13-1-0004), National Science Foundation (NSF) under award nos. PHY-1415628 and CHE-1416454, NSF Science and Technology “Center for Integrated Quantum Materials” under Cooperative Agreement No. DMR-1231319, Department of Energy/High Energy Physics QuantISED program grant, QCCFP (Quantum Communication Channels for Fundamental Physics), award number DE-SC0019219, AQT Intelligent Quantum Networks and Technologies (INQNET) research program, and the Dutch Research Council (NWO).
References
- Liu and Jacquier (2006) G. Liu and B. Jacquier, Spectroscopic properties of rare earths in optical materials, vol. 83 (Springer Science & Business Media, 2006).
- Macfarlane and Shelby (1987) R. M. Macfarlane and R. M. Shelby, in Modern Problems in Condensed Matter Sciences (Elsevier, 1987), vol. 21, pp. 51–184.
- Thiel et al. (2011) C. W. Thiel, T. Böttger, and R. L. Cone, Journal of Luminescence 131, 353 (2011).
- Tittel et al. (2010) W. Tittel, M. Afzelius, T. Chaneliere, R. L. Cone, S. Kröll, S. A. Moiseev, and M. Sellars, Laser & Photonics Reviews 4, 244 (2010).
- Weis and Gaylord (1985) R. S. Weis and T. K. Gaylord, Applied Physics A 37, 191 (1985).
- Wooten et al. (2000) E. L. Wooten, K. M. Kissa, A. Yi-Yan, E. J. Murphy, D. A. Lafaw, P. F. Hallemeier, D. Maack, D. V. Attanasio, D. J. Fritz, G. J. McBrien, et al., IEEE Journal of Selected Topics in Quantum Electronics 6, 69 (2000).
- Sinclair et al. (2010) N. Sinclair, E. Saglamyurek, M. George, R. Ricken, C. La Mela, W. Sohler, and W. Tittel, Journal of Luminescence 130, 1586 (2010).
- Sinclair et al. (2017) N. Sinclair, D. Oblak, C. W. Thiel, R. L. Cone, and W. Tittel, Physical Review Letters 118, 100504 (2017).
- Moerner and Bjorklund (1988) W. E. Moerner and G. C. Bjorklund, Persistent spectral hole-burning: science and applications, vol. 1 (Springer, 1988).
- Mims (1968) W. B. Mims, Physical Review 168, 370 (1968).
- Thiel et al. (2010) C. W. Thiel, Y. Sun, T. Böttger, W. R. Babbitt, and R. L. Cone, Journal of Luminescence 130, 1598 (2010).
- Sun et al. (2012) Y. Sun, C. W. Thiel, and R. L. Cone, Physical Review B 85, 165106 (2012).
- Thiel et al. (2012a) C. W. Thiel, Y. Sun, R. M. Macfarlane, T. Böttger, and R. L. Cone, Journal of Physics B: Atomic, Molecular and Optical Physics 45, 124013 (2012a).
- Thiel et al. (2012b) C. W. Thiel, W. R. Babbitt, and R. L. Cone, Physical Review B 85, 174302 (2012b).
- Sinclair et al. (2016) N. Sinclair, K. Heshami, C. Deshmukh, D. Oblak, C. Simon, and W. Tittel, Nature Communications 7, 13454 (2016).
- Thiel (2019) C. W. Thiel, private communication (2019).
- Shelby et al. (1978) R. M. Shelby, C. S. Yannoni, and R. M. Macfarlane, Physical Review Letters 41, 1739 (1978).
- Liu et al. (1987) G. K. Liu, M. F. Joubert, R. L. Cone, and B. Jacquier, Journal of Luminescence 38, 34 (1987).
- Thiel et al. (2014) C. W. Thiel, R. M. Macfarlane, Y. Sun, T. Böttger, N. Sinclair, W. Tittel, and R. L. Cone, Laser Physics 24, 106002 (2014).
- Böttger et al. (2006) T. Böttger, C. W. Thiel, Y. Sun, and R. L. Cone, Physical Review B 73, 075101 (2006).
- Klauder and Anderson (1962) J. R. Klauder and P. W. Anderson, Physical Review 125, 912 (1962).
- Mims (1972a) W. B. Mims, in Electron Paramagnetic Resonance, edited by S. Geschwind (Plenum Press, New York, 1972a).
- Cantelar et al. (2005) E. Cantelar, G. A. Torchia, J. A. Sanz-García, P. L. Pernas, G. Lifante, and F. Cussó, Physica Scripta 2005, 69 (2005).
- Sinclair et al. (2013) N. Sinclair, D. Oblak, C. W. Thiel, R. L. Cone, and W. Tittel (2013), unpublished.
- Askarani et al. (2019) M. F. Askarani, M. G. Puigibert, T. Lutz, V. B. Verma, M. D. Shaw, S. W. Nam, N. Sinclair, D. Oblak, and W. Tittel, Physical Review Applied 11, 054056 (2019).
- Askarani et al. (2020) M. F. Askarani, T. Lutz, M. G. Puigibert, N. Sinclair, D. Oblak, and W. Tittel, Journal of the Optical Society of America B 37, 352 (2020).
- Thiel et al. (2009) C. W. Thiel, Y. Sun, T. Böttger, W. R. Babbitt, and R. L. Cone (2009), 10th International Meeting on Hole Burning, Single Molecule and Related Spectroscopies: Science and Applications.
- Kispert (1976) L. D. Kispert, Electron spin double resonance spectroscopy (Wiley, 1976).
- Mims (1972b) W. Mims, Physical Review B 5, 2409 (1972b).
- Mims (1972c) W. Mims, Physical Review B 6, 3543 (1972c).
- Haroche et al. (1973) S. Haroche, J. A. Paisner, and A. L. Schawlow, Physical Review Letters 30, 948 (1973).
- Maniloff et al. (1995) E. S. Maniloff, F. R. Graf, H. Gygax, S. B. Altner, S. Bernet, A. Renn, and U. P. Wild, Chemical physics 193, 173 (1995).
- Graf et al. (1998) F. R. Graf, A. Renn, G. Zumofen, and U. P. Wild, Physical Review B 58, 5462 (1998).