Spatial segregation impact on star formation in nearby dwarf spheroidal galaxies ††thanks: Based on observations made with the NASA/ESA Hubble Space Telescope, program GO-13442, with data archive at the Space Telescope Science Institute. STScI is operated by the Association of Universities for Research in Astronomy, Inc. under NASA contract NAS 5–26555.
Abstract
Using our HST/ACS observations of the recently found isolated dwarf spheroidal galaxies, we homogeneously measured their star formation histories. We determined star formation rate as a function of time, as well as age and metallicity of the stellar populations. All objects demonstrate complex star formation history, with a significant portion of stars formed 10–13 Gyr ago. Nevertheless, stars of middle ages (1–8 Gyr) are presented. In order to understand how the star formation parameters influence the evolution of dSphs, we also studied a sample of nearest dSphs in different environment: isolated ( Mpc); beyond the Local Group virial radius (but within the Local Group zero velocity sphere); and the satellites of M 31 located within the virial zone (300 kpc). Using archival HST/ACS observations, we measured their star formation histories. A comparative analysis of the parameters obtained allow us to distinguish a possible effect of the spatial segregation on the dSphs evolution scenario.
keywords:
galaxies: dwarf – galaxies: stellar content – (galaxies:) Local Group – galaxies: evolution – galaxies: individual (KKR 25, KKs 03, KK 258, And XVIII, Tucana, Cas dSph, And XXVIII, And XXIX)1 Introduction
A morphological type dependence of a galaxy on its distance to a central object in galaxy groups and clusters is well known for a long time (the distance–morphology relation phenomenon). Oemler (1974) and Dressler (1980) have found a well defined relationship between local galaxy density and galaxy type in rich clusters. This relationship indicates an increasing of elliptical and SO galaxy population, and a corresponding decrease of spiral galaxy number with increasing density. Clusters rich in spirals, in turn, demonstrate an irregular distribution and low mass density, lack of concentration towards the centre and no signs of segregation by mass or morphological type of galaxies. Obvious signs of the same behaviour are noticeable in the galaxy groups closest to us. In our Local Group (LG), for example, there are clearly visible concentrations of dwarf spheroidal (dSph) galaxies, the satellites of the Milky Way and Andromeda (M 31) within their virial radii (see Fig. 7 in the paper of Makarova et al. (2017) and references therein). This fact may serve as an indication that the main mechanism of gas loss and star formation quenching in dwarf galaxies of the Local Group is associated with the proximity of the central galaxy.
 |
 |
 |
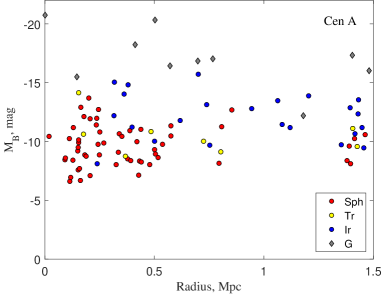 |
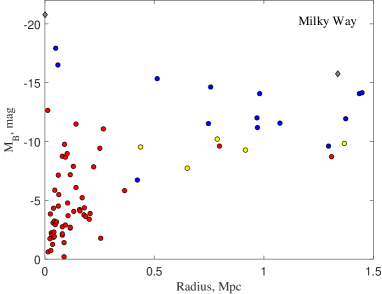
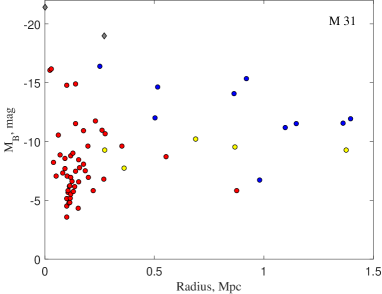
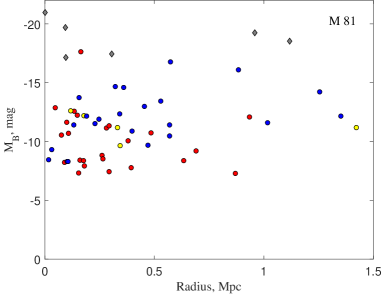
Figure 1 shows the distribution of the absolute magnitudes of galaxies corrected for Galactic and internal extinction with the distance of a galaxy from the central object in the group for the four nearest groups: a subgroup of our Galaxy (Milky Way), the Andromeda (M 31) subgroup, M 81 group and Centaurus A group, taking into account morphological type of galaxies. The concentration of dwarf spheroidal galaxy satellites within about 300 kpc from the centre of the group is clearly visible. The distance of about 300 kpc roughly corresponds to the virial radius (Klypin et al., 2002), and 1 Mpc is related to the zero-velocity sphere radius (Karachentsev et al., 2009). Dwarf irregular galaxies and transitional type galaxies are distributed more or less evenly within the groups.
At the same time, not all dwarf spheroidal satellites in the groups are located within 300 kpc from the host galaxy (see Fig. 1). There are individual dSphs located at a distance from to Mpc from the centre of the group, i.e. some of these systems may be actually spatially isolated. It is obvious that the gas loss and star formation quenching mechanisms in these galaxies should be different and not related to the interaction with the central galaxy of the group (Rocha et al., 2012; Teyssier et al., 2012).
One of the great advantages of the study of dwarf galaxies in nearby groups (within about 10–12 Mpc) is a possibility to resolve these objects into individual stars, including red giant branch (RGB) and fainter stars. Size of such galaxies is usually small, and the structure is relatively simple, which simplify the task of detailed study of their star formation histories (SFHs). Dwarf galaxies of the Local Group and its immediate environment (within 1–2 Mpc from us) are especially promising. These objects can be resolved into stars, including red clump (RC) of the red giant branch at the Hubble Space Telescope (HST) with relatively small exposures. Considerable efforts has been made to determine SFHs of dwarf galaxies in our Milky Way Group and M 31 group of galaxies. Only in the last few years we can note a number of large studies of satellite dwarf spheroidal galaxies (see, for example, Skillman et al. (2017), Martin et al. (2017), Kirby et al. (2020)). Different samples presented in these researches drive our attention to possible quenching time for the dSphs, role of reionization epoch and the environmental influence (e.g. Bullock & Boylan-Kolchin (2017)).
In this paper we present detailed stellar photometry and comparative star formation history for a sample of 8 dwarf spheroidal galaxies of the Local Group. The galaxy images were obtained at the HST with ACS (Advanced Camera for Surveys). We have selected objects located at different distances within the Local Group and its vicinity. Our aim is to provide uniform processing and stellar photometry of images, as well as homogeneous star formation history measurements, to get the possibility of a comparative study of the dwarf spheroidal galaxy evolution and possible star formation quenching mechanisms.
2 Dwarf spheroidal galaxy sample selection
Dwarf spheroidal galaxies located outside the zero velocity radius of the Local Group have come to the focus of our attention in recent years. We have discovered and studied a number of such objects, including the extremely isolated ones (Makarov et al., 2012; Karachentsev et al., 2014, 2015; Makarova et al., 2017). Most of these galaxies were observed with the HST/ACS in the framework of the programs 12546 and 13442. The next important step to study possible mechanisms of evolution and star formation quenching of nearby dSphs is the selection of a test sample of such dwarf galaxies of the Local Group, located at different distances from the gravitational centre of the group, which have archival data from the HST and ACS/WFPC2 cameras. The data obtained with the same instruments, similar exposures, and processed uniformly, allow us to intercompare the details of measured star formation history of the dwarfs, without corrections assumed for various data analysis techniques and observational conditions.
At the same time, we cannot avoid in our analysis an important non-uniformity within our sample caused by different distance to the objects under study. With comparable photometric depth less luminous age-sensitive features are visible for closer galaxies. Detailed analysis and tests by Weisz et al. (2011) show systematic uncertainties in SFH caused by difficulties in modelling such features like RGB, horizontal branch and red clump. For deeper colour-magnitude diagrams ( = +1, which correspond to the isolated dwarfs from our sample) the authors report about 40 per cent overestimation of oldest star formation. Good recovering of star formation history has shown for deepest cases, which include MSTO ( = +4), but all our objects are falls in previous photometric limits ( roughly between +1 and +3). Therefore, we would expect, that SFHs measured by us has systematic uncertainties working in the similar way and they are not affect out conclusions. Weisz et al. (2011) also estimated the systematic uncertainties within the last 2 Gyr to be better than 10 per cent at all photometric depths. This result is important for our discussion of quenching time and residual star formation in the selected dSph galaxies.
From the Local Group list (Karachentsev et al., 2013) we have chosen dwarf galaxies with a Holmberg diameter arcmin. This size fits the entire or most of the galaxy into the HST/ACS camera field ( arcmin). We have excluded from our consideration the objects located within 100 kpc from the Milky Way and Andromeda. Obviously for these satellites the influence of the host galaxy dominates in their evolution and star formation, due to the high probability of tidal interaction, which can both sweep the gas out of the dwarf galaxy, thereby causing the star formation quenching, and also induce the formation of tidal dwarf galaxies from filaments of perturbed intergalactic medium (Makarova et al., 2002). The other criteria of our test sample selection simply reflect the availability of HST/ACS exposures with appropriate filters and duration to complement our sample of the isolated dwarf spheroidals (see the references in the beginning of this section). A the same time it it better to restrict our sample by the satellites of the same galaxy for the straightforward comparison of the selected objects evolution.
Thus, 8 dwarf spheroidal (or transitional type) galaxies that are satellites of the neighbouring spiral galaxy M 31, or isolated objects, fall into our sample.
The list of the galaxies and their general parameters are given in Table 1. These data are mainly taken from the LV catalogue 111https://www.sao.ru/lv/lvgdb/ (Karachentsev et al., 2013). The first column of the table shows the name of the galaxy; (2) – equatorial coordinates (J2000); (3) – morphological type; (4) – absolute magnitude in Johnson B filter; (5) - Holmberg diameter (at the level of mag arcsec-2 isophote), in angular minutes; (6) – the distance in Mpc. The distances to isolated galaxies were measured by us using tip of the red giant branch method (TRGB) in the works mentioned above.
The three subsample of the list are indicated in the Table 1: highly isolated dwarfs KKR 25, KK 258 and KKs 03; the dSphs within the zero velocity radius, but outside the virial radius Tucana dwarf and And XVIII; the dSphs within the virial radius of M 31 And XXVIII, Cas dSph and And XXIX.
| Name | R.A. Decl | Type | a26 | ||
|---|---|---|---|---|---|
| (J2000) | mag | ’ | Mpc | ||
| KKR 25 | 161347.7+542215 | dSph | 9.44 | 1.10 | 1.91 |
| KK 258 | 224043.8304758 | dTr | 10.51 | 1.70 | 2.24 |
| KKs 03 | 022443.5733049 | dSph | 10.72 | 2.45 | 2.00 |
| Tucana | 224149.0642512 | dTr | 9.26 | 2.88 | 0.92 |
| And XVIII | 000214.5+450520 | dSph | 8.73 | 1.60 | 1.31 |
| And XXVIII | 223241.2+311258 | dTr | 7.72 | 1.70 | 0.65 |
| Cas dSph | 232631.8+504032 | dSph | 11.76 | 3.02 | 0.82 |
| And XXIX | 235855.6+304520 | dSph | .52 | 2.70 | 0.73 |
3 Stellar photometry
Observations of all studied dwarf galaxies (with the exception of KKR 25) were made with HST/ACS. The observational data are listed in Table 2, where the first column gives a galaxy name; (2) – HST instrument used; (3) – filters; (4) – exposure time we used in our reduction; (5) – total exposure time available for this observational program. We did not use all available data for Tucana, And XXVIII and Cas dSph, as they are not make sense for our purposes (see the discussion on the data sample above in the Section 2); (6) – publication link for the SFH measurements used in the present work; (7) – SFH determined by other authors with HST/ACS or WFPC2 observations.
| Name | Instrument | Filter | Project (PI) | Reference | Other references | ||
|---|---|---|---|---|---|---|---|
| KKR 25 | HST/WFPC2 | F606W | 4800s | 11986 (J. Dalcanton) | Makarov et al. (2012) | Weisz et al. (2011) | |
| F814W | 9600s | 11986 | |||||
| KK 258 | HST/ACS | F606W | 900s | 12546 (R. Tully) | Karachentsev et al. (2014) | ||
| F814W | 900s | 12546 | |||||
| KKs 03 | HST/ACS | F606W | 1200s | 13442 (R. Tully) | Karachentsev et al. (2015) | ||
| F814W | 1200s | 13442 | |||||
| Tucana | HST/ACS | F475W | 2160s | 34560 | 10505 (C. Gallart) | this work | Savino et al. (2019) |
| F814W | 1936s | 30976 | 10505 | ||||
| And XVIII | HST/ACS | F606W | 1100s | 13442 (R. Tully) | Makarova et al. (2017) | Weisz et al. (2019) | |
| F814W | 1100s | 13442 | |||||
| And XXVIII | HST/ACS | F475W | 2636s | 26360 | 13739 (E. Skillman) | this work | Skillman et al. (2017) |
| F814W | 2088s | 20880 | 13739 | ||||
| Cas dSph | HST/ACS | F435W | 4800s | 38400 | 10430 (T. Armandroff) | this work | Weisz et al. (2014) |
| F555W | 4800s | 19200 | 10430 | ||||
| And XXIX | HST/ACS | F606W | 1118s | 13699 (N. Martin) | this work | Weisz et al. (2019) | |
| F814W | 1117s | 13699 |
Initial data reduction of the images was made within the default HST pipeline. We use the DOLPHOT software package by Dolphin (2000)222http://americano.dolphinsim.com/dolphot/ for stellar photometry of resolved stars in all galaxies of the sample. The photometric reduction procedures were made according recipes in the DOLPHOT’s User Guide. For further analysis, we selected only stars of good photometric quality: type=1, a signal-to-noise ratio (S/N) of at least five in both filters and .
We performed photometric tests with artificial stars for the most accurate estimation of photometric errors, incompleteness of photometry and blending of stars in the crowded stellar fields. These tests were carried out for the sample objects using the same photometric procedures. A sufficient number of artificial stars (approximately ten times greater than the number of real measured ones) was generated in the respective range of stellar magnitudes and colour indices, so that the distribution of the restored magnitudes corresponded to the real one.
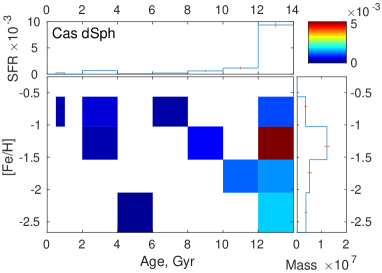
4 Colour–magnitude diagrams
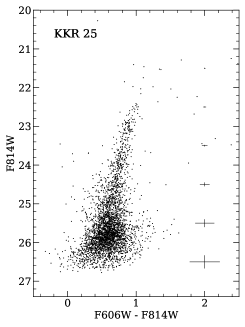
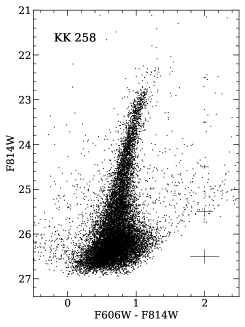
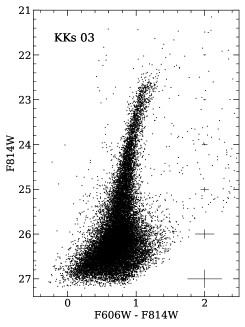
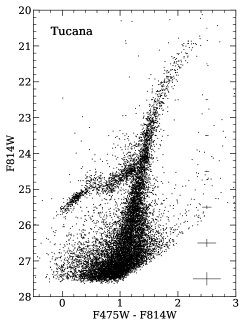
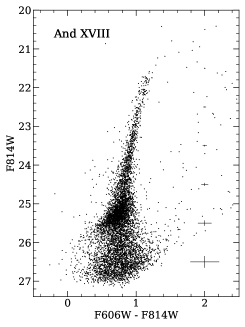
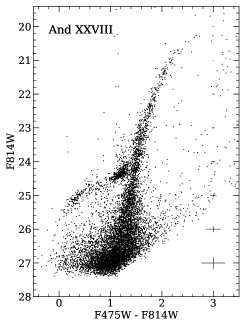
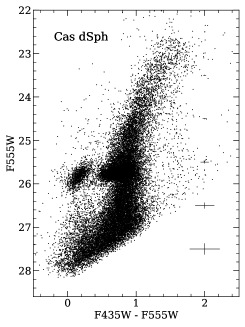
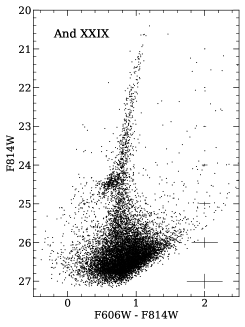
The resulting colour-magnitude diagrams (CMDs) for our sample of galaxies are shown in Fig. 2. Photometric error bars are shown at the right part of each diagram. The photometric limit for all dwarfs is nearly the same (about 27–27.5 mag in filter). The relatively narrow red giant branch (RGB) forms the dominant part of the resolved stellar populations of the studied dwarfs. Certain exception is the brightest galaxy in our sample, Cas dSph, demonstrating a wider scattered RGB, which may indicate a substantial age and/or metallicity spread. One can clearly see the almost complete absence of upper main sequence stars in the CMDs indicating a lack of ongoing star formation in the dSph galaxies. A denser concentration of red clump (RC) stars of a slightly elongated shape is conspicuous in the range of 24–26 mag (26–27 mag for the more distant KK 258 and KKs 03). With the exception of the shallower CMDs of the isolated dSphs KKR 25, KK 258 and KKs 03, the horizontal branch (HB) extending to the left from RC are also visible at the diagrams. The HBs population density of these branches varies significantly for the different sample galaxies.
 |
 |
 |
 |
 |
|
 |
 |
 |
5 Star formation history determination
5.1 The method
Star formation history of the selected dwarf spheroidal galaxies was determined using our StarProbe (Makarov & Makarova, 2004) software package. In the works published for a part of the galaxy sample (see, for example, Makarova et al. (2017)), our technics was described in sufficient detail. Here we briefly describe the basic principles and steps of our calculations.
Observed distribution of stars in a colour-magnitude diagram is a linear superposition of all stars at the various evolutionary stages, which were formed in the galaxy during its life. A number of additional parameters also have a strong influence on this photometric distribution: distance to the object, external and internal extinction, and photometric errors. Accurate photometric distances were estimated for all objects of our sample (see Sect. 2). We also performed highly accurate estimates of photometric errors for all galaxies using extensive tests with artificial stars (see Sect. 3). The Galactic extinction values were taken from Schlafly & Finkbeiner (2011). The internal extinction in dwarf spheroidal galaxies is usually negligible due to lack of gas and regions of active star formation.
Observational data and model data are used in the form of a Hess diagram, which is a two-dimensional histogram representing the number of stars in a certain range (bin) of a magnitude and a colour. Model Hess diagrams are built from theoretical stellar isochrones. Each isochrone corresponds to a specific age and metallicity, and the entire set of these models fits a fairly wide range of ages and metallicities of the stellar populations. The SFH determination comes down to finding of a linear combination of partial model CMDs that approximate the observational data best. We construct the analytical distribution function of stars at the Hess diagram for each isochrone, taking into account initial mass function (IMF), photometric errors, bin size of the Hess diagram, distance modulus and extinction. We use the Padova stellar isochrone calculations made with PARSEC library333http://stev.oapd.inaf.it/cgi-bin/cmd and the Salpeter IMF: . The chosen normalization gives the total integral probability equal to one in the range of 0.1–100 . For a given isochrone, the mass of a star completely determines its observational characteristics and, together with the parameters mentioned above fully determines the probability of a star of the given mass to occur in any bin of the Hess diagram. Individual isochrones of the same metallicity for a given period of time are combined together assuming a constant star formation rate during this period.
To determine SFH, we firstly find the most significant variables (i.e., partial model CMDs) that differ from zero with a given probability. Then we determine values of the significant variables by the maximum likelihood method. Thus, we construct the maximum likelihood function to get the desired solution using well-known minimization algorithms.
5.2 SFH measurement results
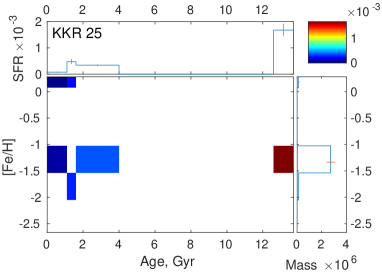
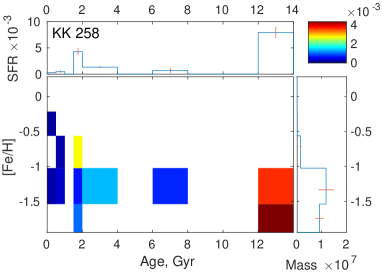
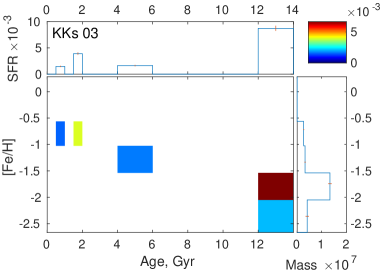
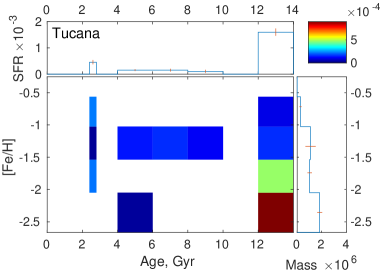
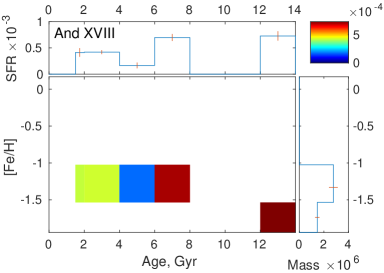
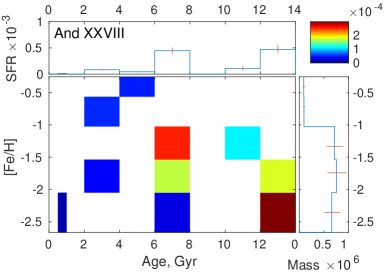
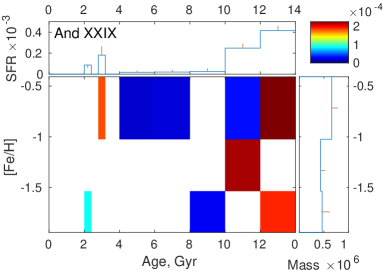
The results of the SFH reconstruction for our sample of galaxies are presented in Fig. 3 and in Table 3. The columns in the Table 3 are: (1) – galaxy name; (2) – metallicity of the SF episode; (3) – mean age of the current SF episode; (4) – mean SFR within the current SF episode, in square brackets there are lower and higher errors of the estimated SFR derived from the computed confidence levels; (4) – current SF episode duration; (5) – total stellar mass of the stars formed in the current SF episode. We have estimated the star formation rate (SFR) and metallicity depending on the age of the stellar populations, as well as the stellar mass formed in each related period of star formation. A number of common trends follows from these results: the star formation has been quenched over the last 1–2 Gyrs which is quite consistent with the morphological type (dSph and dTr) of the studied dwarfs; there is an initial active burst of star formation from about 10–12 to 13.8 Gyrs ago. The fraction of stars formed during this period is different for our objects (we will discuss it below). In addition, there are stars formed about 4–8 Gyrs ago. The periods and intensity of star formation at these ‘middle’ ages can vary significantly from object to object. The metallicity of stars is mostly low, and the metal enrichment during the galaxy life looks insignificant, quite typically for faint dwarf spheroidals (as well as for dwarf irregulars) (e.g. Grebel (2001); Tolstoy et al. (2009)).
 |
 |
 |
 |
 |
 |
 |
 |
| Name | Fe/H | T | SFR | M | |
| Gyr | Gyr | ||||
| KKR 25 | –1.74 | 1.35 | 0.000256 [0.000199– 0.000317] | 0.50 | 1.28e+05 |
| –1.33 | 0.55 | 5.72e-05 [4.18e-05– 7.48e-05] | 1.10 | 6.29e+04 | |
| –1.33 | 2.80 | 0.000342 [0.000312– 0.000372] | 2.40 | 8.20e+05 | |
| –1.33 | 13.15 | 0.00168 [0.00145 – 0.00192 ] | 1.10 | 1.85e+06 | |
| 0.18 | 0.55 | 1.74e-05 [7.25e-06– 3.14e-05] | 1.10 | 1.92e+04 | |
| 0.18 | 1.35 | 0.000222 [0.000153– 0.000297] | 0.50 | 1.11e+05 | |
| KK 258 | –1.74 | 1.75 | 0.000986 [0.000701– 0.00128 ] | 0.50 | 4.93e+05 |
| –1.74 | 13.00 | 0.00433 [0.00355 – 0.00513 ] | 2.00 | 8.66e+06 | |
| –1.33 | 0.25 | 0.000176 [0.000115– 0.000247] | 0.50 | 8.78e+04 | |
| –1.33 | 0.75 | 0.000308 [0.000202– 0.000425] | 0.50 | 1.54e+05 | |
| –1.33 | 1.75 | 0.000612 [0.000273– 0.000968] | 0.50 | 3.06e+05 | |
| –1.33 | 3.00 | 0.00133 [0.00116 – 0.00151 ] | 2.00 | 2.67e+06 | |
| –1.33 | 7.00 | 0.000693 [0.000231– 0.00117 ] | 2.00 | 1.39e+06 | |
| –1.33 | 13.00 | 0.00358 [0.00283 – 0.00438 ] | 2.00 | 7.17e+06 | |
| –0.72 | 0.75 | 0.000169 [1.87e-05– 0.00038 ] | 0.50 | 8.44e+04 | |
| –0.72 | 1.75 | 0.00268 [0.00223 – 0.00316 ] | 0.50 | 1.34e+06 | |
| –0.41 | 0.25 | 0.000107 [6.62e-05– 0.000155] | 0.50 | 5.33e+04 | |
| KKs 03 | –2.36 | 13.00 | 0.00206 [0.00172 – 0.00241 ] | 2.00 | 4.12e+06 |
| –1.74 | 13.00 | 0.00667 [0.00632 – 0.00702 ] | 2.00 | 1.33e+07 | |
| –1.33 | 5.00 | 0.00163 [0.00149 – 0.00176 ] | 2.00 | 3.25e+06 | |
| –0.72 | 0.75 | 0.00147 [0.00136 – 0.00159 ] | 0.50 | 7.37e+05 | |
| –0.72 | 1.75 | 0.00391 [0.0037 – 0.00414 ] | 0.50 | 1.96e+06 | |
| Tucana | –2.36 | 5.00 | 2.1e-05 [7.04e-06– 3.91e-05] | 2.00 | 4.20e+04 |
| –2.36 | 13.00 | 0.000893 [0.000808– 0.000982] | 2.00 | 1.79e+06 | |
| –1.74 | 2.60 | 0.00021 [0.000171– 0.000255] | 0.40 | 8.42e+04 | |
| –1.74 | 13.00 | 0.000466 [0.000385– 0.000552] | 2.00 | 9.32e+05 | |
| –1.33 | 2.60 | 2.09e-05 [5.29e-08– 6.75e-05] | 0.40 | 8.34e+03 | |
| –1.33 | 5.00 | 0.000129 [9.76e-05– 0.000161] | 2.00 | 2.57e+05 | |
| –1.33 | 7.00 | 0.000148 [9.73e-05– 0.000203] | 2.00 | 2.97e+05 | |
| –1.33 | 9.00 | 0.000104 [4.91e-05– 0.000165] | 2.00 | 2.09e+05 | |
| –1.33 | 13.00 | 0.000149 [9.51e-05– 0.000211] | 2.00 | 2.98e+05 | |
| –0.72 | 2.60 | 0.000218 [0.000161– 0.000281] | 0.40 | 8.74e+04 | |
| –0.72 | 13.00 | 8.96e-05 [6.02e-05– 0.000125] | 2.00 | 1.79e+05 | |
| And XVIII | –1.74 | 13.00 | 0.000728 [0.00064 – 0.000819] | 2.00 | 1.46e+06 |
| –1.33 | 1.75 | 0.000411 [0.000332– 0.000495] | 0.50 | 2.06e+05 | |
| –1.33 | 3.00 | 0.000418 [0.000381– 0.000456] | 2.00 | 8.37e+05 | |
| –1.33 | 5.00 | 0.000165 [0.000111– 0.000221] | 2.00 | 3.31e+05 | |
| –1.33 | 7.00 | 0.000697 [0.000631– 0.000765] | 2.00 | 1.39e+06 | |
| And XXVIII | –2.36 | 0.75 | 1.29e-05 [8.44e-06– 1.85e-05] | 0.50 | 6.46e+03 |
| –2.36 | 7.00 | 2.9e-05 [8.02e-06– 5.37e-05] | 2.00 | 5.80e+04 | |
| –2.36 | 13.00 | 0.000298 [0.000245– 0.000354] | 2.00 | 5.95e+05 | |
| –1.74 | 3.00 | 3.67e-05 [2.96e-05– 4.45e-05] | 2.00 | 7.35e+04 | |
| –1.74 | 7.00 | 0.000167 [0.000133– 0.000202] | 2.00 | 3.34e+05 | |
| –1.74 | 13.00 | 0.000175 [0.000122– 0.000234] | 2.00 | 3.50e+05 | |
| –1.33 | 7.00 | 0.00025 [0.000212– 0.000289] | 2.00 | 5.00e+05 | |
| –1.33 | 11.00 | 0.000109 [6.82e-05– 0.000156] | 2.00 | 2.18e+05 | |
| –0.72 | 3.00 | 4.8e-05 [3.78e-05– 5.88e-05] | 2.00 | 9.60e+04 | |
| –0.41 | 5.00 | 4.43e-05 [3.13e-05– 5.88e-05] | 2.00 | 8.85e+04 | |
| Cas dSph | –2.36 | 5.00 | 8.38e-05 [4.12e-05– 0.000133] | 2.00 | 1.68e+05 |
| –2.36 | 13.00 | 0.0017 [0.0015 – 0.00191 ] | 2.00 | 3.41e+06 | |
| –1.74 | 11.00 | 0.00115 [0.000917– 0.00139 ] | 2.00 | 2.30e+06 | |
| –1.74 | 13.00 | 0.00141 [0.00117 – 0.00167 ] | 2.00 | 2.82e+06 | |
| –1.33 | 3.00 | 0.000233 [0.000194– 0.000273] | 2.00 | 4.65e+05 | |
| –1.33 | 9.00 | 0.000605 [0.000415– 0.000807] | 2.00 | 1.21e+06 | |
| –1.33 | 13.00 | 0.00524 [0.00494 – 0.00555 ] | 2.00 | 1.05e+07 | |
| –0.72 | 0.75 | 0.000233 [0.000209– 0.000258] | 0.50 | 1.16e+05 | |
| –0.72 | 3.00 | 0.000442 [0.000389– 0.000499] | 2.00 | 8.85e+05 | |
| –0.72 | 7.00 | 0.0002 [0.000115– 0.000297] | 2.00 | 4.00e+05 | |
| –0.72 | 13.00 | 0.00101 [0.000861– 0.00117 ] | 2.00 | 2.02e+06 | |
| And XXIX | –1.74 | 2.20 | 8.7e-05 [6.04e-05– 8.7e-05 ] | 0.40 | 3.48e+04 |
| –1.74 | 9.00 | 2.57e-05 [2.57e-05– 5.54e-05] | 2.00 | 5.13e+04 | |
| –1.74 | 13.00 | 0.000189 [0.000189– 0.000236] | 2.00 | 3.78e+05 | |
| –1.33 | 11.00 | 0.000216 [0.000216– 0.00026 ] | 2.00 | 4.33e+05 | |
| –0.72 | 3.00 | 0.000181 [0.000181– 0.000266] | 0.40 | 7.22e+04 | |
| –0.72 | 5.00 | 1.71e-05 [1.71e-05– 3.53e-05] | 2.00 | 3.42e+04 | |
| –0.72 | 7.00 | 1.97e-05 [1.97e-05– 4.25e-05] | 2.00 | 3.94e+04 | |
| –0.72 | 11.00 | 3.09e-05 [3.09e-05– 3.49e-05] | 2.00 | 6.17e+04 | |
| –0.72 | 13.00 | 0.000226 [0.000226– 0.000228] | 2.00 | 4.52e+05 |
6 Comparative analysis of the results
We performed comparative analysis of the obtained SFHs of the sample galaxies located at different distances from the Andromeda galaxy. The results of this analysis are presented in Table 4. The first column of the table gives a galaxy name; (2) is the distance from M 31; (3) – the mass of stars formed in the last 2 Gyr, given as a percentage of the total stellar mass; (4) – the mass of stars older than 8 Gyr; (5) – the measured total stellar mass of the galaxy; (6) - SFR in the first 12–13.7 Gyr.
| Name | |||||
|---|---|---|---|---|---|
| Mpc | per cent | per cent | |||
| KKR 25 | 1.930.07 | 11 | 62 | ||
| KK 258 | 0.840.09 | 11 | 70 | ||
| KKs 03 | 2.120.07 | 12 | 74 | ||
| Tucana | 0.920.02 | 0 | 81 | ||
| And XVIII | 0.580.09 | 5 | 34 | ||
| And XXVIII | 0.380.09 | 0 | 50 | ||
| Cas dSph | 0.230.03 | 0.5 | 93 | ||
| And XXIX | 0.200.02 | 0 | 86 |
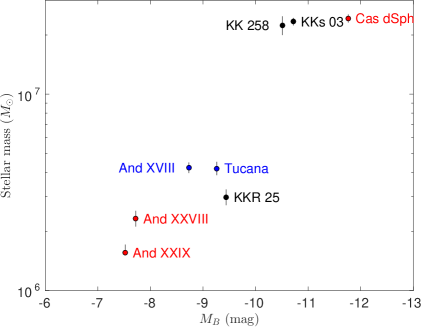
Some relations reflecting star formation activity of our objects are presented in Fig. 4. The upper left panel shows estimated total stellar mass with respect to the absolute stellar magnitude B in filter. The stellar mass range of the studied galaxies is more than the order of magnitude from about to , quite typical for classic nearby dwarfs. Higher stellar masses naturally correspond to brighter galaxies.
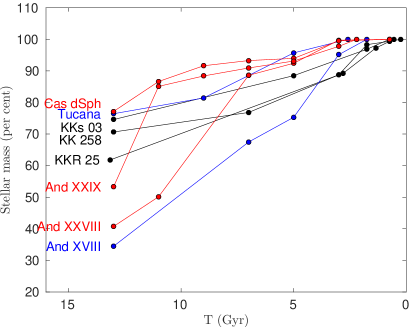
The upper right panel presents the cumulative mass function (growth of the formed stellar mass with time) as a percentage of the total stellar mass of the galaxy. Note that a dwarf galaxy of higher luminosity forms the larger part of the stars (60 per cent) during the initial outburst of star formation ( Gyr ago). An interesting exception is the Tucana dwarf. Following the relation found above, the stellar mass of this galaxy should be higher. Nevertheless, it is known that in the past the object could experience close approach to the central body of the group, and possibly interactions with other dwarfs before its fall on the Local Group. All these processes could cause the loss of stellar mass and material for star formation (Monelli et al., 2010). From the other side, the Holmberg diameter of Tucana can be underestimated (Saviane et al., 1996), and part of the galaxy falls outside the ACS field. In this case the total stellar mass of Tucana dSph should be underestimated. One of the recent detailed SFH determination of the Tucana dSph was performed by Savino et al. (2019) using HST/ACS photometry. The colour-magnitude diagram in this study is deeper than ours, and also the authors put finer scale for their Age–[Fe/H] plane. Nevertheless, the overall star formation periods and the metallicity range of the SFH by Savino et al. (2019) and our measurements are consistent. The initial burst of star formation occurred about 11–14 Gyr ago (12–14 Gyr in the present work), small number of stars continued to form about 6–11 Gyr ago (4–10 Gyr ago) and the residual recent star formation appears 3–4 Gyr ago (2.5–3 Gyr ago). Star formation rate of this last period (roughly estimated from the Fig. 8 of Savino et al. (2019)) is about , in good agreement with the SFR of about measured in our work. The both measurements show the comparable total stellar mass ( ).
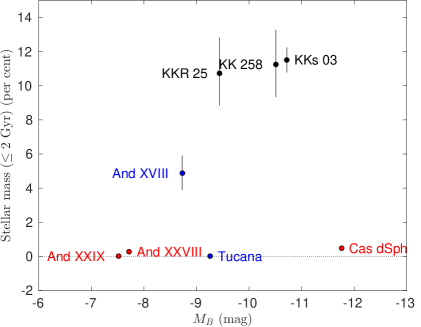
The bottom panel of Fig. 4 shows the stellar mass formed in the last 2 Gyr vs. the galaxy absolute magnitudes. The percentage of the mass formed is small for all the objects. This plot could demonstrate how intensive is the residual star formation in dwarf spheroidal galaxies depending on the degree of isolation of the object. Highly isolated galaxies clearly show recent residual star formation ( per cent of the total stellar mass), while within the virial radius it is practically zero. And XVIII and Tucana are situated beyond the virial radius (but within the Local Group zero velocity sphere). Following the logic of the above plot, they should be located between those two extreme cases. Nonetheless, Tucana is again out of the trend, located among the galaxies inside the virial radius. It also could be an argument in favour that in the past this dwarf was among the closer satellites of M 31.
Simpson et al. (2018) predicted quenching of star formation in satellite galaxies of the Local Group from a suite of 30 cosmological zoom simulations of MW-like host galaxies. The authors found that systems within host galaxy are comprised of two populations: first infall and ‘backsplash’ galaxies that have had a much more extended interaction with the host. Backsplash galaxies that do not returned to the host by z=0, exhibit quenching properties similar to galaxies within and are distinct from other external systems. The last scenario are well match with the star formation properties of Tucana dSph.
It should be noted that the results are affected by the well known problem of age-metallicity degeneration in the process of SFH measurement, and some dependence of the results on the isochrone set used (Williams et al., 2017). Besides, the obtained colour-magnitude diagrams are somewhat not deep enough, in the sense that the photometric limit is brighter than MSTO (Main Sequence turn off). At the same time, uniform data set and its homogeneous processing should reduce the influence of these factors on the results of our comparative analysis to a minimum.
When analysing SFHs of dwarf satellite galaxies in the nearby galaxy groups (first of all, the Local Group), one should take into account, that even in a particular mass range and fixed environment, there is a large degree of scatter in the SFHs, frequently noted in various researches (see, for example, Garrison-Kimmel et al. (2019)). The mentioned study has used a set of about 500 dwarf galaxies taken from FIRE-2 simulations to explore how their SFHs vary with environment. They conclude, that the satellites (d300 kpc) tend to form their stars earlier than equivalent kpc dwarfs, consistent with the picture, where interactions with MW-mass hosts inhibit star formation. A galaxy could loss its gas due to ram pressure effects and tidal interaction effects within the virial radius of the group (Andromeda galaxy group). This scenario is well established and commonly used for the explanation of the star formation quenching of dwarf spheroidal galaxies (see the paper of Makarova et al. (2017) mentioned above and the references therein).
Garrison-Kimmel et al. (2019) also found, that highly isolated dwarf galaxies with quenched even later, than dwarfs with kpc dwarfs. These conclusions are consistent with the picture demonstrated by the dwarf galaxies of our sample. At the same time, Simpson et al. (2018) found strong mass-dependent and distance-dependent quenching, where dwarf systems beyond 600 kpc are only strongly quenched below a stellar mass of . In general, our sample dwarfs are following this trend, with the apparent exception of KKR 25. However, this dwarf spheroidal galaxy is extremely isolated, and probably other mechanisms of star formation quenching should work there.
7 Conclusions
In our study we performed a comparative analysis of highly homogeneous observational and photometric data of 8 dwarf spheroidal galaxies of the Local Group (M 31 galaxy subgroup). We provided uniform processing and stellar photometry of images, as well as homogeneous star formation history measurements, to study the dwarf spheroidal galaxy evolution and possible star formation quenching mechanisms of satellites situated at the different distances from the host galaxy.
We estimated the star formation rate and metallicity depending on the age of the stellar populations, as well as the stellar mass formed in each related period of star formation. We found that the star formation has been quenched over the last 1–2 Gyr. All the studied objects show an initial active burst of star formation from about 10–12 to 13.8 Gyr ago. In addition, there are stars formed about 4–8 Gyrs ago. The periods and intensity of star formation at these ‘middle’ ages can vary significantly from object to object. The metallicity of stars is mostly low, and the metal enrichment during the galaxy life looks insignificant.
A number of common relations follow from our results:
-
•
The stellar mass range of the studied galaxies is more than the order of magnitude from about to . There is a obvious relation between the measured total stellar mass and total absolute stellar magnitude of the studied dwarf galaxies, in the sense that more luminous galaxy has higher stellar mass
-
•
According to our measurements, dwarf galaxies in our sample of higher luminosity forms the larger part of the stars (60 per cent) during the initial outburst of star formation ( Gyr ago). One interesting exception is the Tucana dSph galaxy, which possibly experienced an interaction with the Andromeda and/or other dwarfs during an expected close proximity in the central part of the Local galaxy Group
-
•
We’ve considered the residual star formation in dwarf spheroidal galaxies depending on the degree of isolation of the object. Highly isolated dwarfs clearly show recent residual star formation ( per cent of the total stellar mass), while within the virial radius it is practically zero. Tucana is again out of the trend, located among the galaxies inside the virial radius. It also could be an argument in favour that in the past this dwarf was among the closer satellites of M 31.
Acknowledgements
The work was performed within the SAO RAS state assignment in the part ‘Conducting Fundamental Science Research’.
Data availability
The data underlying this article are available in the article and in its online supplementary material.
References
- Bullock & Boylan-Kolchin (2017) Bullock J. S., Boylan-Kolchin M., 2017, ARA&A, 55, 343
- Dolphin (2000) Dolphin A. E., 2000, PASP, 112, 1383
- Dressler (1980) Dressler A., 1980, ApJ, 236, 351
- Garrison-Kimmel et al. (2019) Garrison-Kimmel S., et al., 2019, MNRAS, 489, 4574
- Grebel (2001) Grebel E. K., 2001, Astrophysics and Space Science Supplement, 277, 231
- Karachentsev et al. (2009) Karachentsev I. D., Kashibadze O. G., Makarov D. I., Tully R. B., 2009, MNRAS, 393, 1265
- Karachentsev et al. (2013) Karachentsev I. D., Makarov D. I., Kaisina E. I., 2013, AJ, 145, 101
- Karachentsev et al. (2014) Karachentsev I. D., Makarova L. N., Tully R. B., Wu P.-F., Kniazev A. Y., 2014, MNRAS, 443, 1281
- Karachentsev et al. (2015) Karachentsev I. D., Makarova L. N., Makarov D. I., Tully R. B., Rizzi L., 2015, MNRAS, 447, L85
- Kirby et al. (2020) Kirby E. N., Gilbert K. M., Escala I., Wojno J., Guhathakurta P., Majewski S. R., Beaton R. L., 2020, AJ, 159, 46
- Klypin et al. (2002) Klypin A., Zhao H., Somerville R. S., 2002, ApJ, 573, 597
- Makarov & Makarova (2004) Makarov D. I., Makarova L. N., 2004, Astrophysics, 47, 229
- Makarov et al. (2012) Makarov D., Makarova L., Sharina M., Uklein R., Tikhonov A., Guhathakurta P., Kirby E., Terekhova N., 2012, MNRAS, 425, 709
- Makarova et al. (2002) Makarova L. N., et al., 2002, A&A, 396, 473
- Makarova et al. (2017) Makarova L. N., Makarov D. I., Karachentsev I. D., Tully R. B., Rizzi L., 2017, MNRAS, 464, 2281
- Martin et al. (2017) Martin N. F., et al., 2017, ApJ, 850, 16
- Monelli et al. (2010) Monelli M., et al., 2010, ApJ, 722, 1864
- Oemler (1974) Oemler Jr. A., 1974, ApJ, 194, 1
- Rocha et al. (2012) Rocha M., Peter A. H. G., Bullock J., 2012, MNRAS, 425, 231
- Saviane et al. (1996) Saviane I., Held E. V., Piotto G., 1996, A&A, 315, 40
- Savino et al. (2019) Savino A., Tolstoy E., Salaris M., Monelli M., de Boer T. J. L., 2019, A&A, 630, A116
- Schlafly & Finkbeiner (2011) Schlafly E. F., Finkbeiner D. P., 2011, ApJ, 737, 103
- Simpson et al. (2018) Simpson C. M., Grand R. J. J., Gómez F. A., Marinacci F., Pakmor R., Springel V., Campbell D. J. R., Frenk C. S., 2018, MNRAS, 478, 548
- Skillman et al. (2017) Skillman E. D., et al., 2017, ApJ, 837, 102
- Teyssier et al. (2012) Teyssier M., Johnston K. V., Kuhlen M., 2012, MNRAS, 426, 1808
- Tolstoy et al. (2009) Tolstoy E., Hill V., Tosi M., 2009, ARA&A, 47, 371
- Weisz et al. (2011) Weisz D. R., et al., 2011, ApJ, 739, 5
- Weisz et al. (2014) Weisz D. R., Dolphin A. E., Skillman E. D., Holtzman J., Gilbert K. M., Dalcanton J. J., Williams B. F., 2014, ApJ, 789, 147
- Weisz et al. (2019) Weisz D. R., et al., 2019, ApJ, 885, L8
- Williams et al. (2017) Williams B. F., et al., 2017, ApJ, 846, 145