The Peculiar Transient AT2018cow: A Possible Origin of A Type Ibn/IIn Supernova
Abstract
We present our photometric and spectroscopic observations on the peculiar transient AT2018cow. The multi-band photometry covers from peak to 70 days and the spectroscopy ranges from 5 to 50 days. The rapid rise (2.9 days), high luminosity (20.8 mag) and fast decline after peak make AT2018cow stand out of any other optical transients. While we find that its light curves show high resemblance to those of type Ibn supernovae. Moreover, the spectral energy distribution remains high temperature of 14,000 K after 15 days since discovery. The spectra are featureless in the first 10 days, while some broad emission lines due to H, He, C and O emerge later, with velocity declining from km s-1 to 3000 km s-1 at the end of our observations. Narrow and weak He I emission lines emerge in the spectra at 20 days since discovery. These emission lines are reminiscent of the features seen in interacting supernovae like type Ibn and IIn subclasses. We fit the bolometric light curves with a model of circumstellar interaction (CSI) and radioactive decay (RD) of 56Ni and find a good fit with ejecta mass , circumstellar material mass , and ejected 56Ni mass . The CSM shell might be formed in an eruptive mass ejection of the progenitor star. Furthermore, host environment of AT2018cow implies connection of AT2018cow with massive stars. Combining observational properties and the light curve fitting results, we conclude that AT2018cow might be a peculiar interacting supernova originated from a massive star.
1 Introduction
The studies of time domain astronomy cover a variety of optical transients, including novae, supernovae (SNe), tidal disruption events (TDE), and kilonovae, etc. With different physical origins, these transients exhibit a huge diversity in evolutionary properties, especially optical light curves. The evolutionary time scales and luminosity of different transients are directly related to their physical origins. There are a group of transients with very high luminosity and short timescale of evolution, such as the so-called fast evolving luminous transients (FELTs) (e.g. Rest et al., 2018). They have much faster rise and decline in light curves than regular SNe. And many of them have peak luminosity much higher than normal SNe, close to the superluminous supernovae (SLSNe, Quimby et al., 2011; Howell, 2017). The physical origins of these FELTs are still unclear. Among them, some are characterized by very blue color, indicating high temperature, which are also called fast-rising blue optical transients (FBOTs, e.g. Drout et al., 2014; Arcavi et al., 2016).
A recently discovered extragalactic transient, AT2018cow (ATLAS18qqn), has caught much attention due to its peculiar behaviour in its light curves and spectral evolution. AT2018cow was discovered by ATLAS on MJD 58285.44 (UT Jun. 16.44, 2018, UT dates are used throughout this paper), with a magnitude of 14.760.10 mag in ATLAS orange-band (Smartt et al., 2018). It is located far from the center of the host galaxy CGCG 137-068 (, Mpc111We assume a flat universe with , (Planck Collaboration et al., 2016).). This distance means that AT2018cow is as luminous as the peak of SNe Ia at discovery. As soon as this transient source was reported, astronomers from all over the world were actively conducting its follow-up observations in all bands, including ultra-violet (UV), optical, X-ray, radio and -ray. AT2018cow is found to evolve rapidly with a rise time less than 3 days and peak magnitude <20 mag. The photospheric temperature is measured to be 30,000 K near the peak and it still maintains high temperature of 15,000 K after 20 days after discovery (Prentice et al., 2018; Perley et al., 2019). All of these features suggest that AT2018cow can be put into the FBOTs.
The close distance makes AT2018cow the first FELT/FBOT which has well-sequenced photometric and spectroscopic observations in wavebands ranging from X-ray to radio (e.g., Prentice et al., 2018; Perley et al., 2019; Kuin et al., 2019; Margutti et al., 2019; Ho et al., 2019), making it a rare sample for the study of FBOT-like objects. In previous studies, several possible physical mechanisms have been proposed for AT2018cow, e.g., tidal disruption of a star into an intermediate mass black hole (Perley et al., 2019; Kuin et al., 2019, Li et al. in prep.), central-engine powered supernova (Prentice et al., 2018; Margutti et al., 2019), interaction of a condensed CSM and the supernova shock (Margutti et al., 2019; Leung et al., 2020), electron-capture collapse of a white dwarf (Lyutikov & Toonen, 2019). And Margutti et al. (2019) suggests that there should be a deeply embedded X-ray source in an asymmetrical ejecta.
In this paper, we present our optical photometric and spectroscopic observations of AT2018cow. Spectroscopic observations spanned from Jun. 21, 2018 to Aug. 14, 2018. and photometric observations lasted until September 21, 2018. In Sec. 2 we describe our spectroscopic and photometric observations as well as data processing. In Sec. 3 we analyse the observational properties of AT2018cow, including light-curve and spectral evolution. The analysis of the host galaxy is presented in Sec. 4. In Sec. 5 we explore the possible physical origins of AT2018cow. Further discussion and final summary are given in Sec. 6 and 7, respectively.
2 Observations and Data Reduction
2.1 Photometric Observations
The optical photometric observations of AT2018cow were monitored by several observatories, including the 0.8-m Tsinghua University-NAOC telescope (TNT, Huang et al., 2012) at Xinglong Observatory of NAOC, the AZT-22 1.5-m telescope (hereafter AZT) at Maidanak Astronomical Observatory (Ehgamberdiev, 2018), telescopes of the Las Cumbres Observatory network (LCO), and telescope of Konkoly Observatory in Hungary (hereafter KT). Photometric and spectroscopic data from LCO were obtained via the Global Supernova Project (GSP). We also collected early time photometric data from Observadores de Supernovas Group (ObSN) in Spain. The TNT and LCO observations were obtained in standard Johnson-Cousin bands and SDSS bands. Long time and short-cadenced observations in bands were obtained by AZT. The Konkoly observations were obtained in bands. Data from ObSN were obtained in and bands. The entire dataset covers phases from MJD 58286.89 (Jun. 17.89, 2018) to MJD 58348.74 (Aug. 18.74, 2018). The earliest photometric data point comes from ObSN in -band on MJD 58286.89, which is 0.27 day earlier than that presented in Prentice et al. (2018). Besides the fast rise, the object faded very quickly. The late time photometry may be influenced by contamination from the galaxy. Thus for AZT, LCO and KT, we obtained reference images in each band in Mar. 2019, Oct. 2018, and Feb. 2019, respectively. The reference images were obtained in all corresponding bands except for the -band of AZT. For TNT images, since the source is still bright during observations, the influence of the background is negligible. Although the observations continued after Aug. 18, 2018, the object became too faint to be distinguished from the background.
All and images are pre-processed using standard IRAF222IRAF is distributed by the National Optical Astronomy Observatories, which are operated by the Association of Universities for Research in Astronomy, Inc., under cooperative agreement with the National Science Foundation (NSF). routines, which includes corrections for bias, flat field, and removal of cosmic rays. To remove the contamination from the host galaxy, we applied template subtraction to the AZT, LCO and KT images. Note that the -band images were not host subtracted. The instrumental magnitudes of both AT2018cow and the reference stars were then measured using the standard point spread function (PSF). And then the instrumental magnitudes were converted to standard Johnson and SDSS gri-band magnitudes using the zero points and color terms of each telescope. The resultant magnitudes are listed in Tab. 1. We also include the early photometry from Prentice et al. (2018) for comparison. The light curves are shown in Fig. 1. \startlongtable
| MJD | mag. | mag. error | band | Telescope/reference |
|---|---|---|---|---|
| 58285.4400 | 14.700 | 0.100 | o | Smartt et al. (2018) |
| 58286.1950 | 14.320 | 0.010 | i | Fremling (2018) |
| 58286.8880 | 13.695 | … | V | ObSN |
| 58287.1130 | 13.593 | … | V | ObSN |
| 58287.1500 | 13.400 | 0.050 | g | Prentice et al. (2018) |
| 58287.1500 | 13.800 | 0.100 | r | Prentice et al. (2018) |
| 58287.1500 | 14.100 | 0.100 | i | Prentice et al. (2018) |
| 58287.4440 | 13.674 | … | V | ObSN |
| 58287.9270 | 13.771 | … | V | ObSN |
| 58287.9400 | 14.021 | … | I | ObSN |
| 58287.9460 | 13.926 | … | r | ObSN |
| 58287.9520 | 13.742 | … | V | ObSN |
| 58287.9540 | 13.692 | … | B | ObSN |
| 58287.9540 | 13.692 | … | g | ObSN |
| 58287.9750 | 13.725 | … | R | ObSN |
| 58288.0677 | 13.809 | 0.021 | B | LCO |
| 58288.0677 | 13.939 | 0.013 | V | LCO |
| 58288.0677 | 13.787 | 0.011 | g | LCO |
| 58288.0677 | 14.573 | 0.016 | i | LCO |
| 58288.0677 | 14.295 | 0.017 | r | LCO |
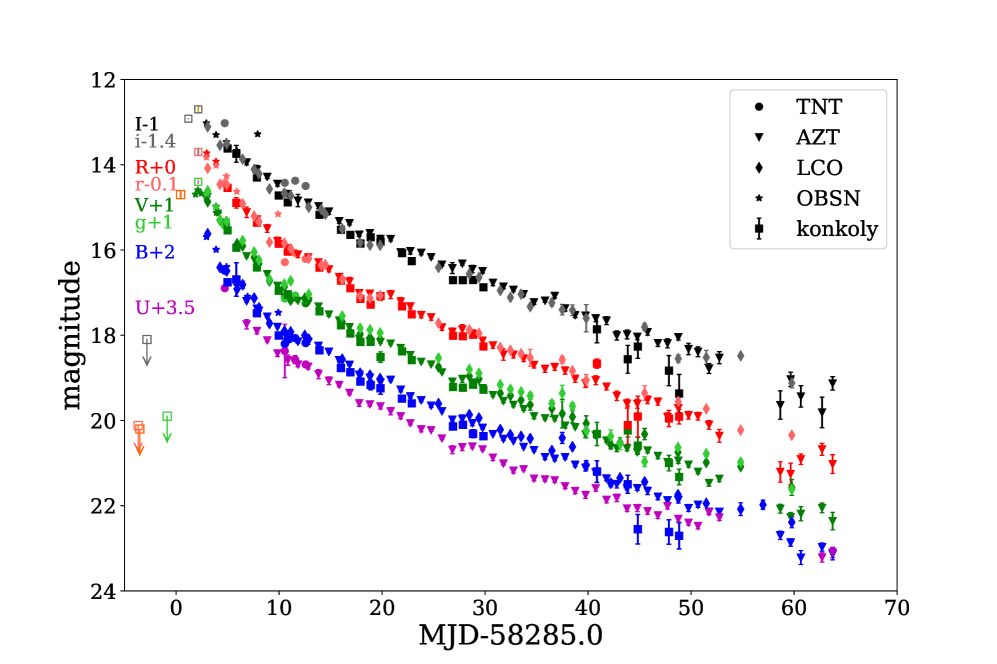
It can be seen that AT2018cow rises to a peak at MJD58287.0 in , and bands, where the light curves are better sampled around the peak. The latest non-detection limit is on MJD 58284.13 in -band (Prentice et al., 2018), so the rise time of AT2018cow is less than 2.9 days. If we take the median of the first detection (i.e. discovery by ATLAS) MJD 58285.44 and the latest non-detection (i.e. MJD 58284.13) as the first light time, then the rise time is 2.2 days. We apply an explosion time on MJD=58284.790.66 throughout this paper. This rise time is too short compared to supernovae, which usually have rise time of more than 10 days. After the peak, the light curves decline as fast as 0.33 mag d-1, 0.27 mag d-1, 0.22 mag d-1, within the first 10 days in , and -bands, respectively.
2.2 Optical Spectroscopic Observations
Our first spectrum was taken at Jul. 21, 2018 by the 2.16-m telescope at Xinglong Observatory of NAOC (hereafter XLT). A total of 31 spectra were collected with different telescopes, including the XLT, the 2-m Faulkes Telescope North (FTN) of the Las Cumbres Observatory network, and the 9.2-m Hobby-Eberly Telescope (HET). The details of the spectroscopic observations are listed in Tab. 2.
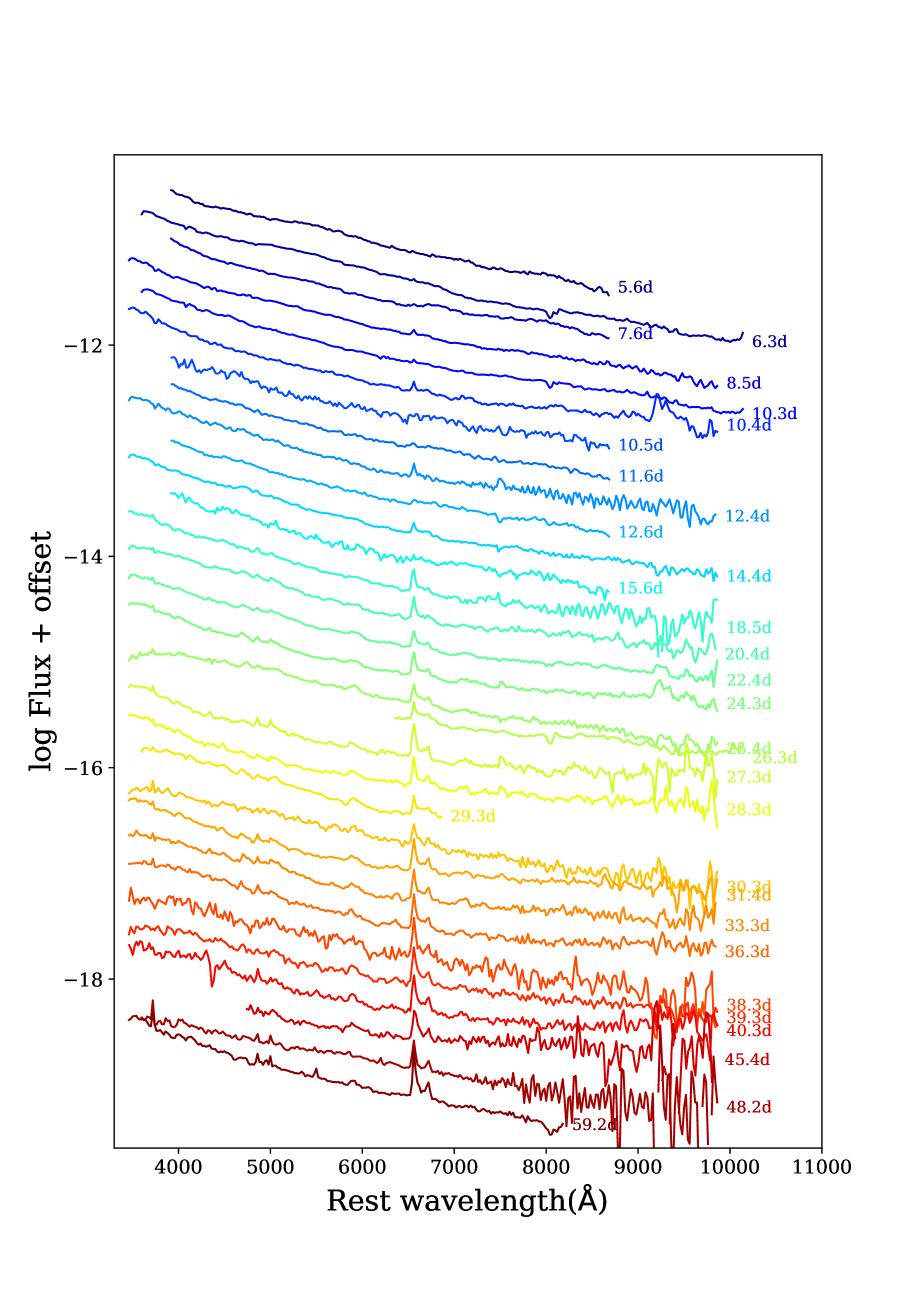
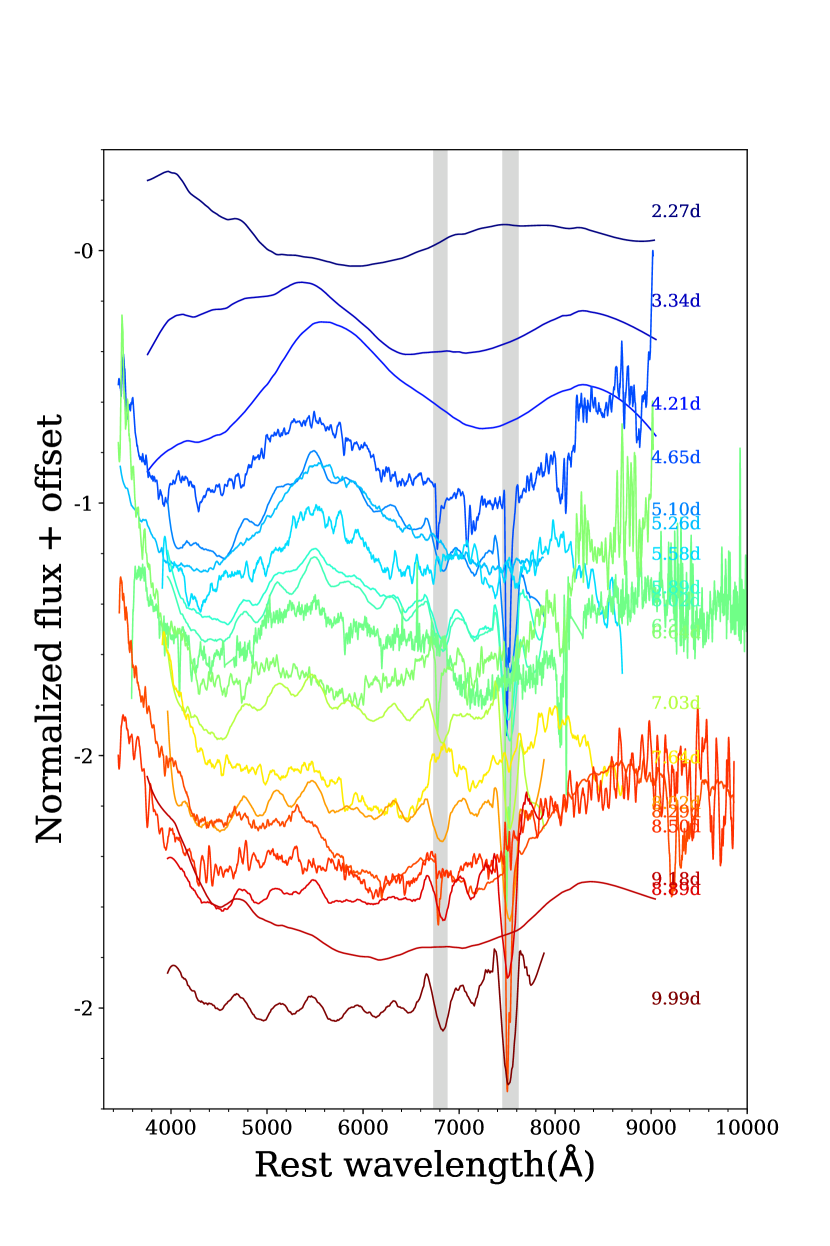
All spectra were reduced using the standard IRAF routines, which involves corrections for bias, flat field, and removal of cosmic rays. The Fe/Ar and Fe/Ne arc lamp spectra obtained during the observation nights are used to calibrate the wavelength of the spectra, and standard stars observed on the same night at similar airmasses as the supernova were used to calibrate the flux of spectra. The spectra were further corrected for continuum atmospheric extinction during flux calibration using mean extinction curves obtained at Xinglong Observatory and Haleakala Observatory in Hawaii, respectively. Moreover, telluric lines were removed from the spectra of XLT and FTN. We recalibrated the fluxes of the spectra to the multi-band photometry data. The UV data from Perley et al. (2019) are included in the recalibration process. The recalibrated spectra are shown in Fig. 2.
On Sep. 17, 2019, when AT2018cow already faded away in the host galaxy, a spectrum was obtained at the site of AT2018cow by HET. There are some narrow absorption lines in the resultant spectrum, which are an artifact of data reduction. HET LRS2 is an IFU spectrograph having 280 individual fibers packed close together in a rectangular pattern, with a field-of-view of 12"6", which is smaller than the size of the host galaxy of AT2018cow. Since the data reduction pipeline determines the background by combining the fibers having the lowest flux level, the background will necessarily contain some of the galaxy features. Thus the spectra show some fake absorption lines resulting from subtraction of the emission lines from other faint part of the host galaxy. These fake lines are manually removed from the spectrum. A detailed analysis on this spectrum is presented in Sec. 4. \startlongtable
| UT | MJD | Telescope | Wav. range (Å) | Instrument | Exposure time (s) |
|---|---|---|---|---|---|
| 2018/06/21.58 | 58290.58 | XLT | 3970-8820 | BFOSC | 2400 |
| 2018/06/22.32 | 58291.32 | HET | 3640-10298 | LRS2 | 300 |
| 2018/06/23.64 | 58292.64 | XLT | 3970-8820 | BFOSC | 2400 |
| 2018/06/24.50 | 58293.50 | FTN | 3500-10000 | FLOYDS | 1200 |
| 2018/06/26.30 | 58295.30 | HET | 3640-10300 | LRS2 | 500 |
| 2018/06/26.39 | 58295.39 | FTN | 3500-10000 | FLOYDS | 1200 |
| 2018/06/26.54 | 58295.54 | XLT | 3970-8820 | BFOSC | 1200 |
| 2018/06/27.57 | 58296.57 | XLT | 3970-8820 | BFOSC | 2400 |
| 2018/06/28.35 | 58297.35 | FTN | 3500-10000 | FLOYDS | 1200 |
| 2018/06/28.55 | 58297.55 | XLT | 3970-8820 | BFOSC | 1200 |
| 2018/06/30.38 | 58299.38 | FTN | 3500-10000 | FLOYDS | 1200 |
| 2018/07/01.57 | 58300.57 | XLT | 3970-8820 | BFOSC | 1500 |
| 2018/07/04.48 | 58303.48 | FTN | 3500-10000 | FLOYDS | 1200 |
| 2018/07/06.43 | 58305.43 | FTN | 3500-10000 | FLOYDS | 2700 |
| 2018/07/08.37 | 58307.37 | FTN | 3500-10000 | FLOYDS | 2700 |
| 2018/07/10.33 | 58309.33 | FTN | 3500-10000 | FLOYDS | 2700 |
| 2018/07/11.41 | 58310.41 | FTN | 3500-10000 | FLOYDS | 2700 |
| 2018/07/12.25 | 58311.25 | HET | 6440-10300 | LRS2 | 1000 |
| 2018/07/13.32 | 58312.32 | FTN | 3500-10000 | FLOYDS | 2700 |
| 2018/07/14.35 | 58313.35 | FTN | 3500-10000 | FLOYDS | 2700 |
| 2018/07/15.25 | 58314.25 | HET | 3640-6970 | LRS2 | 800 |
| 2018/07/16.31 | 58315.31 | FTN | 3500-10000 | FLOYDS | 2700 |
| 2018/07/17.35 | 58316.35 | FTN | 3500-10000 | FLOYDS | 2700 |
| 2018/07/19.35 | 58318.35 | FTN | 3500-10000 | FLOYDS | 3600 |
| 2018/07/22.28 | 58321.28 | FTN | 3500-10000 | FLOYDS | 3600 |
| 2018/07/24.34 | 58323.34 | FTN | 3500-10000 | FLOYDS | 3600 |
| 2018/07/25.32 | 58324.32 | FTN | 3500-10000 | FLOYDS | 3600 |
| 2018/07/26.34 | 58325.34 | FTN | 3500-10000 | FLOYDS | 3600 |
| 2018/07/31.37 | 58330.37 | FTN | 4800-10000 | FLOYDS | 3600 |
| 2018/08/03.25 | 58333.25 | FTN | 3500-10000 | FLOYDS | 3600 |
| 2018/08/14.18 | 58344.18 | HET | 3640-8300 | LRS2 | 1800 |
| 2019/09/17.09 | 58743.09 | HET | 3640-10200 | LRS2 | 1800 |
3 Observational Properties
3.1 Light Curves and Color Evolution
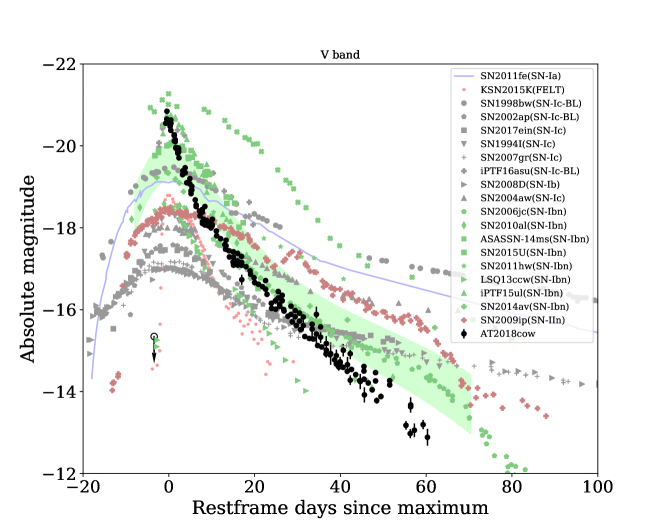
The light curves of AT2018cow show much faster evolution than other optical transients. In Fig. 3 we compare the -band light curves of AT2018cow with other SNe of different subtypes, including the peculiar fast-evolving transient KSN2015K (Rest et al., 2018). One can see that both the rise and decline of AT2018cow are faster than any other known fast-evolving supernovae. The rise time is very close to KSN2015K, while AT2018cow is about 2 mags brighter. Most SLSNe have much slower evolution so we do not show them in the plot. AT2018cow is close to the type Ibn SN iPTF15ul (Hosseinzadeh et al., 2017) in peak luminosity, while it is similar to the type Ibn SN 2006jc in terms of fast decline after the peak. It should be noted that the high luminosity as well as the rapid evolution seen in AT 2018cow lie in the range of SNe Ibn.
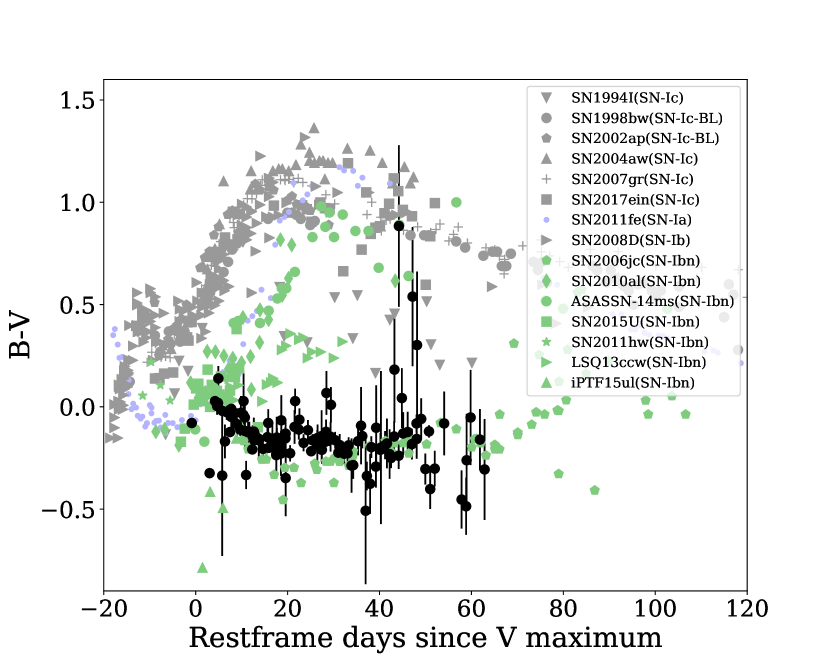
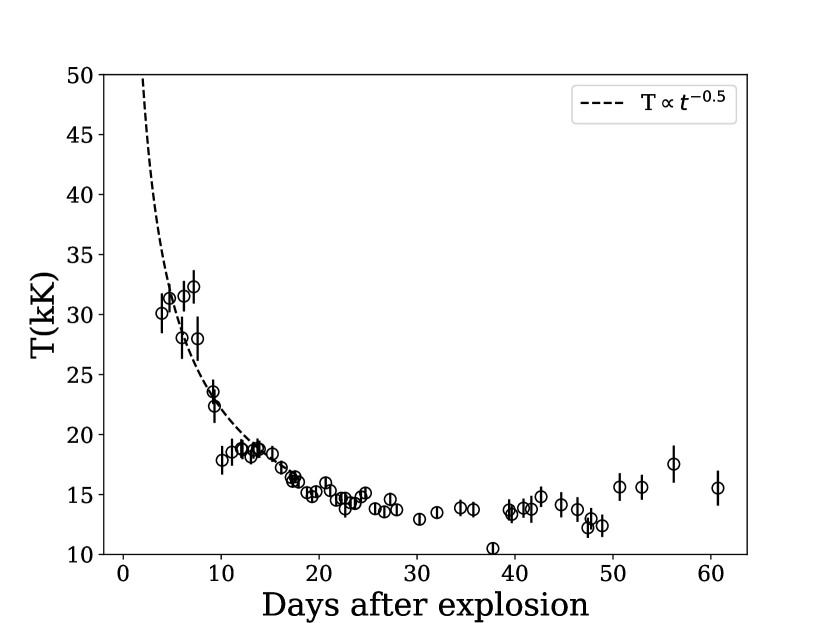
During our observations, AT2018cow maintains very blue color (i. e. mag, Fig. 4). Thus, it should suffer little reddening from its host galaxy. This can also be verified by the absence of Na I D absorption line in the spectra. We only consider the Galactic extinction of =0.08 (Schlafly & Finkbeiner, 2011) for AT2018cow, and ignore the host extinction in this paper. As also proposed by Perley et al. (2019), the photospheric temperature of AT2018cow is as high as 30,000 K near the maximum light, and is still as high as 14,000 K at 50 days after discovery. This is not seen in any other optical transients ever discovered. For supernovae, the photospheric temperature can be high in early times but usually cools down to 5000 K in a few weeks after explosion, since the energy source is not strong enough to maintain a very high temperature. So the color of normal SNe will become red in late phases. In Fig. 4 we show the color evolution of AT2018cow in comparison with other SNe. The color evolution of AT2018cow resembles that of SN 2006jc. Assuming a blackbody SED shape, the spectra of SN 2006jc also seem to present unusually high effective temperature, 15,000 K on day 8, then the temperature grows to 25,000 K on day 25 and drops to 15,000 K around day 60. The temperature decreases to 3,500 K and then keeps flat after day 80. Nevertheless, the interaction and blending of iron lines may indeed contribute to the high temperature.
Another interesting point is that the photospheric radius seems to be decreasing since the very beginning, unlike that of normal SNe, which will increase before peak and then decrease as a result of the expansion and dilution of the ejecta. The absence of an expansion phase is the main problem of the supernova origin for AT2018cow.
3.2 Spectral Evolution: Signatures of Interaction
The spectra of AT2018cow are characterized by featureless blue continuum in the first 10 days after discovery, and then some broad emission features emerge later, with possible contaminations from the host galaxy. Featureless and blue spectra are common in SNe due to high photospheric temperature at early phases. Then spectral lines appear as the temperature decreases. We create normalized spectra of AT2018cow from the observed spectra by subtracting and deviding the best fit single blackbody continuum of each spectrum. In the first 10 days, the spectra are characterized by a wide feature near 5000Å, as shown in Fig. 5. Later on, many broad emission lines emerge, overlapped with many narrow and strong emission lines. And there is flux excess in the red end, which is probably due to dust emission in later phases. As proposed by Fox & Smith (2019), the spectra of AT2018cow might have shown signatures of circurmstellar interaction (CSI) like SNe Ibn and IIn. While the typical features of CSI are narrow emission lines of H and He. The last spectrum taken by HET shows many narrow emission lines (FWHM 4 Å) which are apparently from the background host galaxy. Although other spectra of AT2018cow do show strong and broader H lines since day 8 (Fig. 2), it is quite possible that the lines of H are from the host galaxy, not AT2018cow. The reason is that those spectra do not have such high resolution as that in HET spectrum, so the narrow lines are broadened. To figure out whether the narrow emission lines are from the host galaxy or AT2018cow, we measured the FWHMs of H line in each spectrum and compared it with other lines in the same spectrum. The results show that the width of H lines are only slightly broader than (by less than 10 Å, within the uncertainty) other narrow lines such as [NII] and [SII], indicating that they are probably from the host galaxy. Thus we conclude that there is no significant narrow emissions of H in AT2018cow.
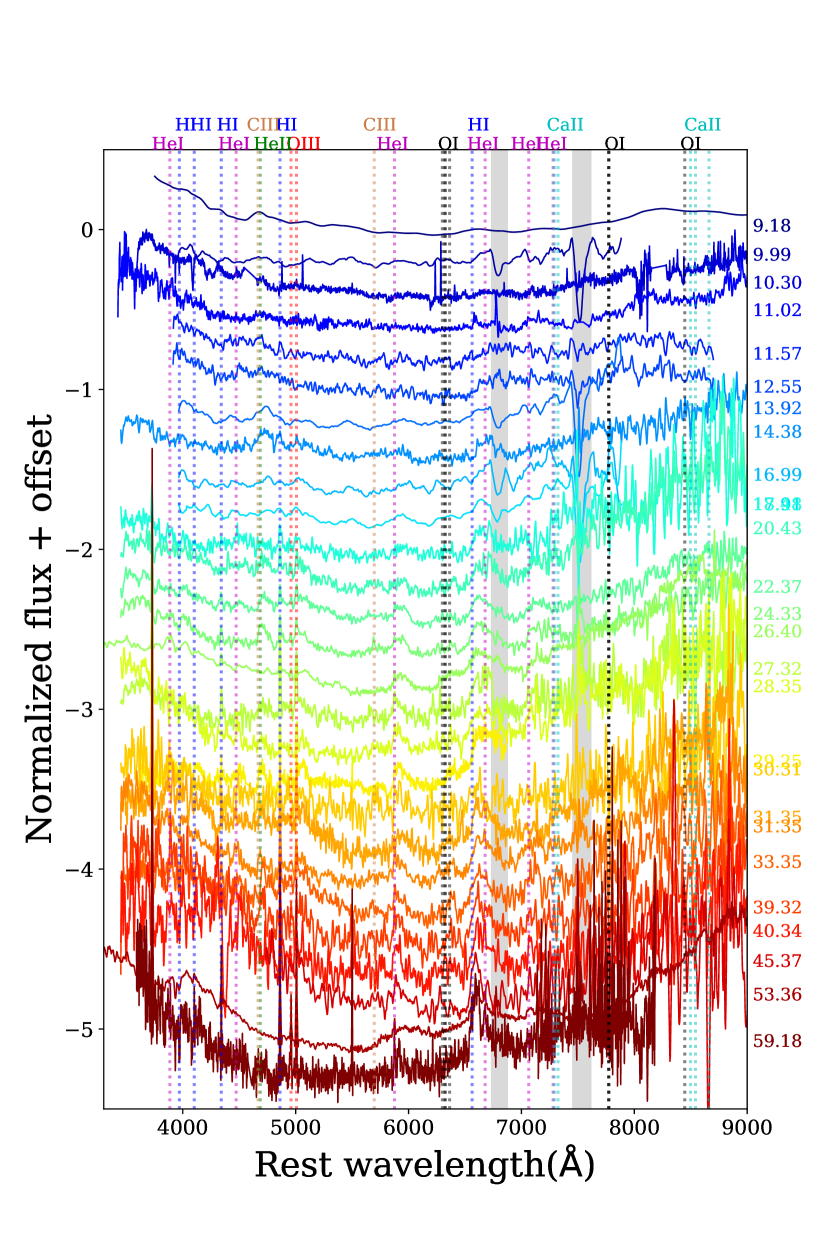
To better look into the spectral features of AT2018cow at t>10 days, we carefully subtracted the narrow emission lines of H, [NII] 6548,6583 and [SII] 6730,6716 from the spectra. For the spectra taken from 10 days to 59 days after discovery, we identify shallow and broad emission lines that can be attributed to HI, HeI, HeII, OI, OIII and CIII lines (as shown in Fig. 6). The OI, OIII, CIII and HeII lines dissipated after around day 45. The peaks of these lines are all slightly redshifted by up to 2000 km s-1. The emission lines of AT2018cow are much broader than most SNe Ibn and IIn. The HeI 5876 line has an FWHM of 300Å () at day 14, which is one magnitude higher than that of most SNe Ibn ( 1000 ). In late phases, the broad lines become narrower, with the FWHM decreasing to 3000 km s-1 on day 59. Meanwhile, these broad emission lines are redshifted with velocities decreasing from 1800 when they first emerge, to hundreds of km s-1 in late phases. In the region of H, there is a broad emission line, which should be a blending of H and HeI 6678. This line is seen getting narrower over time and splitted into two lines since t30 day, and the peaks moves to the rest wavelength. In addition to the long existing broad emission lines, weak and narrow (FWHM8001000 km s-1) HeI 6678 line emerged in the spectra since t20 days. This narrow line is certain to be from AT2018cow, as it does not appear in the spectrum of the host galaxy. To conclude, the broad emission lines of highly ionized elements (CIII, OIII) indicate that there is possible CSM interaction at very early time (t<10 days). And the appearance of narrow He emission lines in late times (t>20 days) implies the existence of another distant CSM formed around the progenitor object.
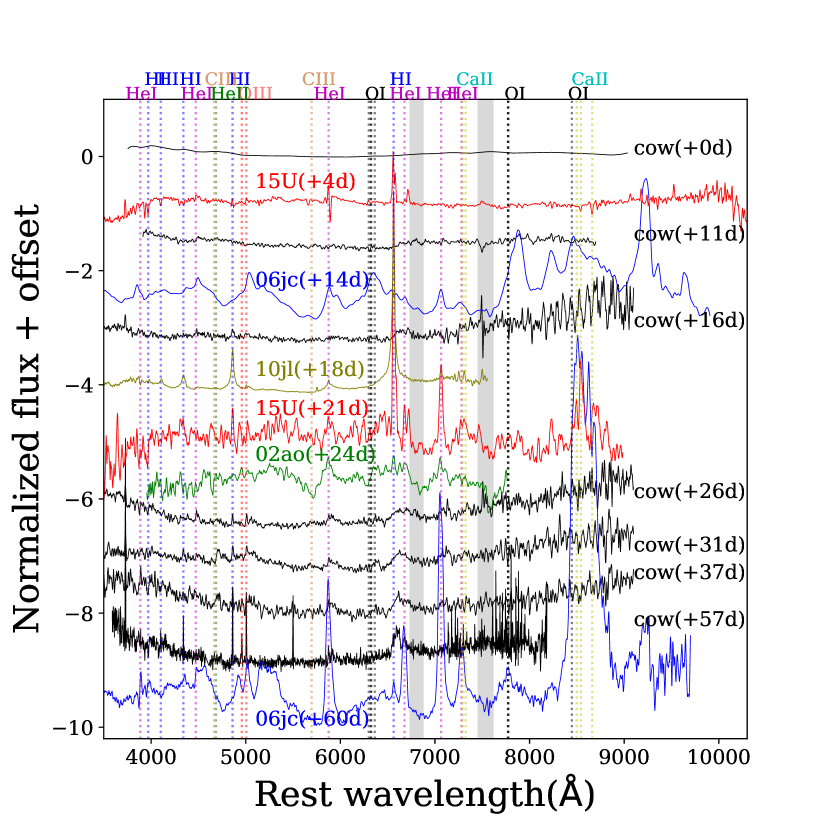
It is natural to think of an interacting SN picture for AT2018cow. Fox & Smith (2019) found the similarity between AT2018cow and some SNe Ibn and SNe IIn. Here we argue that although AT2018cow show signitures of interaction similar to SNe Ibn and SNe IIn, its spectral evolution is quite different from that of SNe Ibn and IIn. In Fig. 7 we show the spectral evolution of AT2018cow compared with some well observed SNe Ibn, SN 2006jc (Pastorello et al., 2007; Smith et al., 2008), SN 2015U (Pastorello et al., 2015a; Shivvers et al., 2016) and SN 2002ao (Pastorello et al., 2008a), and a typical SN IIn 2010jl (Smith et al., 2012c; Zhang et al., 2012). From Fig. 7 we can see the diversity of SNe Ibn. AT2018cow seems to have different spectral features from any other interacting SNe, as it has weaker lines at all phases. At earlier phases AT2018cow is characterized by blue featureless continum like that seen in some CCSNe as a result of hight temperature, i. e. SN 2015U from our comparison sample. While SN 2015U shows a narrow P-cygni absorption feature, indicating the recombination of He in the CSM (Shivvers et al., 2016). Note that the emission lines of AT2018cow emerged at later phases, and are much weaker compared to SN 2006jc and SN 2002ao. Moreover, the Ca lines are very strong in SN 2006jc and SN 2015U, but are weak in AT2018cow. At late times, AT2018cow show similarities to SN 2002ao, both being dominated by broad lines. While P-cygni absorption of HeI lines are present in SN 2002ao, and the lines are stronger. The line velocity of HeI at t24d is 8500 km s-1 for SN 2002ao, slightly higher than AT2018cow (7000 km s-1). SN 2002ao is claimed as 06jc-like, which are proposed as Wolf-Rayet (WR) stars exploded in a He-rich CSM (Pastorello et al., 2008a). Although SNe Ibn and IIn are distinguished by the strength of the H emission lines, there are some transitional objects which show roughly equal strength of H and He emission lines, for example SN 2005la (Pastorello et al., 2008b) and SN 2011hw (Smith et al., 2012b; Pastorello et al., 2015b).
In most interacting supernovae, like SNe IIn and Ibn, the emission lines have velocities in range of tens to a few thousand km s-1, depending on the wind velocities of the progenitor stars. The wind velocities are related to the type of the progenitor stars. At same metallicities, stars with larger initial masses are expected to have stronger stellar winds therefore higher wind velocities when they evolve to the end of life (see Smith, 2014 and references therein). Some of the objects show intermediate width emission lines (1000 km s-1 < < 4000 km s-1), like SN 2006jc. In spectra of SN 2006jc, the bluer He lines show narrow P-Cygni profiles, while the redder He lines show an intermediate width emission component (FWHM 3000 km s-1) (Foley et al., 2007). The broad emission features in AT2018cow are apparently different from the spectral features in ordinary SNe II. The lack of absorption features implies that AT2018cow is possibly more similar to SNe IIn/Ibn, rather than SNe IIP/IIL. While the velocities of the broad emission component in AT2018cow (10,000 km s-1) are much higher than normal SNe Ibn/IIn. The lack of narrow emission lines in AT2018cow and relatively weak lines make it unique among interacting SNe. While this is not an argument against the interacting SN origin of AT2018cow, because spectral diversity is seen in other SNe Ibn and SNe IIn (e.g., Hosseinzadeh et al., 2017). Absence of narrow lines might be resulted from a closely located CSM which was immediately swept up by the shock within a short time period.
4 Host galaxy environment
We notice that the spectra of AT2018cow are almost featureless at early phases (t<10 d). Later on the spectra are some broader features overlapped with many narrow emission lines which are most probably due to the emission from the background galaxy. We obtained a spectrum of the host at the location of AT2018cow with the 9.2-m HET on Sep. 17, 2019 (corresponding to 460 days after discovery), as shown in Fig. 8.
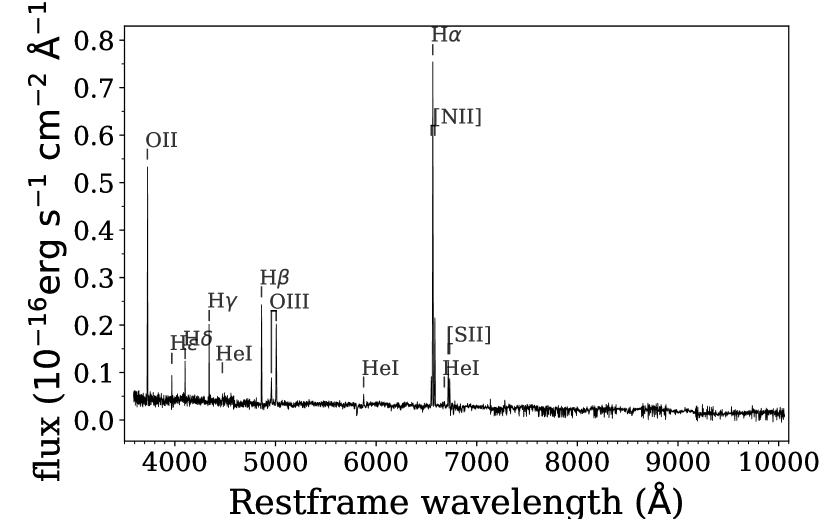
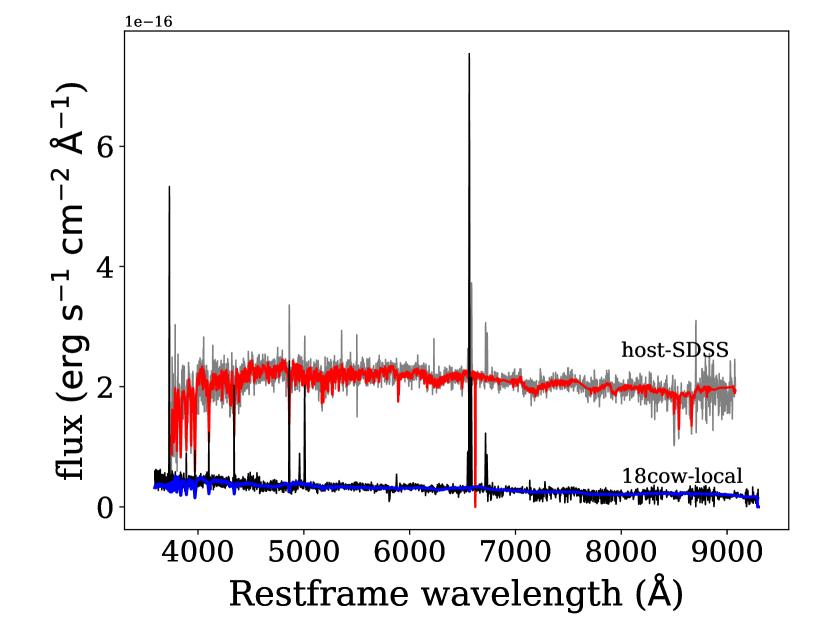
The spectrum is characterized by that of a typical HII region, which implies that this region is currently at gas phase and star-forming. One can see strong emission lines of H, He, N, S and O, and a NaI D absorption line at the rest wavelength of the Milky Way. With this spectrum, we are able to measure the intensities of the emission lines and then derive the properties of the local environment. Following Curti et al. (2017), we get a local metallicity of 12+log(O/H)8.650.07, which is solar-like and among the range of other SNe Ibn (Pastorello et al., 2016). The star formation rate (SFR) can be derived from the luminosity of the H emission line, for which we measured as (H) erg s-1. This is consistent with the result from Lyman et al. (2020) (H) erg s-1 at the site of AT2018cow, considering that we applied a larger distance. Using the conversion factor given in Sullivan et al. (2001), we get SFR(H) yr-1. We also examine the [OII]3727 line, and get ([OII]) erg s-1. With the relation given in Kennicutt (1998), we get SFR([OII]) yr-1, which is consistent with that from H line. To get more information of the local environment of AT2018cow, we use Firefly (Wilkinson et al., 2017) to fit the spectrum with stellar population models. The input models are two M11 libs: MILES and STELIB (Maraston & Strömbäck, 2011), and initial mass function ‘Kroupa’ (Kroupa, 2001) is adopted in the fit. Fig. 8 shows the best fit specta, from which we get a stellar mass of . Combining the above SFR and stellar mass infomation, we can get a local specific star formation rate (sSFR) as log(sSFR)8.5 (yr-1).
The Sloan Digital Sky Survey (SDSS; Abolfathi et al., 2018) has taken one spectrum at the center of the host galaxy of AT2018cow on MJD 53566. As the HET spectrum we obtained only provides the local information, we also use the SDSS spectrum to measure the above corresponding parameters for the whole galaxy. The resulting metallicity is the same as that measured from the HET spectrum spotted at the site of AT2018cow, while the SFR is measured as SFR(H if we do not consider any host extinction. The Firefly fit shows that the stellar mass of the nucleus is . We caution that the SDSS spectrum only includes the flux from the galaxy center, thus the SFR is expected to be lower. For the whole galaxy, we refer to the results from other studies. Perley et al. (2019) and Lyman et al. (2020) found stellar mass and SFR in good agreement with each other, although they adopted different distances. At =63 Mpc, stellar masses in these two studies become and , respectively. And the SFR from Lyman et al. (2020) becomes 0.20 yr-1. In the following discussion, we adopt an average of these results, i.e. , SFR0.21 yr-1, and log(sSFR)9.88 (yr-1).
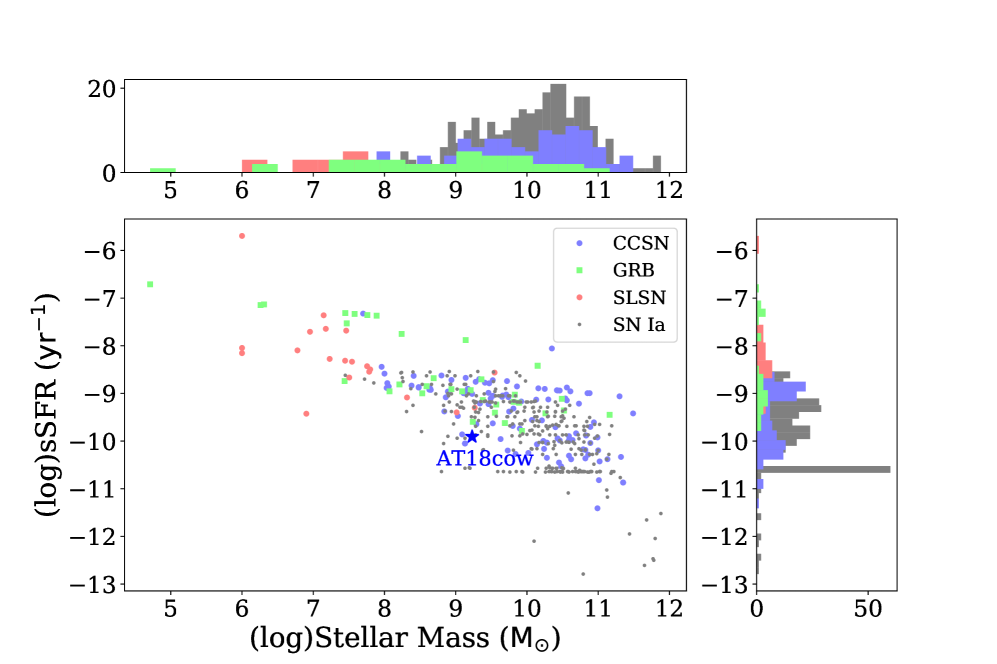
The host environment may provide a clue to the physical origin of AT2018cow. We compare the host environment parameters with other well studied transients, including type Ia supernovae (SNe Ia, Smith et al., 2012a; Galbany et al., 2014), core-collapse supernovae (CCSNe, Svensson et al., 2010; Galbany et al., 2014), superluminous supernovae (SLSNe, Angus et al., 2016), and gamma-ray bursts (GRBs, Svensson et al., 2010). As shown in Fig. 9, the host galaxy of AT2018cow is located among SNe Ia, CCSNe and GRBs, but away from the SLSNe group. The host galaxy of AT2018cow has stellar mass close to the median of GRBs, but at the lower end of the SNe group, except for SLSNe. We can not say for sure which group it should belong to, and it is likely that AT2018cow is distinct from SLSNe, although AT2018cow has a peak luminosity comparable to them. Meanwhile, the local high SFR of AT2018cow may imply that AT2018cow is probably originated from a massive star.
5 Modeling the rapid evolving light curves
The physical interpretation of AT2018cow is still in debate, although there are already several papers trying to uncover its physical origin. The radioactive decay of 56Ni is a well known energy source for supernovae (Arnett, 1982). The bolometric light curve of AT2018cow can not be powered by pure 56Ni , as the peak luminosity would require an ejected 56Ni mass of 6 but a low ejecta mass < 1 . In the above analysis, we find high resemblance of the light curves of AT2018cow to that of SNe Ibn, and signatures of CSI are found in the spectra, so we try to fit the light curves of AT2018cow using the CSI model. The fast-declining and luminous bolometric light curve of SN 2006jc has been successfully modeled by CSI models (e.g., Chugai, 2009; Tominaga et al., 2008). The rapid declining light curves can be related to the early shock-cooling from the progenitor envelope. Since the progenitor has lost most of its hydrogen envelope, the shock-cooling should be weak and short for the core-collapse of a massive star. Another reasonable interpretation is the interaction of the supernova ejecta with the surrounding circumstellar medium (CSM). This can be supported by the emission lines in the spectra (see Sec. 3.2).
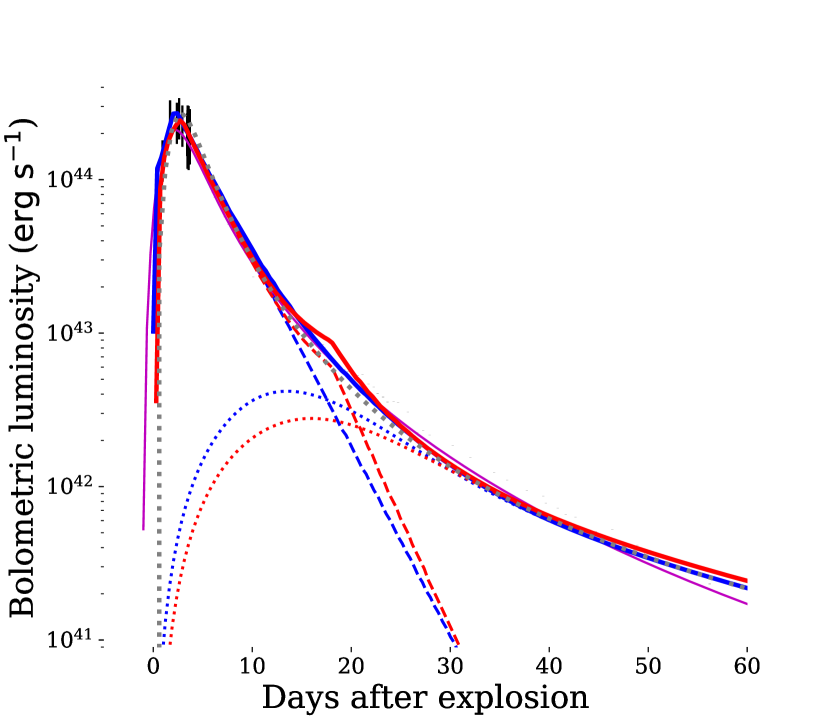
We construct the bolometric light curves by integrating the UV and optical flux (the UV data are taken from Perley et al., 2019), and then apply a model in which CSI is dominating the early time light curve. In order to constrain the fitting better, especially to obtain data before peak, we estimate the pre-peak bolometric luminosities based on the following assumptions: 1). the SED of AT2018cow is a blackbody; 2). the photometric temperature evolves as a power law , as we derived from the early temperature evolution. And then the bolometric luminosities before MJD 58288.44 are estimated using the single band photometry data. We adopt a hybrid model which includes 56Ni powering and the interaction of the SN ejecta with a dense CSM with density profile as a power-law, i. e. , where the typical value of s is 2 and 0 (e.g., Chatzopoulos et al., 2012, 2013; Wang et al., 2019). In our model, the density distribution of the ejecta is uniform in the inner region (=0), and follows a power-law () in the outer region. The early fast rising light curve of AT2018cow is mainly powered by CSI, while the slower declining tail is dominated by radioactive decay (RD) of 56Ni . We first consider the case of s=2, which corresponds to a steady-wind CSM. The best-fit light curve is shown in Fig. 10, and the fitted parameters are presented in Tab. 3. As shown in Fig. 10, our CSI+RD(s=2) model can fit the observations quite well. The mass loss rate of the progenitor star can be estimated as km s-1) yr-1, 1 yr-1 with 1000 km s-1. Margutti et al. (2019) also reach similar conclusion by analysing the optical and X-ray data. Such a mass loss rate is much higher than that found from the radio observations of AT2018cow ( yr-1) (Ho et al., 2019 had a similar conclusion). If we set limit on the mass loss rate, the model can hardly fit the observations. Thus, we claim that the early bright and fast evolving light curve of AT2018cow can not be produced by CSI with a steady stellar wind.
We then try the other case where s=0, i. e. the density of the CSM is a constant. The fitting result is shown in Fig. 10, and the fitted parameters are presented in Tab. 3. As shown in Fig. 10, with , , , the CSM+56Ni (s=0) model can also provide a plausible fit for the observed bolometric light curve. The inferred inner radius of the CSM gives a constraint on the radius of the progenitor star , which is consistent with the typical size of WR stars. The CSM shell extends outwards to a radius of cm (), implying that the CSM was formed shortly prior to the explosion. Such a CSM shell can be produced by an episodic mass ejection from the progenitor star, like a luminous blue variable (LBV) or from a common-envelope episode of a binary system. Combining the mass and velocity of the ejecta, the kinetic energy of the ejecta can be estimated as 6.6 erg, several times higher than that of the ordinary SNe Ibc and rather similar to the broad lined SNe Ic (SN Ic-BL) (Lyman et al., 2016), which are found to be possibly associated with long gamma ray bursts (e.g. SN 1998bw (Iwamoto et al., 1998; Nakamura et al., 2001)). The high velocity of the ejecta might be connected to a relativistic jet.
| … | s=0 | s=2 |
|---|---|---|
| MJD 58284.5 | MJD 58284.7 | |
| 3.16 | 1.69 | |
| aaThe dimensionless radius of the division between inner and outer region of ejecta. | 0.63 | 0.76 |
| (km s-1) | 26000 | 13600 |
| 0.23 | 0.14 | |
| 0.04 | 0.12 | |
| (cm)bbThe inner radius of CSM. | 2.11 | 1.03 |
| (cm)ccThe outer radius of CSM. | 8.70 | 3.16 |
| (g cm-3)ddThe CSM density at . | ||
| eeThe radiation efficiency. | 0.22 | 0.65 |
| 0.14 | 0.15 | |
| 0.015 | 0.014 |
Alternatively, the bolometric luminosity and effective temperature evolutions can be explained by a magnetar-powered model (Nicholl et al., 2017). Assuming that the opacities of ejecta are for the optical photon and for the magnetar wind, respectively, the best-fit parameters for this model are , , km s-1, ms and G, where and are the initial spin period and magnetic field strength of the nascent magnetar, respectively. We caution that the best-fit = 0.1 is the lower limit of the magnetar model in our fitting program. If no limit is given, the fitting tends to find a significantly lower value to fit the narrow light curve better. This may imply that the magnetar-powered model requires a rather low ejecta mass for AT2018cow.
6 Discussion: Progenitor Properties
In the previous section, we made analysis of the bolometric light curve of AT2018cow based on an assumption that it is a supernova origin. While we do not rule out other possibilities, especially the TDE origin. A main problem of the supernova origin for AT2018cow is that the process of an expanding photosphere is missing. In early phases, the photospheric velocity may be very high (0.1c) for AT2018cow in early phases. The photospheric radius keeps decreasing since very early time. This can be a clue for the interpretation as a TDE for AT2018cow. Although both Lyman et al. (2020) and Margutti et al. (2019) find no evidence of the connection between the site of AT2018cow and an IMBH. Nevertheless, one can notice that the measurements of photospheric radius start after the peak, probably suggesting that the expanding phase is not observed.
The magnetar-powered model can make a good fit to the bolometric light curve. The best-fit and of the central engine lies in the range of SLSNe (Lin et al., 2020 and references therein). Distinction between At2018cow and SLSNe is the evolution timescale, which is related to the ejecta mass. Nicholl et al. (2017) found with an average of 4.8. Besides, the low ejected mass () required by the magnetar model for AT2018cow is not likely favorable for a massive star, except for some really extreme cases. Some studies find that massive stars can be ultra-stripped by binary interaction with a compact neutron star (Tauris et al., 2015). But in these cases, little H or He remains in the progenitor system, which is not consistent with the observed spectral features of AT2018cow. Thus, we disfavor the magnetar model for AT2018cow.
Our CSI+RD(s=0) model makes a plausible fit to the bolometric light curve of AT2018cow. With , the progenitor star is most likely to be a compact WR star. The ejected mass (3) is lower than that predicted by single stellar evolution models (e.g., Georgy et al., 2012) but around the mean value of SNe Ibc (Lyman et al., 2016). This might be a result of binary interaction or episodic eruptive mass loss during the lifetime of massive stars. It is hard to derive the mass of the progenitor star simply from the ejecta mass, since the mass loss mechanisms of massive stars can be complicated and ambiguous.
In the case of s=0, the CSM can be dense shells formed by strong stellar winds of WR stars or an eruptive of LBV stars (Chevalier & Liang, 1989; Dwarkadas, 2011). According to our fitting result, with wind velocity of 100 km s-1, the eruption started several months before core-collapse, and was possibly still on when exploding. The average mass loss rate is 0.15 yr-1, or even higher if the wind velocity is higher, lying well in the range of LBV eruptions (Smith, 2014). Such mass loss behaviour can be found in some SNe IIn and SNe Ibn(Gal-Yam et al., 2007; Taddia et al., 2015; Pastorello et al., 2015b; Kiewe et al., 2012; Moriya et al., 2014a). Under this scenario, the progenitor of AT2018cow might be a massive star which is during eruptive state. However, with , the progenitor star is most likely to be H-poor or even He-poor, so is the CSM. While there is possibility that H and He are mixed into inner shells so that the progenitor can keep some H/He at core-collapse.
Meanwhile, binary interaction might dominate the evolution of massive stars, which are thought to be the progenitors of stripped envelope supernovae (SESNe). Mass loss can be quite efficient in binaries (Eldridge et al., 2017). SN 2006jc is a representative of interacting SNe originated from binary massive stars (Maund et al., 2016; Sun et al., 2020). In the binary scenario, the progenitors can be less massive stars, and the companion stars evolve slower so that they can keep their H/He envelopes. A common-envelope episode of a binary system can also form this dense CSM shell. The detection of H and He lines in the spectra of AT2018cow indicates that the CSM is not H-free. So it is quite possible that the CSM is from the companion star rather than the progenitor itself. The slightly redshifted peaks of the emission lines in the spectra of AT2018cow suggest asymmetry of the CSM, in favor of the common-envelope picture.
The progenitor star could be a very massive star which have experienced violent mass loss due to pulsational ejection. Recently Leung et al. (2020) has proposed a scenario based on a pulsational pair-instability supernova (PPISN) model, concluding that the rapidly evolving light curve of AT2018cow can be explained by a 42 He star exploding in a dense He-rich CSM ( ). The proposed model can fit the bolometric light curve well (at t<30 days). However, the presence of H lines in the spectra of AT2018cow is inconsistent with the assumption that both the ejecta and CSM formed around AT2018cow should be H-poor. Leung et al. (2020) tested different compositions of the CSM and found that the amount of H in the CSM only has slight effect on the bolometric light curve. Our fitting result is in agreement with Leung et al. (2020) in terms of the density and size of the CSM, but we find much lower CSM mass. We do not assume any Ni-mixing, while Leung et al. (2020) assumes that Ni is fully mixed into the outer layers of the ejecta. Nevertheless, both models may be plausible. Our model can correspond to a massive progenitor in a binary system, while Leung et al. (2020) requires a very massive star, whose zero-age-main-sequence (ZAMS) mass is 80 . It is worth noting that Leung et al. (2019) claims that a massive He core can only be formed under low metallicity (), which is inconsistent with our measurement of a solar-like metallicity environment for the progenitor of AT2018cow (see Sec. 4). This may imply that the progenitor of AT2018cow did not undergo PPI.
The fast evolving light curves of AT2018cow may be related to a very low ejecta mass, which is consistent with electron-capture supernovae (ECSNe) (Nomoto, 1984, 1987; Nomoto & Kondo, 1991; Moriya et al., 2014b). Stars with ZAMS mass of 8-12 form degenerate cores of O, Ne and Mg, which are susceptible to electron capture, leading to core collapse. For KSN 2015K, an example of FELTs, Rest et al. (2018) prefers a CSI model, while Tolstov et al. (2019) has found that the collapse of an ONeMg star surrounded by an optically thick CSM can also explain the fast rise of the light curve. However, the progenitors of ECSNe are thought to be super-AGB stars, which have stellar winds with relatively low velocities (10 km s-1). According to theoretical predictions, ECSNe are usually faint and have low explosion energies (e.g., Kawabata et al., 2010; Botticella et al., 2009 and a most recent study Hiramatsu et al., 2020). Thus, the ECSN scenario is unlikely for AT2018cow.
7 Summary
In this paper, we present our photometric and spectroscopic observations on the peculiar transient AT2018cow. The multi-band photometry covers from peak to 70 days and spectroscopy ranges from 5 to 50 days after discovery. The rapid rise (2.9 days), luminous light curves (20.8 mag) and fast post-peak decline make AT2018cow stand out of any other optical transients. After a thorough analysis, we find that the light curves and color evolution show high resemblances to some SNe Ibn. With detailed analysis of the spectral evolution and line identifications, we find that AT2018cow shows similar properties to the interacting SNe, like SNe IIn and SNe Ibn. Some broad emission lines due to HI, HeI, HeII, CIII, OI, and OIII emerge at days, with decreasing from km s-1 to 3000 km s-1 at the end of our observations. At days, narrow and weak He I lines ( 800-1000 km s-1) overlain on the broad lines. These emission lines are evidence of interaction between the ejecta and a H-rich CSM. Furthermore, we spotted the site of AT2018cow after it faded away and find that it has a solar-like metallicity. The host galaxy of AT2018cow has properties similar to those of GRBs and CCSNe, but is distinct from SLSNe and SNe Ia. High star formation rate at the site of AT2018cow implies that AT2018cow might originate from a massive star.
Based on the interpretation of a CSI supernova, we fit the bolometric light curves with CSI+RD models. We find that in order to produce the fast and bright early light curve of AT2018cow, the CSI model with a steady wind requires much larger mass loss rate than that derived from radio observations. While with a dense uniform CSM shell, the CSI+RD model can make plausible fit with best-fit parameters , , . Such a CSM shell can be formed by eruptive mass ejection of LBVs immediately before core-collapse or common envelope ejection in binaries. With , the progenitor is less likely to have undergone PPI. We conclude that the progenitor of AT2018cow is likely to be a less massive star in a binary system.
References
- Abolfathi et al. (2018) Abolfathi, B., Aguado, D. S., Aguilar, G., et al. 2018, ApJS, 235, 42
- Angus et al. (2016) Angus, C. R., Levan, A. J., Perley, D. A., et al. 2016, MNRAS, 458, 84
- Arcavi et al. (2016) Arcavi, I., Wolf, W. M., Howell, D. A., et al. 2016, ApJ, 819, 35
- Arnett (1982) Arnett, W. D. 1982, Astrophysical Journal, 253, 785
- Bianco et al. (2014) Bianco, F. B., Modjaz, M., Hicken, M., et al. 2014, ApJS, 213, 19
- Botticella et al. (2009) Botticella, M. T., Pastorello, A., Smartt, S. J., et al. 2009, MNRAS, 398, 1041
- Brown et al. (2014) Brown, P. J., Breeveld, A. A., Holland, S., Kuin, P., & Pritchard, T. 2014, Ap&SS, 354, 89
- Chatzopoulos et al. (2012) Chatzopoulos, E., Wheeler, J. C., & Vinko, J. 2012, ApJ, 746, 121
- Chatzopoulos et al. (2013) Chatzopoulos, E., Wheeler, J. C., Vinko, J., Horvath, Z. L., & Nagy, A. 2013, ApJ, 773, 76
- Chen et al. (2014) Chen, J., Wang, X., Ganeshalingam, M., et al. 2014, ApJ, 790, 120
- Chevalier & Liang (1989) Chevalier, R. A., & Liang, E. P. 1989, ApJ, 344, 332
- Chugai (2009) Chugai, N. N. 2009, MNRAS, 400, 866
- Curti et al. (2017) Curti, M., Cresci, G., Mannucci, F., et al. 2017, MNRAS, 465, 1384
- Drout et al. (2011) Drout, M. R., Soderberg, A. M., Gal-Yam, A., et al. 2011, ApJ, 741, 97
- Drout et al. (2014) Drout, M. R., Chornock, R., Soderberg, A. M., et al. 2014, ApJ, 794, 23
- Dwarkadas (2011) Dwarkadas, V. V. 2011, MNRAS, 412, 1639
- Ehgamberdiev (2018) Ehgamberdiev, S. 2018, Nature Astronomy, 2, 349
- Eldridge et al. (2017) Eldridge, J. J., Stanway, E. R., Xiao, L., et al. 2017, PASA, 34, e058
- Foley et al. (2007) Foley, R. J., Smith, N., Ganeshalingam, M., et al. 2007, ApJ, 657, L105
- Foley et al. (2003) Foley, R. J., Papenkova, M. S., Swift, B. J., et al. 2003, PASP, 115, 1220
- Fox & Smith (2019) Fox, O. D., & Smith, N. 2019, MNRAS, 488, 3772
- Fremling (2018) Fremling, C. 2018, The Astronomer’s Telegram, 11738, 1
- Gal-Yam et al. (2007) Gal-Yam, A., Leonard, D. C., Fox, D. B., et al. 2007, ApJ, 656, 372
- Galama et al. (1998) Galama, T. J., Vreeswijk, P. M., van Paradijs, J., et al. 1998, Nature, 395, 670
- Galbany et al. (2014) Galbany, L., Stanishev, V., Mourão, A. M., et al. 2014, A&A, 572, A38
- Georgy et al. (2012) Georgy, C., Ekström, S., Meynet, G., et al. 2012, A&A, 542, A29
- Guillochon et al. (2017) Guillochon, J., Parrent, J., Kelley, L. Z., & Margutti, R. 2017, ApJ, 835, 64
- Hicken et al. (2017) Hicken, M., Friedman, A. S., Blondin, S., et al. 2017, ApJS, 233, 6
- Hiramatsu et al. (2020) Hiramatsu, D., Howell, D. A., Van Dyk, S. D., et al. 2020, arXiv e-prints, arXiv:2011.02176
- Ho et al. (2019) Ho, A. Y. Q., Phinney, E. S., Ravi, V., et al. 2019, ApJ, 871, 73
- Hosseinzadeh et al. (2017) Hosseinzadeh, G., Arcavi, I., Valenti, S., et al. 2017, ApJ, 836, 158
- Howell (2017) Howell, D. A. 2017, Superluminous Supernovae, ed. A. W. Alsabti & P. Murdin, 431
- Huang et al. (2012) Huang, F., Li, J.-Z., Wang, X.-F., et al. 2012, Research in Astronomy and Astrophysics, 12, 1585
- Iwamoto et al. (1998) Iwamoto, K., Mazzali, P. A., Nomoto, K., et al. 1998, Nature, 395, 672
- Kawabata et al. (2010) Kawabata, K. S., Maeda, K., Nomoto, K., et al. 2010, Nature, 465, 326
- Kennicutt (1998) Kennicutt, Robert C., J. 1998, ARA&A, 36, 189
- Kiewe et al. (2012) Kiewe, M., Gal-Yam, A., Arcavi, I., et al. 2012, ApJ, 744, 10
- Kroupa (2001) Kroupa, P. 2001, MNRAS, 322, 231
- Kuin et al. (2019) Kuin, N. P. M., Wu, K., Oates, S., et al. 2019, MNRAS, 487, 2505
- Leung et al. (2020) Leung, S.-C., Blinnikov, S., Nomoto, K., et al. 2020, ApJ, 903, 66
- Leung et al. (2019) Leung, S.-C., Nomoto, K., & Blinnikov, S. 2019, ApJ, 887, 72
- Lin et al. (2020) Lin, W. L., Wang, X. F., Wang, L. J., & Dai, Z. G. 2020, ApJ, 903, L24
- Lyman et al. (2016) Lyman, J. D., Bersier, D., James, P. A., et al. 2016, MNRAS, 457, 328
- Lyman et al. (2020) Lyman, J. D., Galbany, L., Sánchez, S. F., et al. 2020, MNRAS, 495, 992
- Lyutikov & Toonen (2019) Lyutikov, M., & Toonen, S. 2019, MNRAS, 487, 5618
- Maraston & Strömbäck (2011) Maraston, C., & Strömbäck, G. 2011, MNRAS, 418, 2785
- Margutti et al. (2019) Margutti, R., Metzger, B. D., Chornock, R., et al. 2019, ApJ, 872, 18
- Mauerhan et al. (2013) Mauerhan, J. C., Smith, N., Filippenko, A. V., et al. 2013, MNRAS, 430, 1801
- Maund et al. (2016) Maund, J. R., Pastorello, A., Mattila, S., Itagaki, K., & Boles, T. 2016, ApJ, 833, 128
- Mazzali et al. (2008) Mazzali, P. A., Valenti, S., Della Valle, M., et al. 2008, Science, 321, 1185
- McKenzie & Schaefer (1999) McKenzie, E. H., & Schaefer, B. E. 1999, PASP, 111, 964
- Modjaz et al. (2009) Modjaz, M., Li, W., Butler, N., et al. 2009, ApJ, 702, 226
- Moriya et al. (2014a) Moriya, T. J., Maeda, K., Taddia, F., et al. 2014a, MNRAS, 439, 2917
- Moriya et al. (2014b) Moriya, T. J., Tominaga, N., Langer, N., et al. 2014b, A&A, 569, A57
- Nakamura et al. (2001) Nakamura, T., Mazzali, P. A., Nomoto, K., & Iwamoto, K. 2001, ApJ, 550, 991
- Nicholl et al. (2017) Nicholl, M., Guillochon, J., & Berger, E. 2017, ApJ, 850, 55
- Nomoto (1984) Nomoto, K. 1984, ApJ, 277, 791
- Nomoto (1987) —. 1987, ApJ, 322, 206
- Nomoto & Kondo (1991) Nomoto, K., & Kondo, Y. 1991, ApJ, 367, L19
- Pastorello et al. (2007) Pastorello, A., Smartt, S. J., Mattila, S., et al. 2007, Nature, 447, 829
- Pastorello et al. (2008a) Pastorello, A., Mattila, S., Zampieri, L., et al. 2008a, MNRAS, 389, 113
- Pastorello et al. (2008b) Pastorello, A., Quimby, R. M., Smartt, S. J., et al. 2008b, MNRAS, 389, 131
- Pastorello et al. (2015a) Pastorello, A., Tartaglia, L., Elias-Rosa, N., et al. 2015a, MNRAS, 454, 4293
- Pastorello et al. (2015b) Pastorello, A., Benetti, S., Brown, P. J., et al. 2015b, MNRAS, 449, 1921
- Pastorello et al. (2016) Pastorello, A., Wang, X. F., Ciabattari, F., et al. 2016, MNRAS, 456, 853
- Perley et al. (2019) Perley, D. A., Mazzali, P. A., Yan, L., et al. 2019, MNRAS, 484, 1031
- Planck Collaboration et al. (2016) Planck Collaboration, Ade, P. A. R., Aghanim, N., et al. 2016, A&A, 594, A13
- Prentice et al. (2018) Prentice, S. J., Maguire, K., Smartt, S. J., et al. 2018, ApJ, 865, L3
- Quimby et al. (2011) Quimby, R. M., Kulkarni, S. R., Kasliwal, M. M., et al. 2011, Nature, 474, 487
- Rest et al. (2018) Rest, A., Garnavich, P. M., Khatami, D., et al. 2018, Nature Astronomy, 2, 307
- Richmond et al. (1996) Richmond, M. W., van Dyk, S. D., Ho, W., et al. 1996, AJ, 111, 327
- Schlafly & Finkbeiner (2011) Schlafly, E. F., & Finkbeiner, D. P. 2011, ApJ, 737, 103
- Shivvers et al. (2016) Shivvers, I., Zheng, W. K., Mauerhan, J., et al. 2016, MNRAS, 461, 3057
- Smartt et al. (2015) Smartt, S. J., Valenti, S., Fraser, M., et al. 2015, A&A, 579, A40
- Smartt et al. (2018) Smartt, S. J., Clark, P., Smith, K. W., et al. 2018, The Astronomer’s Telegram, 11727
- Smith et al. (2012a) Smith, M., Nichol, R. C., Dilday, B., et al. 2012a, ApJ, 755, 61
- Smith (2014) Smith, N. 2014, ARA&A, 52, 487
- Smith et al. (2008) Smith, N., Foley, R. J., & Filippenko, A. V. 2008, ApJ, 680, 568
- Smith et al. (2012b) Smith, N., Mauerhan, J. C., Silverman, J. M., et al. 2012b, MNRAS, 426, 1905
- Smith et al. (2012c) Smith, N., Silverman, J. M., Filippenko, A. V., et al. 2012c, AJ, 143, 17
- Sollerman et al. (2000) Sollerman, J., Kozma, C., Fransson, C., et al. 2000, ApJ, 537, L127
- Sullivan et al. (2001) Sullivan, M., Mobasher, B., Chan, B., et al. 2001, ApJ, 558, 72
- Sun et al. (2020) Sun, N.-C., Maund, J. R., Hirai, R., Crowther, P. A., & Podsiadlowski, P. 2020, MNRAS, 491, 6000
- Svensson et al. (2010) Svensson, K. M., Levan, A. J., Tanvir, N. R., Fruchter, A. S., & Strolger, L. G. 2010, MNRAS, 405, 57
- Taddia et al. (2015) Taddia, F., Sollerman, J., Fremling, C., et al. 2015, A&A, 580, A131
- Taubenberger et al. (2006) Taubenberger, S., Pastorello, A., Mazzali, P. A., et al. 2006, MNRAS, 371, 1459
- Tauris et al. (2015) Tauris, T. M., Langer, N., & Podsiadlowski, P. 2015, MNRAS, 451, 2123
- Tody (1986) Tody, D. 1986, in Proc. SPIE, Vol. 627, Instrumentation in astronomy VI, ed. D. L. Crawford, 733
- Tody (1993) Tody, D. 1993, in Astronomical Society of the Pacific Conference Series, Vol. 52, Astronomical Data Analysis Software and Systems II, ed. R. J. Hanisch, R. J. V. Brissenden, & J. Barnes, 173
- Tolstov et al. (2019) Tolstov, A., Nomoto, K., Sorokina, E., et al. 2019, ApJ, 881, 35
- Tominaga et al. (2008) Tominaga, N., Limongi, M., Suzuki, T., et al. 2008, ApJ, 687, 1208
- Tsvetkov et al. (2015) Tsvetkov, D. Y., Volkov, I. M., & Pavlyuk, N. N. 2015, Information Bulletin on Variable Stars, 6140, 1
- Van Dyk et al. (2018) Van Dyk, S. D., Zheng, W., Brink, T. G., et al. 2018, ApJ, 860, 90
- Wang et al. (2019) Wang, L. J., Wang, X. F., Cano, Z., et al. 2019, MNRAS, 489, 1110
- Whitesides et al. (2017) Whitesides, L., Lunnan, R., Kasliwal, M. M., et al. 2017, ApJ, 851, 107
- Wilkinson et al. (2017) Wilkinson, D. M., Maraston, C., Goddard, D., Thomas, D., & Parikh, T. 2017, MNRAS, 472, 4297
- Xiang et al. (2019) Xiang, D., Wang, X., Mo, J., et al. 2019, ApJ, 871, 176
- Yokoo et al. (1994) Yokoo, T., Arimoto, J., Matsumoto, K., Takahashi, A., & Sadakane, K. 1994, PASJ, 46, L191
- Zhang et al. (2016) Zhang, K., Wang, X., Zhang, J., et al. 2016, ApJ, 820, 67
- Zhang et al. (2012) Zhang, T., Wang, X., Wu, C., et al. 2012, AJ, 144, 131