Chandra and HST Studies of Six Millisecond Pulsars in the Globular Cluster M13
Abstract
We analyse 55 ks of Chandra X-ray observations of the Galactic globular cluster M13. Using the latest radio timing positions of six known millisecond pulsars (MSPs) in M13 from Wang et al. (2020), we detect confident X-ray counterparts to five of the six MSPs at X-ray luminosities of (0.3-8 keV), including the newly discovered PSR JF. There are limited X-ray counts at the position of PSR JA, for which we obtain an upper limit . We analyse X-ray spectra of all six MSPs, which are well-described by either a single blackbody or a single power-law model. We also incorporate optical/UV imaging observations from the Hubble Space Telescope (HST) and find optical counterparts to PSR JD and JF. Our colour-magnitude diagrams indicate the latter contains a white dwarf, consistent with the properties suggested by radio timing observations. The counterpart to JD is only visible in the V band; however, we argue that the companion to JD is also a white dwarf, since we see a blackbody-like X-ray spectrum, while MSPs with nondegenerate companions generally show non-thermal X-rays from shocks between the pulsar and companion winds. Our work increases the sample of known X-ray and optical counterparts of MSPs in globular clusters.
keywords:
stars: neutron – pulsars: general – globular clusters: individual: NGC 6205 – X-rays: stars1 Introduction
Radio millisecond pulsars (MSPs), also known as rotation-powered MSPs, are fast-spinning pulsars (spin periods ms) with low spin-down rates (), implying large characteristic ages Gyr, and relatively low magnetic field strengths G. Low-mass X-ray binaries (LMXBs) are conventionally considered the progenitors of MSPs, where a neutron star (NS) is spun up by accreting material from its companion star until it has a rotational period of a few milliseconds (Alpar et al., 1982; Bhattacharya & van den Heuvel, 1991). The high stellar densities of globular clusters (GCs) create numerous LMXBs, which then produce MSPs, and hence GCs provide ideal places to observe them in large numbers (Camilo & Rasio, 2005). To date, the total number of pulsars found in 30 GCs is 157, and more than 90% of them are MSPs111For an up-to-date catalog of pulsars in GCs, see http://www.naic.edu/~pfreire/GCpsr.html.
MSPs are mostly found in binary systems, which is consistent with the evolution of MSPs via LMXBs. The so-called “spider” MSP binaries represent a distinct group of MSP binary systems with low-mass nondegenerate companion stars. Specifically, spider binaries are classified into two groups based on the companion masses: black widows with companion masses , and redbacks with companion masses (Roberts, 2011). Alternatively, MSPs may be coupled with compact objects, such as helium-core white dwarfs (WDs), which are the most common companions to MSPs in GCs (e.g. Camilo & Rasio, 2005). MSPs coupled with another neutron star or even a detected radio pulsar have been discovered in a few systems, like PSR J (Burgay et al., 2003).
Radio MSPs are also faint X-ray emitters, with typical luminosities of . For a few relatively young and energetic MSPs, like PSR B182124, the X-ray luminosities can reach up to (e.g. Bogdanov et al., 2011a). The X-rays produced by MSPs can be characterized based on their spectral properties, namely thermal (blackbody-like spectra) or non-thermal (power-law spectra) emission (Becker & Trümper, 1999; Bogdanov, 2018). Thermal X-ray emission is believed to be generated from the hot surface of the NS, specifically from the hot spots near the magnetic polar caps, heated by the return flow of relativistic particles from the pulsar magnetosphere (e.g. Harding & Muslimov, 2002). Non-thermal X-ray emission can be further categorized into two sub-groups, i.e. pulsed and non-pulsed non-thermal emission. Pulsed non-thermal X-rays are observed with narrow X-ray pulsations, implying highly beamed X-ray radiation, which is most likely produced in the pulsar magnetosphere (Verbunt et al., 1996; Saito et al., 1997; Takahashi et al., 2001). Therefore, only very energetic MSPs with relatively strong spin-down luminosities could emit such X-ray radiation (e.g. Possenti et al., 2002). Non-pulsed non-thermal X-ray emission is commonly detected from spider pulsar systems, where the relativistic pulsar wind may collide with the material from its companion star, creating an intra-binary shock and emitting non-pulsed, non-thermal X-rays (e.g. Arons & Tavani, 1993; Stappers et al., 2003; Bogdanov et al., 2005; Gentile et al., 2014; Roberts et al., 2015).
The globular cluster M13 (NGC 6205) is located in the constellation of Hercules, with a low foreground reddening of (Harris, 1996, 2010 edition). The distance is slightly uncertain, with a range of reported values (mostly isochrone fitting to the colour-magnitude diagram, but also using RR Lyrae variables and the tip of the red giant branch) from 7.1 kpc (Deras et al., 2019; Harris, 1996, (2010 revision)) to 7.9 kpc (Barker & Paust, 2018; Sandquist et al., 2010). We use the distance of 7.4 kpc from the recent comprehensive study of Gontcharov et al. (2020) in this work. Should the true distance lie at 7.1 or 7.9 kpc, then values of luminosities in this paper would change by up to 10%.
To date, six MSPs have been found in M13 by several radio surveys (Kulkarni et al., 1991; Anderson, 1993; Hessels et al., 2007; Wang et al., 2020). PSRs JA (hereafter MSP A) and JC (hereafter MSP C) are isolated, while the other four MSPs are in binary systems. Specifically, PSR JE (MSP E) is found in an eclipsing black widow system, with a minimum companion mass of (Wang et al., 2020). The nature of the companions for PSRs JB (MSP B), JD (MSP D), and JF (MSP F) is not clear so far. New, precise radio timing solutions for the six MSPs in M13 were reported recently by Wang et al. (2020) using Five-hundred-meter Aperture Spherical radio Telescope (FAST) observations.
In this paper, we present X-ray spectral analyses of the six MSPs in M13 using archival Chandra observations. We also investigate the optical counterparts to those MSPs in binary systems, based on observations from the Hubble Space Telescope (HST). This work is organized as follows. In section 2, we describe the observations and data reduction procedures. In section 3, we present the X-ray spectral fitting results for the six MSPs, and the search for counterparts to the MSPs in optical/UV bands. We discuss the X-ray spectral properties and the nature of the companion stars in section 4. Finally, we draw conclusions in section 5.
2 Observation and data reduction
2.1 Chandra observations
The X-ray data used in this work consists of two Chandra X-ray Observatory observations of M13 in 2006, with a total exposure time of 54.69 kiloseconds (see Table 1). For both observations, the core of M13 was positioned on the back-illuminated ACIS-S3 chip and configured in FAINT mode.
| Telescope/ | Date of | Observation | Exposure |
|---|---|---|---|
| Instrument | Observation | ID | Time (ks) |
| Chandra/ACIS-S | 2006 Mar 09 | 7290 | 27.9 |
| Chandra/ACIS-S | 2006 Mar 11 | 5436 | 26.8 |
The data reduction and analysis were performed using ciao222Chandra Interactive Analysis of Observations, available at https://cxc.harvard.edu/ciao/ (version 4.12, CALDB 4.9.1, Fruscione et al. 2006). We first reprocessed the data with the chandra_repro script to generate new level 2 event files of the observations, applying the newest calibration updates and bad pixel files. We filtered the data to the energy range 0.57 keV, where the X-ray emission from MSPs may dominate over the instrumental background. No background flares were seen in the Chandra data.
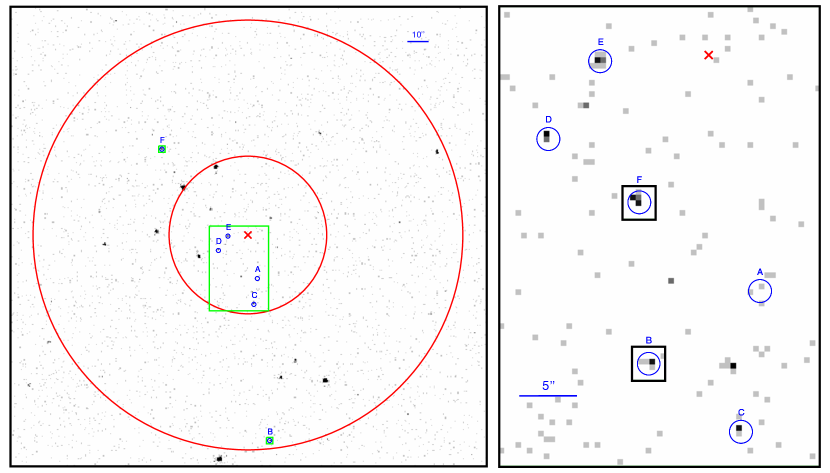
We created a co-added image of M13 by merging the event files from the two observations using reproject_obs script. In Figure 1, the positions of the six MSPs are marked by blue circles with 1 radii, centered on the precise radio pulsar timing positions (Wang et al., 2020). Other brighter X-ray sources are also visible in this image, including a quiescent low-mass X-ray binary (Shaw et al., 2018) and cataclysmic variables (e.g. Servillat et al., 2011). We formally detected the X-ray counterparts to most of the MSPs by applying the ciao tool wavdetect, a Mexican-Hat Wavelet source detection tool (Freeman et al., 2002). We specified the wavelet scales (a list of radii in pixels) of 1.0, 1.4, and 2.0, and a significance threshold for source detection of (false sources per pixel). Consequently, five X-ray counterparts were detected, all but MSP A, with positions consistent with the radio positions.
To analyse the X-ray spectra of the MSPs, we extracted the emission from the circular regions with a radius of 1 centered on the radio positions in energy band 0.57 keV (Figure 1) for each MSP, using the specextract script. The extraction process was performed separately for each observation, and then we used the combine_spectra script to co-add the spectra correspondingly for each pulsar to obtain the combined spectra for spectral analysis. The background was taken from source-free annular regions around the MSPs.
2.2 Optical observations
We use imaging data taken by the Wide Field Camera 3 (WFC3; GO-12605) and Advanced Camera for Surveys (ACS; GO-10775) on board the HST. GO-12605 (PI: Piotto) contains exposures in two UV filters, F275W () and F336W (), along with an exposure in F438W (); while GO-10775 (PI: Sarajedini) is comprised of exposures in (F606W) and (F814W). For all filters, we retrieved the FLC data products from the Mikulsky Archive for Space Telescope (MAST)333https://archive.stsci.edu/hst/search.php; these are images that have been pipe-lined, flat-fielded, and have charge transfer efficiency trails removed. Detailed information on these observations is summarised in Table 2.
To search for faint potential counterparts to the MSPs, we use the drizzlepac software (version 3.1.6)444https://www.stsci.edu/scientific-community/software/drizzlepac to generate combined HST images. FLC files in each filter are first re-aligned by the TweakReg tool to a reference image (chosen to be the longest FLC exposure) and then combined using the AstroDrizzle tool. AstroDrizzle corrects for geometric distortion, flags cosmic rays and small-scale detector defects, and combines images with user-defined re-sampling. We use and oversample the combined images by a factor of two, so the final images have half the original pixel scales (/pixel for WFC3, /pixel for ACS).
Starting from December 2019, MAST released updated absolute astrometry information for ACS and WFC3 data. Most FLC data products are now aligned to the Gaia DR2 catalogue, reducing the astrometric uncertainties to 555https://archive.stsci.edu/contents/newsletters/may-2020/new-absolute-astrometry-for-some-hst-data-products. The observed M13 fields contain stars included in Gaia DR2, so we use the default WCS information to set our absolute astrometry.
| GO | Exposure (s) | Observation Start | Instrument | Filter |
|---|---|---|---|---|
| 10775 | 567 | 2006-04-02 10:41 | ACS/WFC | F606W () |
| 10775 | 567 | 2006-04-02 12:15 | ACS/WFC | F814W () |
| 12605 | 1281 | 2012-05-14 01:52 | WFC3/UVIS | F275W () |
| 12605 | 1281 | 2012-05-17 03:54 | WFC3/UVIS | F275W () |
| 12605 | 700 | 2012-05-14 02:24 | WFC3/UVIS | F336W () |
| 12605 | 700 | 2012-05-17 04:48 | WFC3/UVIS | F336W () |
| 12605 | 92 | 2012-05-14 01:49 | WFC3/UVIS | F438W () |
| 12605 | 92 | 2012-05-17 03:26 | WFC3/UVIS | F438W () |
3 Data analysis and results
3.1 X-ray spectral fits
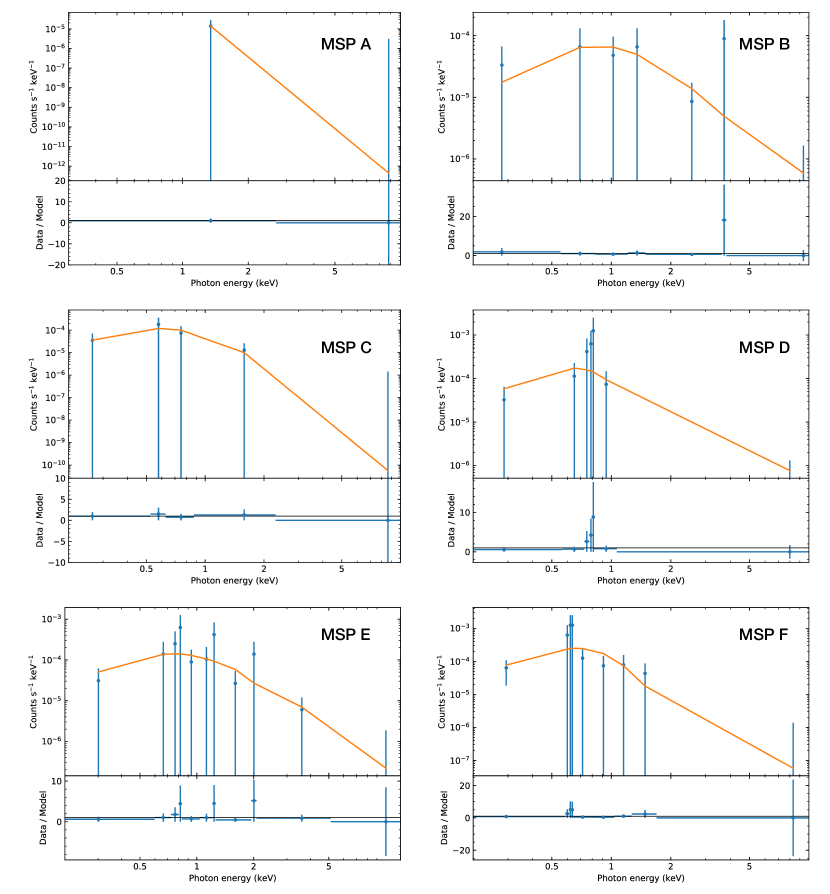
We performed all spectral fits using ciao’s modeling and fitting application, Sherpa666Available at https://cxc.cfa.harvard.edu/sherpa/. X-ray emission from MSP A was only detected in the latter observation (Obs ID: 5436) with just two photons. We cannot determine whether the two photons originated from MSP A, or are just background emission. However, we fitted the spectrum of MSP A, and set the obtained fits as the upper limits, finding erg s-1. The other five MSPs in M13 (MSPs B, C, D, E, and F) show faint and relatively soft X-ray emission (Figure 2), with X-ray luminosities erg s-1. We adopted the WSTAT statistic777See https://heasarc.gsfc.nasa.gov/xanadu/xspec/manual/XSappendixStatistics.html for more details., a Poisson log-likelihood function including a Poisson background, within Sherpa to fit X-ray spectra with few photons. In addition, we grouped the data to include at least one photon in each bin due to the limited number of photons (Humphrey et al., 2009). For all six detected MSPs, we fitted the spectra by fixing the hydrogen column density () to the cluster. We estimated from the known reddening (Harris, 1996, 2010 edition) and an appropriate conversion factor (Bahramian et al., 2015) and obtained a value of , given that interstellar extinction generally gives the best predictions of (He et al., 2013).
We considered spectral models of the X-ray emission from MSPs (Bogdanov et al., 2006) involving a blackbody (BB), a power-law (PL), and combinations of these. For the BB model, we used the xsbbodyrad model in Sherpa, and the free parameters were the effective temperature and the normalized radius. The PL model was fitted using xspegpwrlw, with the photon index and flux as free parameters. Figure 2 shows the X-ray spectra and best fits of the six MSPs, and the best-fit models and parameters are given in Table 3. We used the Q-value, which is a measure of what fraction of simulated spectra would have a larger value of the reduced statistic than the observed one, if the assumed model and the best-fit parameters are true, to indicate the goodness of the fits. The Q-values in Table 3 are above 0.05, indicating that these are reasonable fits and hence the Q-values themselves did not rule out any models.
The spectra of all six MSPs in M13 are well described by either a pure BB model or a pure PL model. (We tested BB+PL and BB+BB models, but these did not give better fits, so we only discuss simple one-component fits henceforth.) Although we cannot rule out either model from Q-values alone, other fitting parameters, like effective temperature and photon index, provide reasons to exclude models. For instance, if we fit the spectra of MSPs C, D, and F using a PL model, the obtained photon indices are nearly 4, which are empirically not observed from MSPs, given the typical photon indices of MSPs (e.g. Zhang & Cheng, 2003; Bogdanov et al., 2006; Bogdanov et al., 2011a). Similarly, if we fit MSPs B and E using a single BB model, the fitted effective temperatures are too high while the fitted effective radii are too small for MSPs, compared to other MSPs in GCs (e.g. Bogdanov et al., 2006; Forestell et al., 2014), and hence we can rule out the BB model for these two MSPs. Alternatively, the spectra of MSPs B and E are well described by a pure power-law model, with spectral photon indices and , respectively. Given that MSP E is a “black widow” pulsar, the bulk of its observed non-thermal X-rays are likely to be produced by interaction of the relativistic particle wind from the pulsar with matter lost from the companion. MSPs C, D, and F have X-ray spectra well fitted with a pure blackbody spectrum, implying no or little X-ray emission from a pulsar magnetosphere and/or intra-binary shock. Blackbody-like X-ray spectra are common from MSPs (e.g. Bogdanov et al., 2006), and likely originate from small hot spots at the magnetic poles heated by relativistic particles in the pulsar magnetosphere (e.g. Harding & Muslimov, 2002).
Particularly, since we only have two photons from MSP A, we need to fix one more parameter to obtain at least one degree of freedom. In order to determine the upper limit of the luminosity of MSP A, we fixed the effective temperature and photon index for the BB and PL models in the fitting processes, respectively. The value of the fixed was obtained by averaging the fitted of MSPs C, D, and F, giving a value of K, while the fixed was given by the mean value of photon indices of MSPs B and E, providing (see Table 3). Both models gave an upper limit of X-ray luminosity of (0.38 keV).
| MSP | Spectral Model | Photon Index | Reduced Stat/Q-value | (0.38 keV) | ||
|---|---|---|---|---|---|---|
| (km) | ( K) | ( erg cm-2 s-1) | ||||
| A | BB | 0.09/0.77 | ||||
| PL | 0.31/0.58 | |||||
| B | BB | 1.55/0.17 | ||||
| PL | 1.11/0.35 | |||||
| C | BB | 0.23/0.88 | ||||
| PL | 0.29/0.83 | |||||
| D | BB | 1.42/0.21 | ||||
| PL | 2.05/0.07 | 1.3 | ||||
| E | BB | 0.07f | 0.84/0.58 | |||
| PL | 0.75/0.67 | |||||
| F | BB | 0.94/0.48 | ||||
| PL | 1.04/0.40 | 2.0 |
3.2 Optical/UV photometry
We use the dolphot software (version 2.0) to generate photometry catalogues for the WFC3 and ACS images. dolphot is a photometry package based on HSTphot (Dolphin, 2000) which provides pipelines to perform aperture and PSF photometry on individual FLC images. We first choose the and drizzle-combined images888Note that the drizzle-combined images used here are in their native pixel scales. as the reference frames for WFC3 and ACS, on which dolphot runs a detection algorithm to find stars. The reference images also provide master coordinates () to which stars on individual FLC frames are transformed. In the next step, we mask the flagged bad pixels in all FLC images using the wfc3mask and acsmask tools. These tools also multiply the FLC images and the pixel areas, converting the pixel units to electrons. The final photometry routine runs on separate CCD chips, which are extracted from the FLC images by the splitgroups tool. These chip-specific images are also needed for the calcsky tool to create corresponding sky images. With all these preparations, we finally run the dolphot routine for WFC3 and ACS, adapting a photometry aperture (, in pixels) of , and a PSF radius (, in pixels) of , while defining a sky annulus (, in pixels) with inner and outer radii of and , respectively, for PSF photometry. The final magnitudes are calibrated to the VEGMAG system using updated photometry zeropoints for ACS999https://acszeropoints.stsci.edu/ (Sirianni et al., 2005) and WFC3101010https://www.stsci.edu/hst/instrumentation/wfc3/data-analysis/photometric-calibration/uvis-photometric-calibration.
We keep stars with S/N>5 and rule out non-star objects, leaving cleaned catalogues to make colour-magnitude diagrams (CMDs; Figure 3, 4). These catalogues are used to compare the potential counterpart’s photometry with the bulk of stars of the cluster.
3.3 Optical/UV counterparts
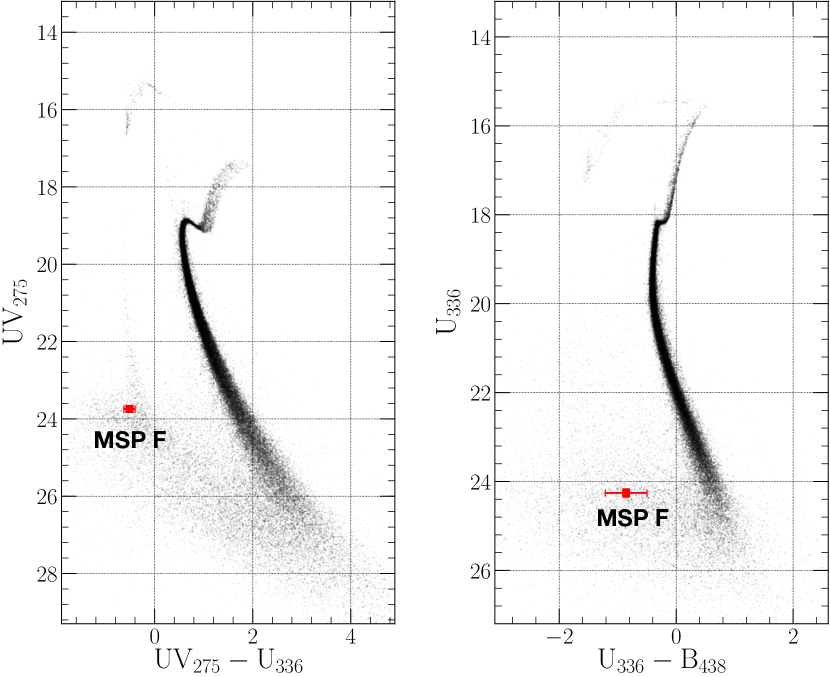
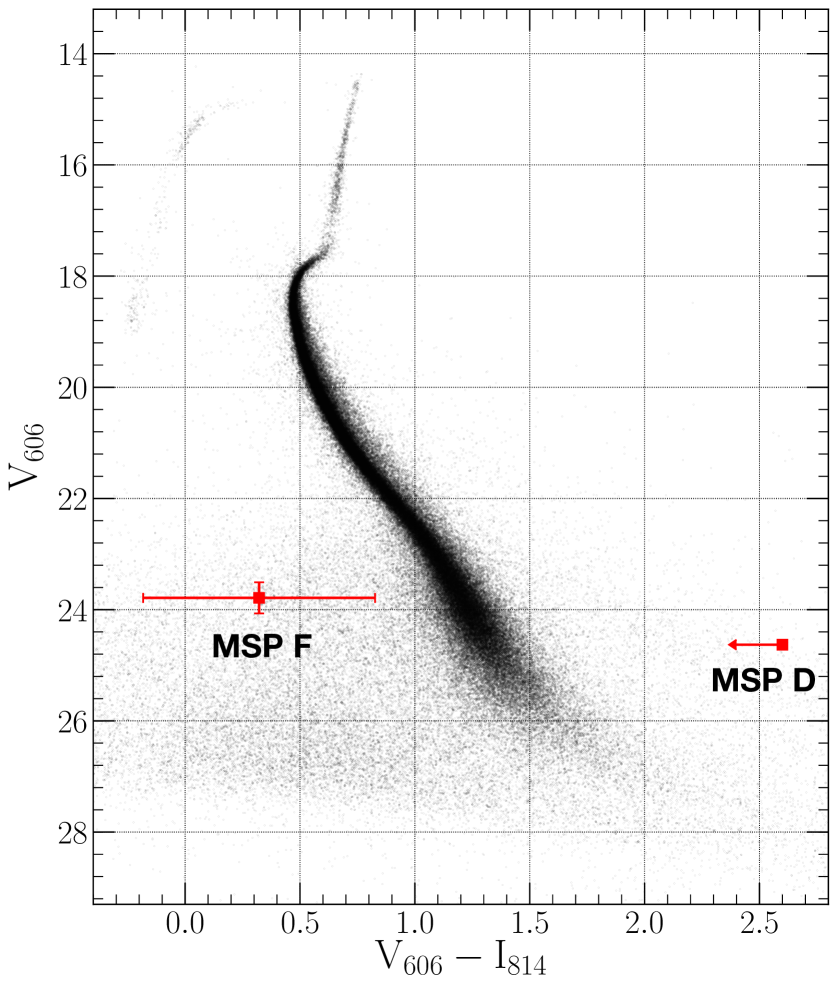
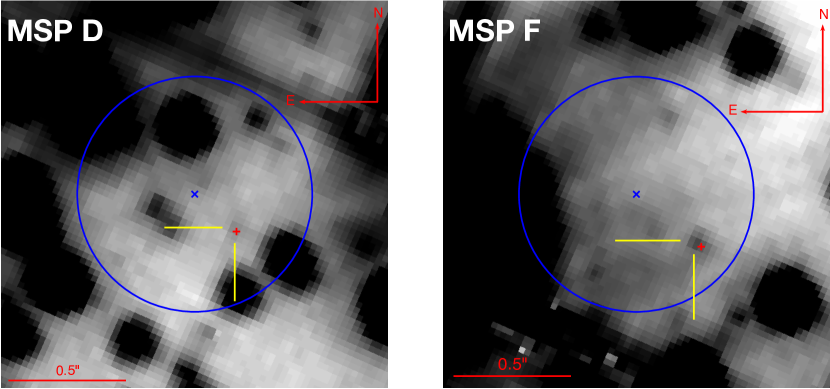
Since the radio timing solution provides much more accurate localisation (; Wang et al. 2020) than the Chandra imaging (error radius ), we expect potential counterparts in the vicinity of the corresponding radio position. We therefore search around the radio timing positions for optical counterparts in the drizzle-combined images; this leads to the discovery of optical/UV counterparts to two of the 6 MSPs: MSP D and F, both of which are very close () to the radio positions. We report their photometric properties in the following paragraphs.
3.3.1 MSP D
The counterpart to MSP D is a faint star north from the radio timing position (Figure 5). Although the counterpart is visible by visual inspection in the -band image (Figure 5), it was not measured by dolphot. We hereby make a rough estimate of its magnitude by performing aperture photometry, using an aperture of to enclose most of the PSF of the star. Since the counterpart is in the vicinity of a very bright star, we also estimate background counts with the same aperture size in a nearby source-free region. The background-subtracted counts are then calibrated to dolphot magnitude by , giving . We set a lower limit on the band magnitude at times the local background counts, which gives . The upper limit on the colour is on the red side of the main sequence.
3.3.2 MSP F
We found a faint star east from the radio timing position (Figure 5). The counterpart to MSP F appears to be bluer than the main sequence on all three CMDs (Figure 3, 4), and overlaps the white dwarf cooling sequence on the CMD. This is expected in MSPs descended from binary evolution with a giant companion (e.g., Stairs, 2004), wherein the NS exhausts the companion’s envelope via continued mass accretion, resulting in a WD companion (e.g., Sigurdsson et al., 2003; Splaver et al., 2005; Cadelano et al., 2019). After submission of this manuscript, we became aware of Cadelano et al. (2020), which independently identified the optical counterpart to the MSP M13 F, and used photometry in additional HST filters to characterize the companion as a 0.23 He-core white dwarf. Our optical counterpart analysis is consistent with theirs, though not as constraining.
3.3.3 Chance coincidence
We estimate the number of chance coincidences () by dividing the cluster field into concentric annuli centered on the cluster, and calculating the probability of a coincidence within our search area. The radio position offers a much smaller search area than the X-ray position, so we use the radio error circle to assess the chance coincidence rate. The uncertainty in the radio position comes from the uncertainty in the radio timing position from Wang et al. (2020), which we estimate to be 3 mas at most (noting that the uncertainty in declination is missing from M13 F in Wang et al. 2020’s Table 2), and from the uncertainty in HST’s absolute astrometry (10 mas, see §2.2), giving a total uncertainty in the radio position in the HST frame of 10 mas.
Based on the CMD, we count numbers of objects that align with the main sequence and the white dwarf sequence within each annulus. We did not apply proper-motion cleaning to the CMD, since we are comparing the estimated counts to actual observed numbers of sources in each search area. The counts are then divided by the annulus areas to give the per unit area, which is then multiplied by the search area of MSP D and MSP F (10 mas of radius) to give the per search area. We estimate 0.001 main sequence stars within the search region of MSP D, and WDs in the search region of MSP F. Both counterparts to these MSPs are therefore very unlikely to be chance coincidences.
4 Discussion
The majority of X-ray emission from most isolated MSPs is thermal radiation with blackbody-like spectra (e.g. Bogdanov et al., 2006; Forestell et al., 2014), which is believed to result from polar cap heating from inverse Compton scattering (e.g. Harding & Muslimov, 2002). The observed spectrum of MSP C is a typical example of those of isolated MSPs. However, some relatively young MSPs with high spin-down power, like B182124 in the globular cluster M28 (Saito et al., 1997; Bogdanov et al., 2011a), produce pulsed non-thermal radiation generated by relativistic particles accelerated in the pulsar magnetosphere.
Intriguingly, given the upper limit of X-ray luminosity of (0.38 keV), MSP A is unusually faint, compared to other GC MSPs. We compare it to MSPs detected in Chandra X-ray observations that reached a sensitivity limit of . Only one MSP among 23 studied in X-rays in 47 Tuc (Bogdanov et al., 2006; Ridolfi et al., 2016; Bhattacharya et al., 2017), namely PSR Jaa (Bhattacharya et al., 2017), and one MSP among the five MSPs in NGC 6752, namely PSR J19105959E (Forestell et al., 2014), have X-ray luminosities slightly less than that upper limit of MSP A. Bogdanov et al. (2011a) study 12 MSPs in M28, and report detections of 8 MSPs with between for M28 D, and for M28 A, with three upper limits due to confusing, brighter sources. 111111Bogdanov et al. (2011a) report an upper limit for M28 I, but the position of M28 I used there proved to be incorrect, and the true of M28 I in its pulsar mode is Papitto et al. (2013); Linares et al. (2014). Four other nearby globular clusters have deep X-ray and radio observations, with known MSPs: M22, NGC 6397, M71, and M4. Those four clusters each contain one, brighter, MSP (Grindlay et al., 2001; Bassa et al., 2004; Elsner et al., 2008; Amato et al., 2019). Thus, among 47 detectable MSPs in these eight well-studied clusters, MSP A is one of the faintest four in X-rays (along with 47 Tuc aa, NGC 6752 E, and M28 D), and possibly the faintest. We cannot rule out either X-ray spectral model, by either Q-values or the fitted parameters, for MSP A. We prefer, however, the BB model, as MSP A is an isolated MSP. MSP A may have a relatively small spindown power, producing its relatively small X-ray luminosity. We cannot calculate its characteristic age or spindown power, due to its acceleration within the gravitational potential of M13, which produces an observed negative spin period derivative. Alternatively, MSP A may appear to have a low X-ray luminosity due to an unfavorable inclination of its spin axis with respect to Earth, with one or both hot spots on the far side from Earth (Riley et al. 2019 and Miller et al. 2019 showed that PSR J0030+0451 has both hot spots in a single hemisphere).
MSPs B, D, E, and F are in binary systems, with orbital periods ranging from 0.1 to 1.4 days (Wang et al., 2020). The X-ray spectra of MSPs B and E are well described by a pure power-law model, indicating that the X-rays from them are predominantly non-thermal. Non-pulsed non-thermal emission is anticipated for MSP E, since it has been identified as an eclipsing black widow pulsar. In eclipsing spider pulsar systems, X-rays are thought to originate from intra-binary shocks, driven by the interaction of the relativistic pulsar wind with matter from its companion star (e.g. MSPs J00237203J and J00247204W in 47 Tuc, Bogdanov et al., 2006). Particularly, intra-binary shock emission with orbital modulation has been observed in many spider pulsar binaries (e.g. Bogdanov et al., 2011b; Gentile et al., 2014; Al Noori et al., 2018).
The nature of the companion star of MSP B, which is in a 1.39-day orbit and has a minimum mass of 0.16 (assuming a pulsar mass of , Wang et al., 2020), is not clear yet. The best-fit spectral model (a power-law of photon index 1.8) requires either a magnetospheric origin (and thus a relatively high spindown energy loss rate to produce this), or an intrabinary shock origin, in which case (given the companion mass) MSP B would be a redback system. We consider the 21 MSPs in the globular cluster 47 Tuc with X-ray spectra that can be individually fit (Bogdanov et al., 2006; Ridolfi et al., 2016; Bhattacharya et al., 2017). The 17 systems that are not black widows and redbacks are all best fit by thermal blackbody spectra, while two of the three black widows (47 Tuc J,O,R), and the redback (47 Tuc W) all showed dominant power-law components to their spectra. Thus, it seems likely that MSP B is a redback system. No eclipses were detected in the radio observations of MSP B (Wang et al., 2020), which could be due to a relatively low inclination, as observed in the black widows 47 Tuc I and P (Freire et al., 2003). As intra-binary shocks are expected to emit X-rays in all directions (though not isotropically), the non-thermal X-rays may be detected at any inclination.
The optical counterparts to MSPs D and F were found with HST observations (Figure 5). According to the position of the counterpart to MSP F on the CMDs of M13 (Figure 3), as well as the minimum companion mass of , a white dwarf is the most likely companion star of MSP F. We also found a plausible optical counterpart to MSP D, which is only detected in the V band. We cannot identify the nature of MSP D’s companion star definitively, due to its very faint magnitude leading to a large uncertainty of its location on the CMD (see Figure 4). The observed magnitudes are consistent with the rather broad expectations of MSP white dwarf companions (van Kerkwijk et al., 2005).
The X-ray spectrum of MSP D is well described by a pure blackbody model, implying that emission from the neutron star surface dominates, and that there is no intra-binary shock. Since all known redback binary systems show hard non-thermal X-ray emission (Bogdanov, 2018), this indicates that MSP D is probably not in a redback binary. With a minimum companion mass of , we suggest that the companion star of MSP D is also a helium-core white dwarf.
5 Conclusions
In this report, we have presented X-ray and optical studies of the six MSPs in the globular cluster M13 by using archival Chandra and HST observations. Five of the six MSPs are firmly detected (MSPs B, C, D, E, and F) by Chandra, with X-ray luminosities erg s-1 (0.38 keV), while MSP A is plausibly detected with an upper limit in X-ray luminosity of . The uncommonly X-ray-faint properties of MSP A may imply that one or both its hot spots are on the far side from Earth.
The X-ray spectra of the six MSPs are well-described by either a single blackbody or a single power-law model. As expected, the spectra of two isolated MSPs, MSPs A and C, are well fitted by a pure blackbody model, indicating thermal X-ray emission from the surface of these two objects. The identified black widow binary system, MSP E (Hessels et al., 2007; Wang et al., 2020), emits principally non-thermal X-rays which are likely generated from intra-binary shock. Similarly, the X-ray emission from MSP B, a binary system with a companion of mass (Wang et al., 2020), is non-thermal as well. Based on its non-thermal spectral properties and companion mass, we suggest MSP B is a redback binary system.
We searched for the optical counterparts to the four MSP binary systems in M13 using HST archival data in the vicinity of the respective radio timing positions, and discovered optical counterparts to MSPs D and F. The position of the counterpart to MSP F on color-magnitude diagrams shows that the companion star is most likely a white dwarf. The counterpart to MSP D is faint and only observed in V band, resulting in a large uncertainty of its position on color-magnitude diagrams. However, given MSP D’s blackbody-like X-ray spectrum and companion mass of (Wang et al., 2020), we argue that the counterpart to MSP D is also likely to be a helium-core white dwarf. To our knowledge, this is the first use of the X-ray properties of a radio millisecond pulsar to predict the nature of its companion star.
Acknowledgements
COH acknowledges support from NSERC Discovery Grant RGPIN-2016-04602. This research has made use of data obtained from the Chandra Data Archive and the Chandra Source Catalog, and software provided by the Chandra X-ray Center (CXC) in the application packages CIAO and Sherpa. This research has made use of NASA’s Astrophysics Data System. This research is based on observations made with the NASA/ESA Hubble Space Telescope obtained from the Space Telescope Science Institute, which is operated by the Association of Universities for Research in Astronomy, Inc., under NASA contract NAS 5–26555.
Data availability
The Chandra data used in this paper are available in the Chandra Data Archive (https://cxc.harvard.edu/cda/) by searching the Observation ID listed in Table 1 in the Search and Retrieval interface, ChaSeR (https://cda.harvard.edu/chaser/). The HST data used in this work can be retrieved from the Mikulski Archive for Space Telescope (MAST) Portal (https://mast.stsci.edu/portal/Mashup/Clients/Mast/Portal.html) by searching the proposal IDs listed in Table 2.
References
- Al Noori et al. (2018) Al Noori H., et al., 2018, ApJ, 861, 89
- Alpar et al. (1982) Alpar M. A., Cheng A. F., Ruderman M. A., Shaham J., 1982, Nature, 300, 728
- Amato et al. (2019) Amato R., D’Aı A., Del Santo M., de Martino D., Marino A., Di Salvo T., Iaria R., Mineo T., 2019, MNRAS, 486, 3992
- Anderson (1993) Anderson S. B., 1993, PhD thesis, California Institute of Technology, Pasadena.
- Arons & Tavani (1993) Arons J., Tavani M., 1993, ApJ, 403, 249
- Bahramian et al. (2015) Bahramian A., Heinke C. O., Degenaar N., Chomiuk L., Wijnands R., Strader J., Ho W. C. G., Pooley D., 2015, MNRAS, 452, 3475
- Barker & Paust (2018) Barker H., Paust N. E. Q., 2018, PASP, 130, 034204
- Bassa et al. (2004) Bassa C., et al., 2004, ApJ, 609, 755
- Becker & Trümper (1999) Becker W., Trümper J., 1999, A&A, 341, 803
- Bhattacharya & van den Heuvel (1991) Bhattacharya D., van den Heuvel E. P. J., 1991, Phys. Rep., 203, 1
- Bhattacharya et al. (2017) Bhattacharya S., Heinke C. O., Chugunov A. I., Freire P. C. C., Ridolfi A. r., Bogdanov S., 2017, MNRAS, 472, 3706
- Bogdanov (2018) Bogdanov S., 2018, in Weltevrede P., Perera B. B. P., Preston L. L., Sanidas S., eds, IAU Symposium Vol. 337, Pulsar Astrophysics the Next Fifty Years. pp 116–119 (arXiv:1711.04791), doi:10.1017/S1743921317011553
- Bogdanov et al. (2005) Bogdanov S., Grindlay J. E., van den Berg M., 2005, ApJ, 630, 1029
- Bogdanov et al. (2006) Bogdanov S., Grindlay J. E., Heinke C. O., Camilo F., Freire P. C. C., Becker W., 2006, ApJ, 646, 1104
- Bogdanov et al. (2011a) Bogdanov S., et al., 2011a, ApJ, 730, 81
- Bogdanov et al. (2011b) Bogdanov S., Archibald A. M., Hessels J. W. T., Kaspi V. M., Lorimer D., McLaughlin M. A., Ransom S. M., Stairs I. H., 2011b, ApJ, 742, 97
- Burgay et al. (2003) Burgay M., et al., 2003, Nature, 426, 531
- Cadelano et al. (2019) Cadelano M., Ferraro F. R., Istrate A. G., Pallanca C., Lanzoni B., Freire P. C. C., 2019, ApJ, 875, 25
- Cadelano et al. (2020) Cadelano M., Chen J., Pallanca C., Istrate A. G., Ferraro F. R., Lanzoni B., Freire P. C. C., Salaris M., 2020, ApJ, in press (arXiv:2010.09740)
- Camilo & Rasio (2005) Camilo F., Rasio F. A., 2005, in Rasio F. A., Stairs I. H., eds, Astronomical Society of the Pacific Conference Series Vol. 328, Binary Radio Pulsars. p. 147 (arXiv:astro-ph/0501226)
- Deras et al. (2019) Deras D., Arellano Ferro A., Lázaro C., Bustos Fierro I. H., Calderón J. H., Muneer S., Giridhar S., 2019, MNRAS, 486, 2791
- Dolphin (2000) Dolphin A. E., 2000, PASP, 112, 1383
- Elsner et al. (2008) Elsner R. F., et al., 2008, ApJ, 687, 1019
- Forestell et al. (2014) Forestell L. M., Heinke C. O., Cohn H. N., Lugger P. M., Sivakoff G. R., Bogdanov S., Cool A. M., Anderson J., 2014, MNRAS, 441, 757
- Freeman et al. (2002) Freeman P. E., Kashyap V., Rosner R., Lamb D. Q., 2002, ApJS, 138, 185
- Freire et al. (2003) Freire P. C., Camilo F., Kramer M., Lorimer D. R., Lyne A. G., Manchester R. N., D’Amico N., 2003, MNRAS, 340, 1359
- Fruscione et al. (2006) Fruscione A., et al., 2006, in Society of Photo-Optical Instrumentation Engineers (SPIE) Conference Series. p. 62701V, doi:10.1117/12.671760
- Gentile et al. (2014) Gentile P. A., et al., 2014, ApJ, 783, 69
- Gontcharov et al. (2020) Gontcharov G. A., Khovritchev M. Y., Mosenkov A. V., 2020, MNRAS, 497, 3674
- Grindlay et al. (2001) Grindlay J. E., Heinke C. O., Edmonds P. D., Murray S. S., Cool A. M., 2001, ApJ, 563, L53
- Harding & Muslimov (2002) Harding A. K., Muslimov A. G., 2002, ApJ, 568, 862
- Harris (1996) Harris W. E., 1996, AJ, 112, 1487
- He et al. (2013) He C., Ng C. Y., Kaspi V. M., 2013, ApJ, 768, 64
- Hessels et al. (2007) Hessels J. W. T., Ransom S. M., Stairs I. H., Kaspi V. M., Freire P. C. C., 2007, ApJ, 670, 363
- Hong et al. (2005) Hong J., van den Berg M., Schlegel E. M., Grindlay J. E., Koenig X., Laycock S., Zhao P., 2005, ApJ, 635, 907
- Humphrey et al. (2009) Humphrey P. J., Liu W., Buote D. A., 2009, ApJ, 693, 822
- Kulkarni et al. (1991) Kulkarni S. R., Anderson S. B., Prince T. A., Wolszczan A., 1991, Nature, 349, 47
- Linares et al. (2014) Linares M., et al., 2014, MNRAS, 438, 251
- Miller et al. (2019) Miller M. C., et al., 2019, ApJ, 887, L24
- Papitto et al. (2013) Papitto A., et al., 2013, Nature, 501, 517
- Possenti et al. (2002) Possenti A., Cerutti R., Colpi M., Mereghetti S., 2002, A&A, 387, 993
- Ridolfi et al. (2016) Ridolfi A., et al., 2016, MNRAS, 462, 2918
- Riley et al. (2019) Riley T. E., et al., 2019, ApJ, 887, L21
- Roberts (2011) Roberts M. S. E., 2011, in Burgay M., D’Amico N., Esposito P., Pellizzoni A., Possenti A., eds, American Institute of Physics Conference Series Vol. 1357, American Institute of Physics Conference Series. pp 127–130 (arXiv:1103.0819), doi:10.1063/1.3615095
- Roberts et al. (2015) Roberts M. S. E., McLaughlin M. A., Gentile P. A., Ray P. S., Ransom S. M., Hessels J. W. T., 2015, arXiv e-prints, p. arXiv:1502.07208
- Saito et al. (1997) Saito Y., Kawai N., Kamae T., Shibata S., Dotani T., Kulkarni S. R., 1997, ApJ, 477, L37
- Sandquist et al. (2010) Sandquist E. L., Gordon M., Levine D., Bolte M., 2010, AJ, 139, 2374
- Servillat et al. (2011) Servillat M., Webb N. A., Lewis F., Knigge C., van den Berg M., Dieball A., Grindlay J., 2011, ApJ, 733, 106
- Shaw et al. (2018) Shaw A. W., Heinke C. O., Steiner A. W., Campana S., Cohn H. N., Ho W. C. G., Lugger P. M., Servillat M., 2018, MNRAS, 476, 4713
- Sigurdsson et al. (2003) Sigurdsson S., Richer H. B., Hansen B. M., Stairs I. H., Thorsett S. E., 2003, Science, 301, 193
- Sirianni et al. (2005) Sirianni M., et al., 2005, PASP, 117, 1049
- Splaver et al. (2005) Splaver E. M., Nice D. J., Stairs I. H., Lommen A. N., Backer D. C., 2005, ApJ, 620, 405
- Stairs (2004) Stairs I. H., 2004, Science, 304, 547
- Stappers et al. (2003) Stappers B. W., Gaensler B. M., Kaspi V. M., van der Klis M., Lewin W. H. G., 2003, Science, 299, 1372
- Takahashi et al. (2001) Takahashi M., et al., 2001, ApJ, 554, 316
- Verbunt et al. (1996) Verbunt F., Kuiper L., Belloni T., Johnston H. M., de Bruyn A. G., Hermsen W., van der Klis M., 1996, A&A, 311, L9
- Wang et al. (2020) Wang L., et al., 2020, ApJ, 892, 43
- Zhang & Cheng (2003) Zhang L., Cheng K. S., 2003, A&A, 398, 639
- van Kerkwijk et al. (2005) van Kerkwijk M. H., Bassa C. G., Jacoby B. A., Jonker P. G., 2005, in Rasio F. A., Stairs I. H., eds, Astronomical Society of the Pacific Conference Series Vol. 328, Binary Radio Pulsars. p. 357 (arXiv:astro-ph/0405283)