CoVaxxy: A Collection of English-Language
Twitter Posts about COVID-19 Vaccines
Abstract
With a substantial proportion of the population currently hesitant to take the COVID-19 vaccine, it is important that people have access to accurate information. However, there is a large amount of low-credibility information about vaccines spreading on social media. In this paper, we present the CoVaxxy dataset, a growing collection of English-language Twitter posts about COVID-19 vaccines. Using one week of data, we provide statistics regarding the numbers of tweets over time, the hashtags used, and the websites shared. We also illustrate how these data might be utilized by performing an analysis of the prevalence over time of high- and low-credibility sources, topic groups of hashtags, and geographical distributions. Additionally, we develop and present the CoVaxxy dashboard, allowing people to visualize the relationship between COVID-19 vaccine adoption and U.S. geo-located posts in our dataset. This dataset can be used to study the impact of online information on COVID-19 health outcomes (e.g., vaccine uptake) and our dashboard can help with exploration of the data.
Introduction
The COVID-19 pandemic has killed two million people and infected 93 million around the world as of mid-January, 2021 (Dong, Du, and Gardner 2020). Vaccines will be critical in our fight to end the COVID-19 pandemic (Orenstein and Ahmed 2017). It is estimated that around 60-70% of the population will need to be vaccinated against COVID-19 to achieve herd immunity (Aguas et al. 2020). However, recent surveys have found that only 40-60% of American adults reported that they would take a COVID-19 vaccine (Funk and Tyson 2020; Hamel, Kirzinger, and Brodie 2020). With these currently predicted levels of vaccine hesitancy, it is unlikely we will reach herd immunity; COVID-19 will remain endemic.
A possible driver for vaccine hesitancy is the anti-vaccination movement. This movement has been on the rise in the U.S. for two decades, beginning with unfounded fears over a Measles, Mumps and Rubella (MMR) vaccine (Hussain et al. 2018). The vocal online presence of the anti-vaccination movement has undermined confidence in vaccines. Worse, resistance to the COVID-19 vaccines is currently much more prevalent than resistance to the MMR vaccine. Since COVID-19 vaccine hesitancy and its drivers remain understudied, a goal of our project is to help address this gap.
There is a growing body of evidence linking social media and the anti-vaccination movement to vaccine hesitancy (Broniatowski et al. 2018; Burki 2019; Johnson et al. 2020). Studies show that vaccine hesitancy in one’s peer group is associated with future hesitancy (Brunson 2013), and that misinformation spread on social networks is linked to poor compliance with public health guidance about COVID-19 (Roozenbeek et al. 2020). Based on these findings, the core hypothesis behind this project is that the social spread of vaccine misinformation and vaccine hesitancy will impact public health outcomes such as vaccine uptake and COVID-19 mortality rate.
Here we present a collection of English-language posts related to the COVID-19 vaccines on Twitter. The collection is exempt from IRB review as it only includes tweet IDs of public messages. This allows us to comply with the Twitter Terms of Service while making the data available to both researchers and the general public. Although there has been previous work presenting COVID-19 Twitter datasets (Chen, Lerman, and Ferrara 2020; Huang et al. 2020; Lamsal 2020), our work focuses specifically on discussion of COVID-19 vaccines and related public health outcomes.
The CoVaxxy dataset will enable researchers to study vaccine misinformation and hesitancy, and their relationship to public health outcomes. We will use established techniques to track vaccine misinformation within the data, along with misinformation superspreaders, coordinated campaigns, and automated accounts (Yang, Hui, and Menczer 2019; Yang et al. 2021; Pierri, Piccardi, and Ceri 2020a, b; Pacheco et al. 2021). We will also relate this social media data to geographic public health data (such as COVID-19 mortality and vaccine uptake rates) by using geolocation data within the dataset.
In this paper we describe the methods used to create the CoVaxxy dataset. Using one week of data, we provide a descriptive analysis and illustrate how our data could be used to answer various research questions. We also present the CoVaxxy Dashboard, a tool intended for the public to track key insights drawn from the data. Opportunities and limitations are discussed as we draw conclusions.
Dataset Curation
Our key data collection goal is to download a complete set of Twitter posts related to COVID-19 vaccines. In this section we describe our methodology for selecting appropriate keywords to achieve such a coverage. We then describe our architecture with server redundancy to maintain an unbroken stream of Twitter data containing these keywords.
Identifying COVID-19 Vaccines Content
To create as complete a set of Twitter posts related to COVID-19 vaccines as possible, we carefully select a list of keywords through a snowball sampling technique (Conover et al. 2012; Yang, Hui, and Menczer 2019). We start with the two most relevant keywords, i.e., covid and vaccine, as our initial seeds. Keywords also match hashtags, URLs, and substrings. For example, covid matches “cnn.com/covid” and “#covid.” Next, we gather tweets utilizing the filtered stream endpoint of the Twitter API111https://developer.twitter.com/en/docs/twitter-api/v1/tweets/filter-realtime/overview for three hours. From these gathered tweets, we then identify potential keywords that frequently co-occur with the seeds. These keywords are separately reviewed by two authors and added to the seed list if both agree that a keyword is related to our topic. This process was repeated six times between Dec. 15, 2020 and Jan. 2, 2021 with each iteration’s data collection taking place at different times of the day to capture tweets from different geographic areas and demographics. The seed list serves as our initial keyword list.
We further refine the keyword list by manually combining certain keywords into composites, leveraging the query syntax of Twitter’s filtered stream API. For example, using covid19 pfizer as a single composite matching phrase will capture tweets that contain both “covid19” and “pfizer.” On the other hand, including covid19 and pfizer as separate keywords will capture tweets that contain “covid19” or “pfizer,” which we consider as too broad for our analysis. The final keyword list includes 76 (single or composite) keywords. Constructing various composites of relevant keywords in this way ensures the dataset is broad enough to include most relevant conversations while excluding tweets that are not related to the vaccine discussion.
Content Coverage
To demonstrate the effectiveness of the snowball sampling technique introduced above, we calculate the popularity of each keyword in the final list by the number of unique tweets and unique users associated with it.
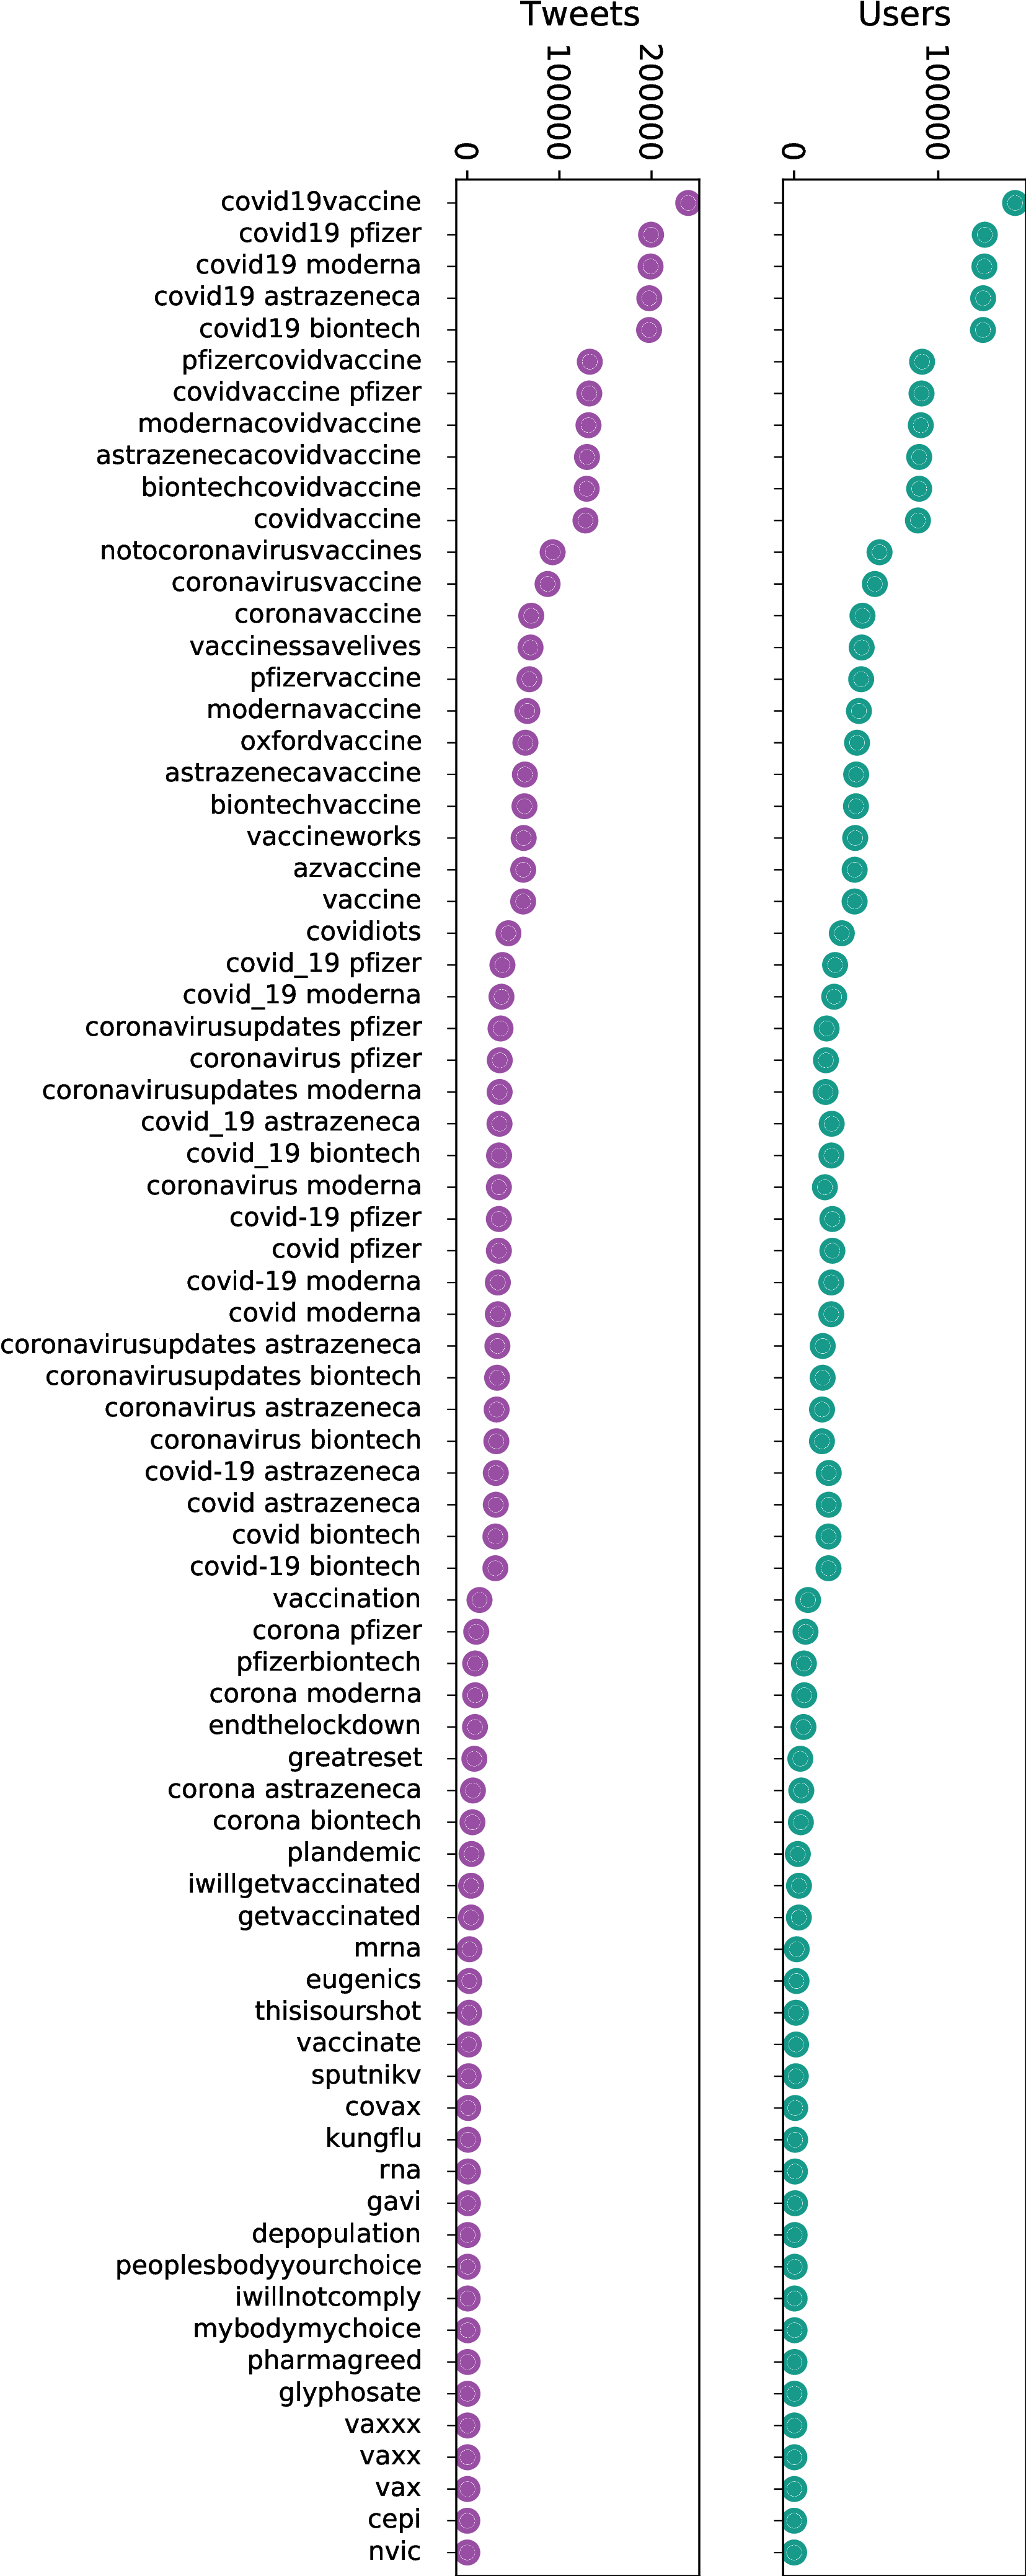
Figure 1, where keywords are ranked by popularity, shows that additional keywords beyond the 60 most popular ones tend to capture very small numbers of users and tweets, relative to other keywords in the collection. This suggests that including more keywords in the seed list described above is not likely to alter the size and structure of the dataset significantly. In fact, the inclusion of additional keywords could be redundant, due to the co-occurrence of multiple keywords and hashtags in a single tweet, especially for the most popular terms. Thus, we believe that our set of keywords provides reasonable coverage and is representative of tweets communicating about COVID-19 vaccines.
As the collection of tweets is intended to persist over time, new relevant keywords may emerge. To ensure that the keyword list remains comprehensive throughout the entire data collection period, our team will continue to monitor the ongoing public discussion related to COVID-19 vaccinations and update the list with important emerging keywords, if necessary.
CoVaxxy Infrastructure
Data Collection Architecture
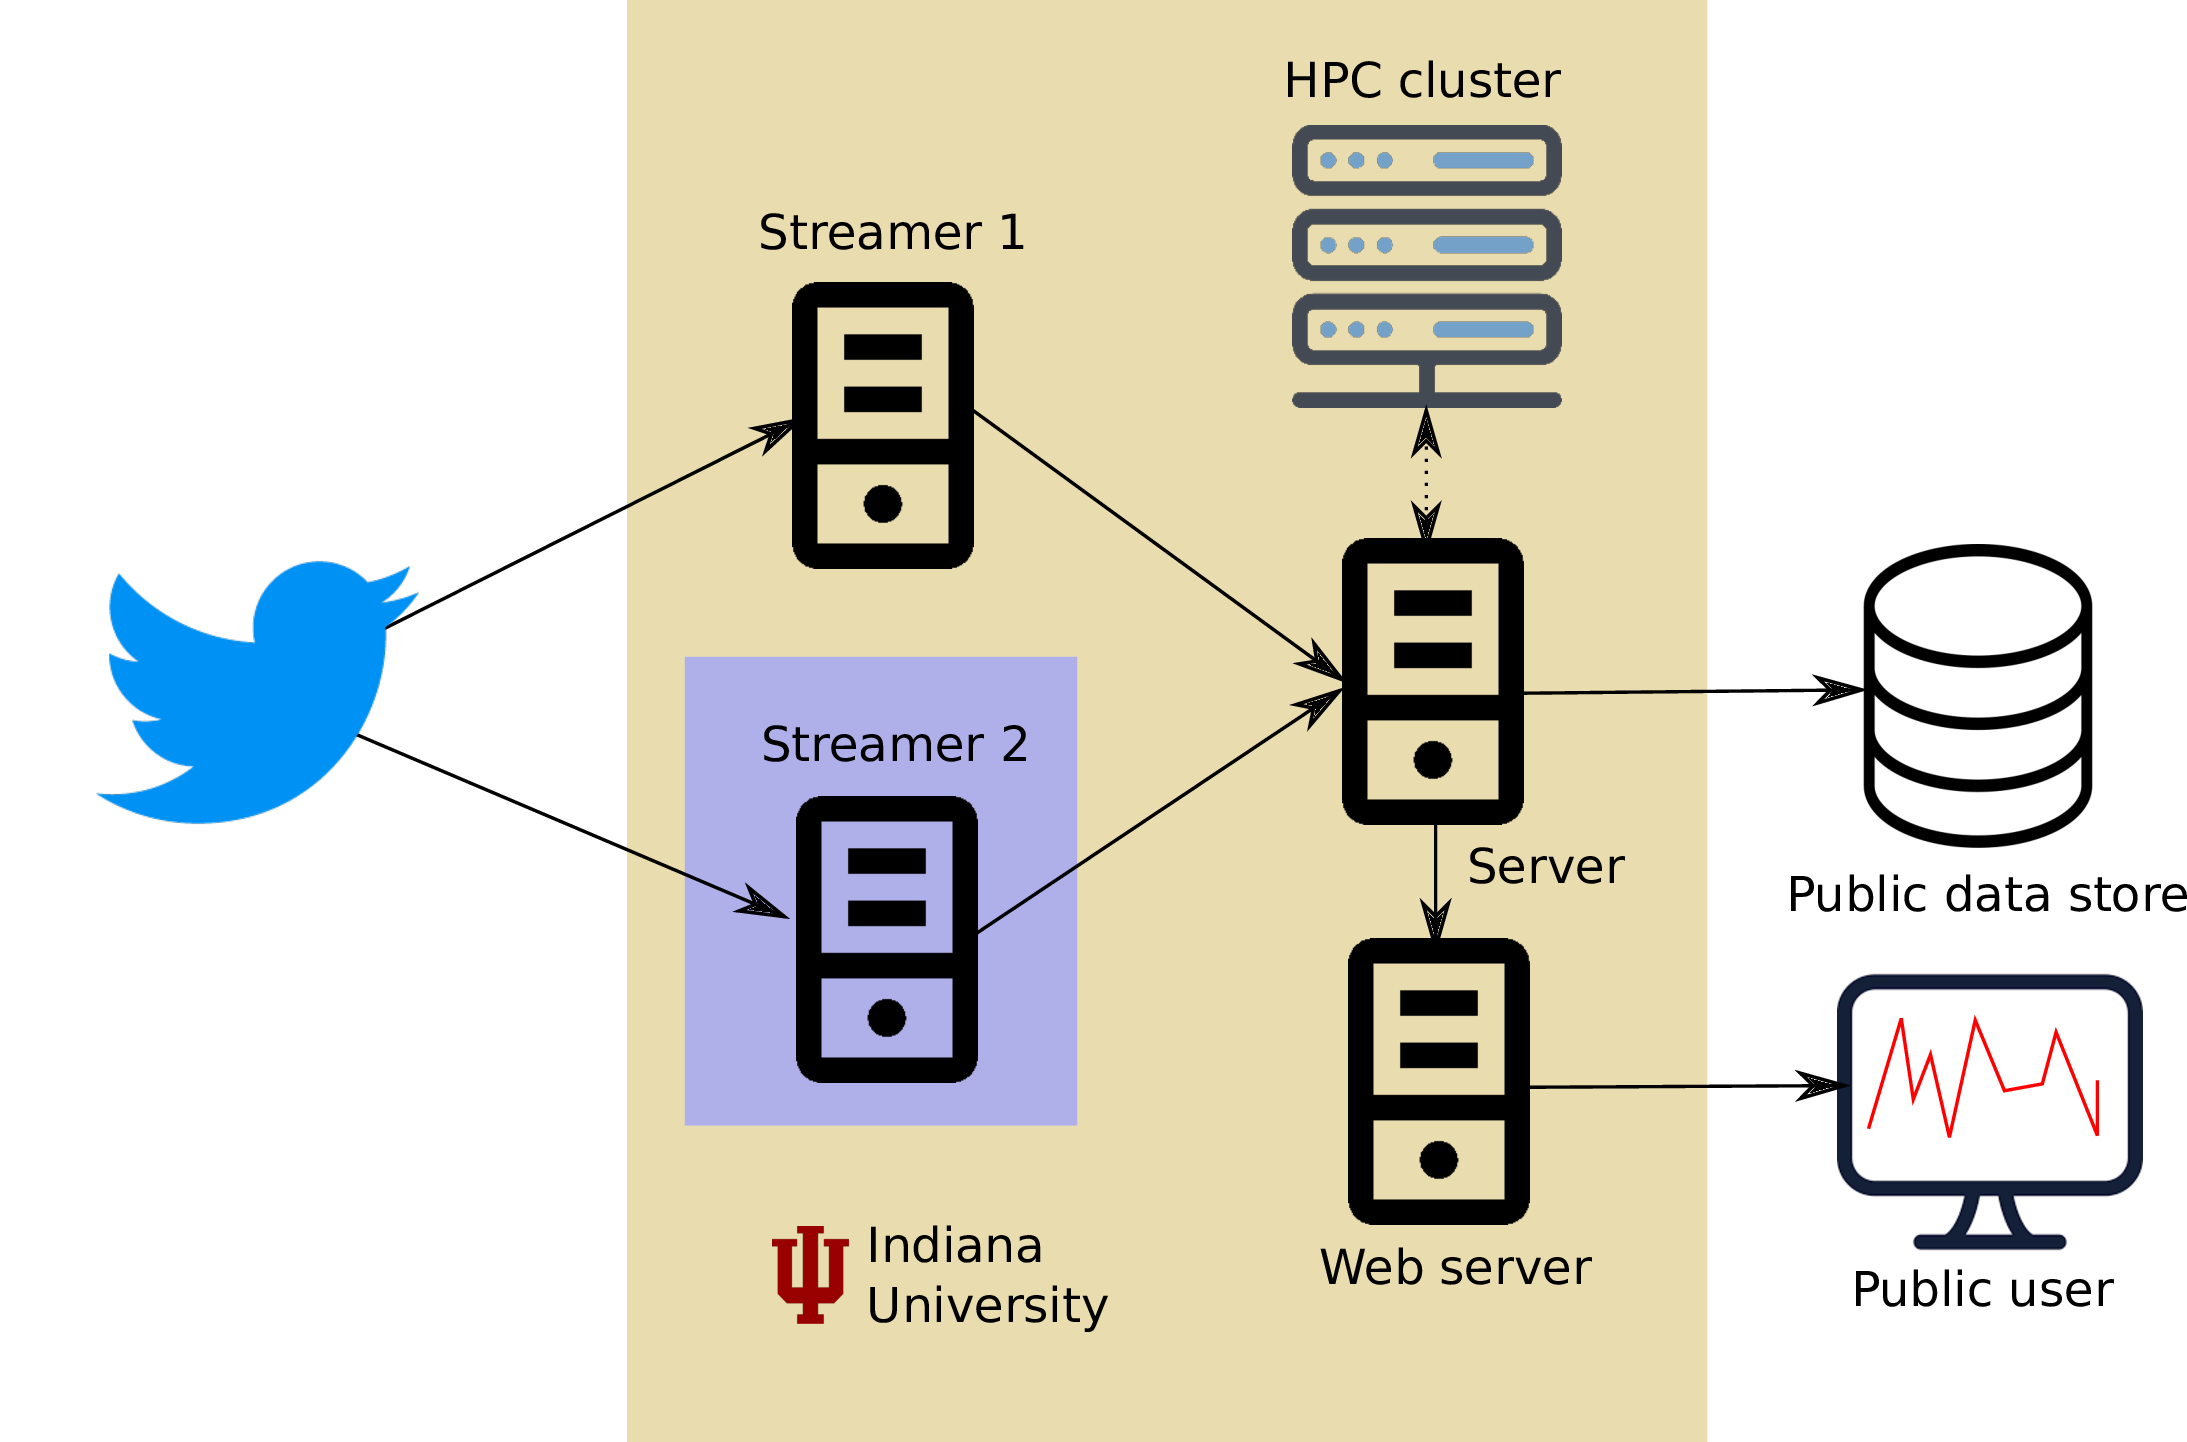
Our server architecture (Figure 2) is designed to collect and process large quantities of data. This infrastructure is hosted by Extreme Science and Engineering Discovery Environment (XSEDE) Jetstream virtual machines (VMs) (Towns et al. 2014; Stewart et al. 2015). To maintain the integrity of our tweet streaming pipeline, we have incorporated redundancy. We maintain two streamer (stream collection) VMs in different U.S. states so that if one suffers a fault we can use data from the other. These servers connect to Twitter’s filtered stream API to collect tweets that match any of the keywords in real time. We use the language metadata to filter out non-English tweets.
The data from the two streamers is collated on a general purpose server VM where we run data analysis. The server VM is also linked to Indiana University’s high performance computing infrastructure for running advanced analyses.
We upload new data files to a public data repository (DeVerna et al. 2021) each day222https://doi.org/10.5281/zenodo.4526494 and will continue to do so as long as the topic of COVID-19 vaccinations remains relevant in public discourse. This repository also includes our list of keywords. In compliance with Twitter’s Terms, we are only able to share tweet IDs with the public. One can re-hydrate the dataset by querying the Twitter API or using tools like Hydrator333https://github.com/DocNow/hydrator or twarc444https://github.com/DocNow/twarc.
Finally, a web server provides access to the data on the server VM through the interactive CoVaxxy dashboard, described next.
Dashboard
Existing COVID-19 visualization tools include those by Johns Hopkins University (Dong, Du, and Gardner 2020) and The Atlantic.555https://covidtracking.com/ These trackers address hospitalization and mortality. Another dashboard from the Fondazione Bruno Kessler reports on the proportions of misinformation and epidemic-related statistics (e.g., confirmed cases and deaths) per country.666https://covid19obs.fbk.eu Finally, the Our World in Data COVID-19 vaccination dataset publishes vaccine uptake information by country.777https://ourworldindata.org/covid-vaccinations
We are not aware of any tools that concurrently explore the relationships between COVID-19 vaccine conversations, vaccine uptake, and epidemic trends. Consequently, we have created a web-based dashboard to fill this void. The CoVaxxy dashboard will track and quantify credible information and misinformation narratives over time, as well as their sources and related popular keywords.888https://osome.iu.edu/tools/covaxxy Although we collect English tweets related to vaccines globally, the dashboard provides state-level statistics in the United States. Additionally, it shows global hashtag and domain sharing trends. It is updated daily. Figure 3 illustrates one example of an interactive visualization that lets users visualize the relationship between various misinformation-related and COVID-19 pandemic data. This data will be displayed alongside COVID-19 pandemic and vaccine trends. By highlighting the connection between misinformation and public health actions and outcomes, we hope to encourage the public to be more vigilant about the information they consume from their daily social media feeds in the fight against COVID-19.

Data Characterization
| Users | Tweets | Hashtags | URLs |
| 1,847,067 | 4,768,204 | 39,857 | 983,158 |
Our system started to gather tweets on Jan. 4, 2021. Table 1 provides a breakdown of the dataset (as of January 11) in terms of the number of unique users, number of tweets they shared, and numbers of unique hashtags and URLs contained in these tweets. Next let us analyze the data from that week to illustrate how our dataset might be used for different research projects.
Volume
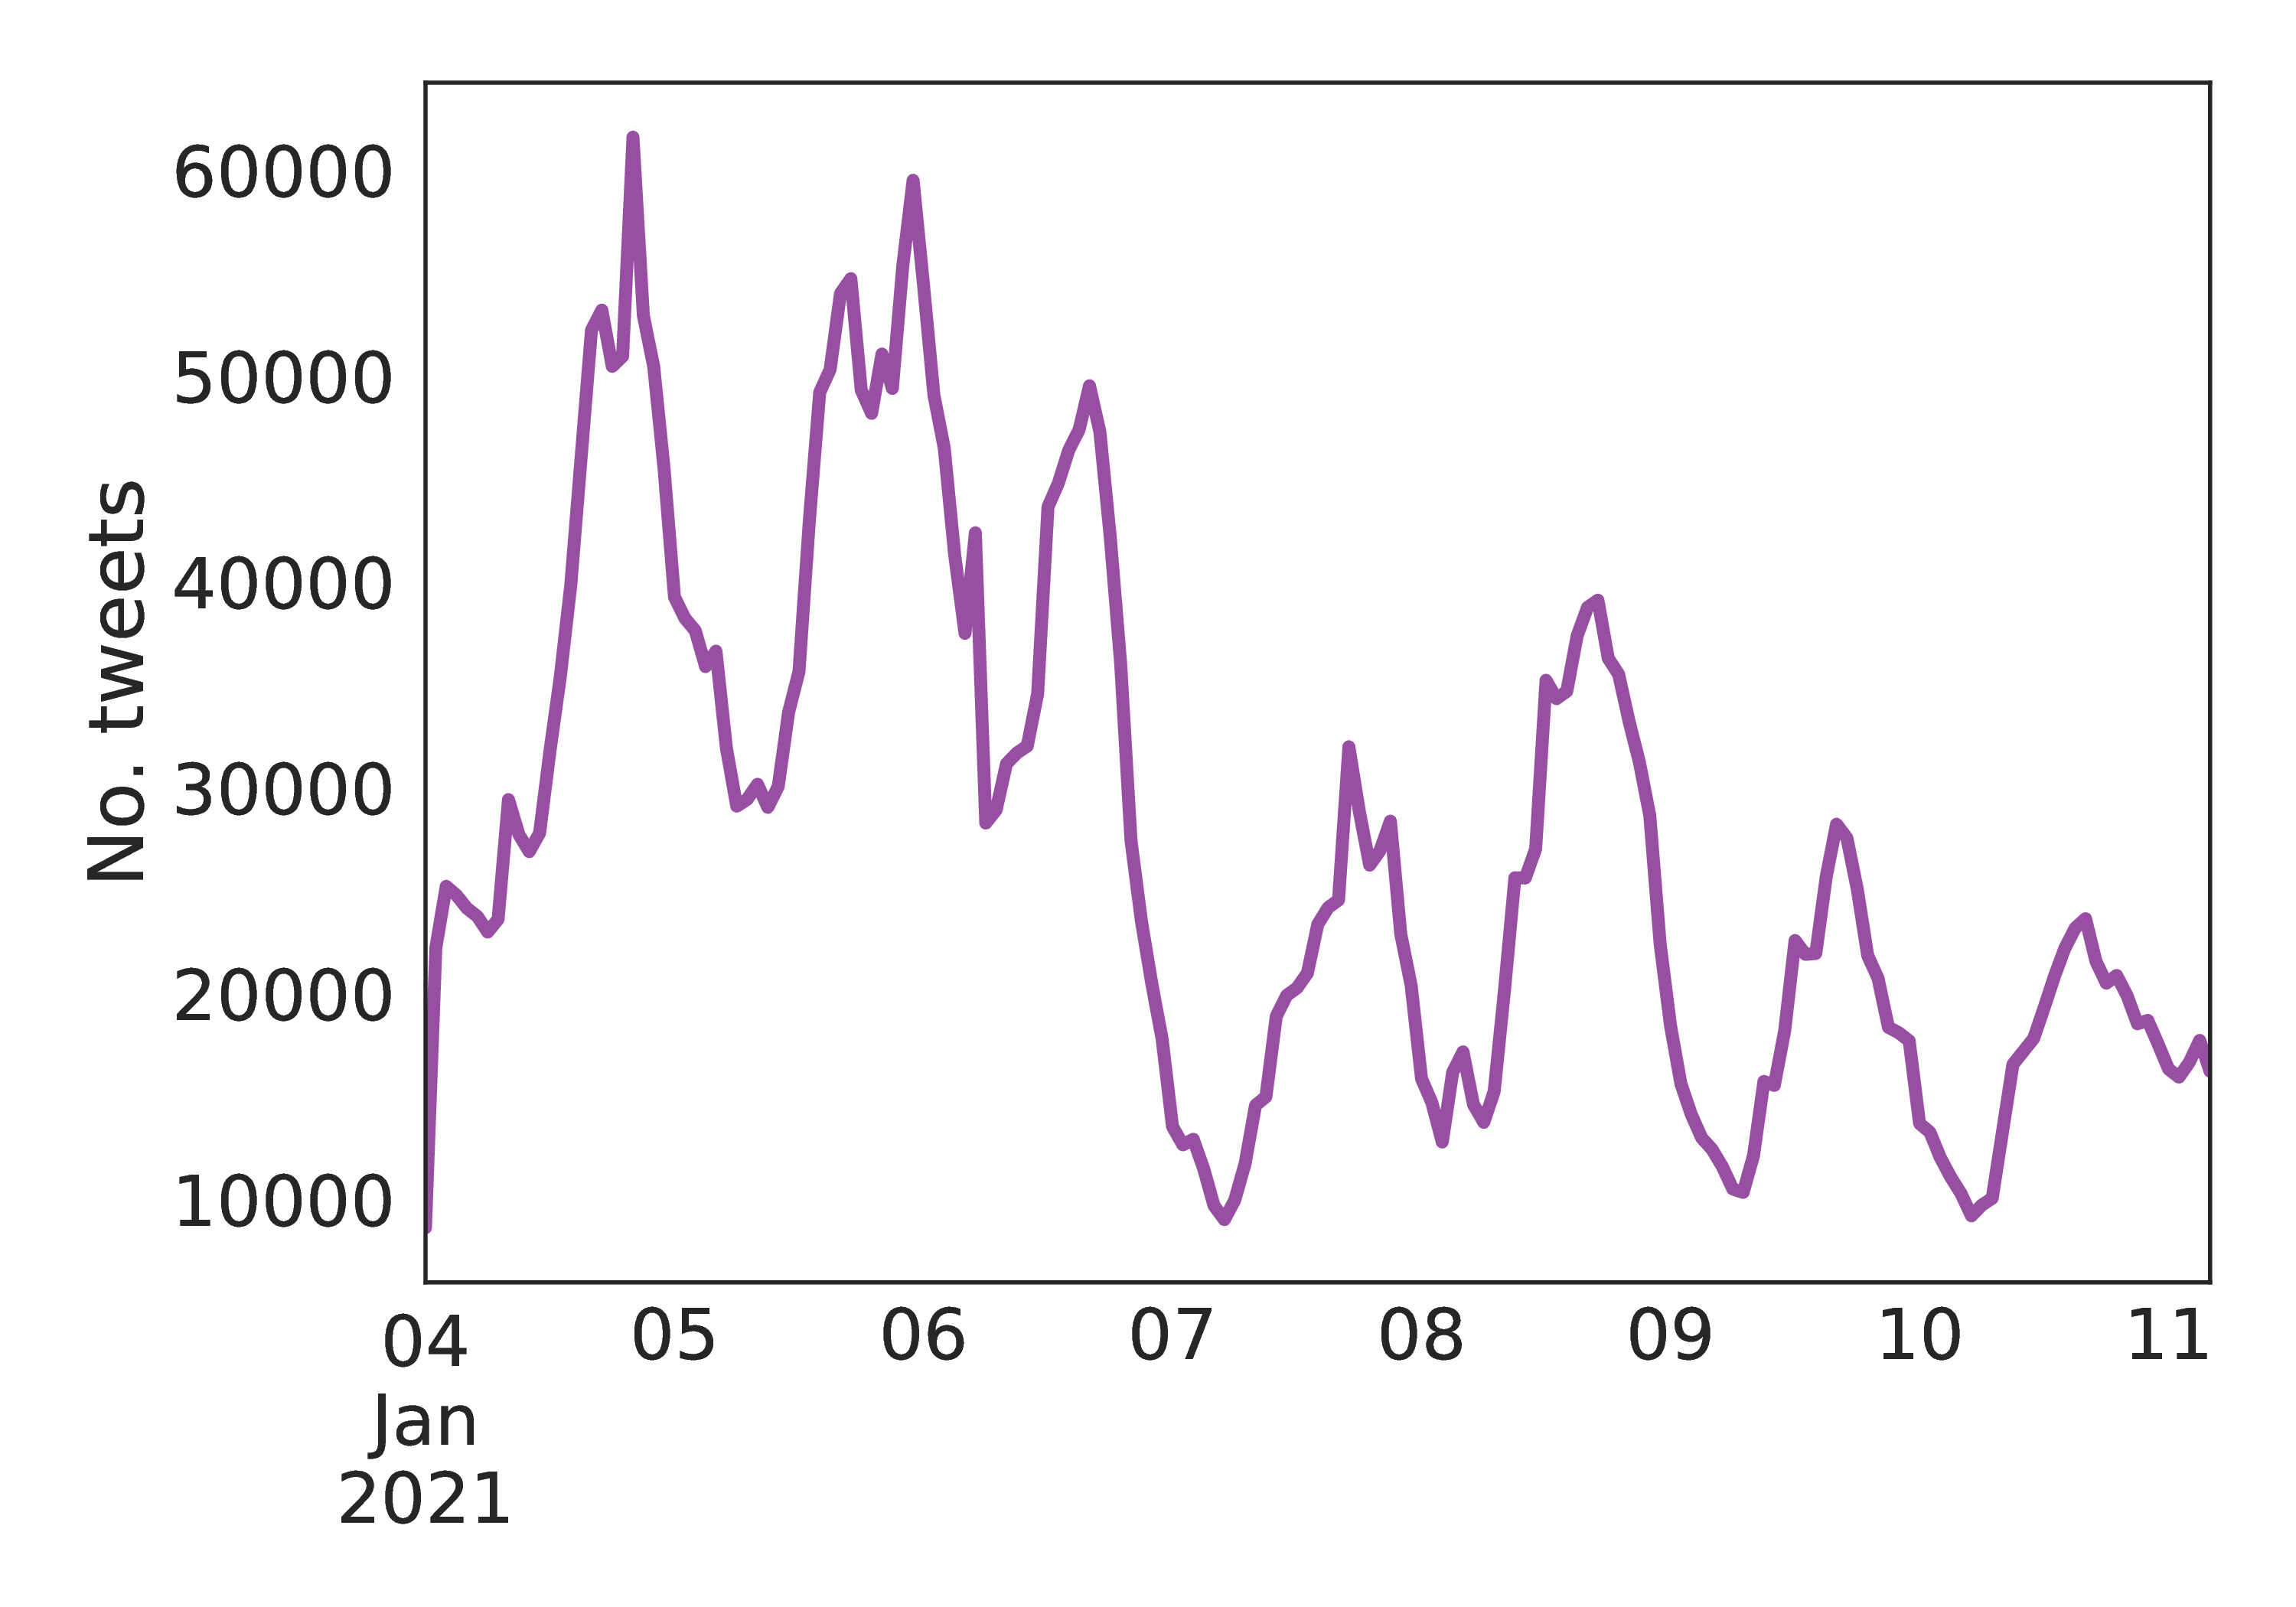
We show in Figure 4 a time series for the number of tweets collected in our dataset, on an hourly basis. We can notice a decrease in the number of tweets after January 6, which might be driven by the increased media attention surrounding the storming of the U.S. Capitol.999https://www.nytimes.com/2021/01/06/us/politics/protesters-storm-capitol-hill-building.html In fact, the mean daily number of tweets decreases from 900k tweets in the period of Jan 4–6 to 400k tweets in the period of Jan 7–11.
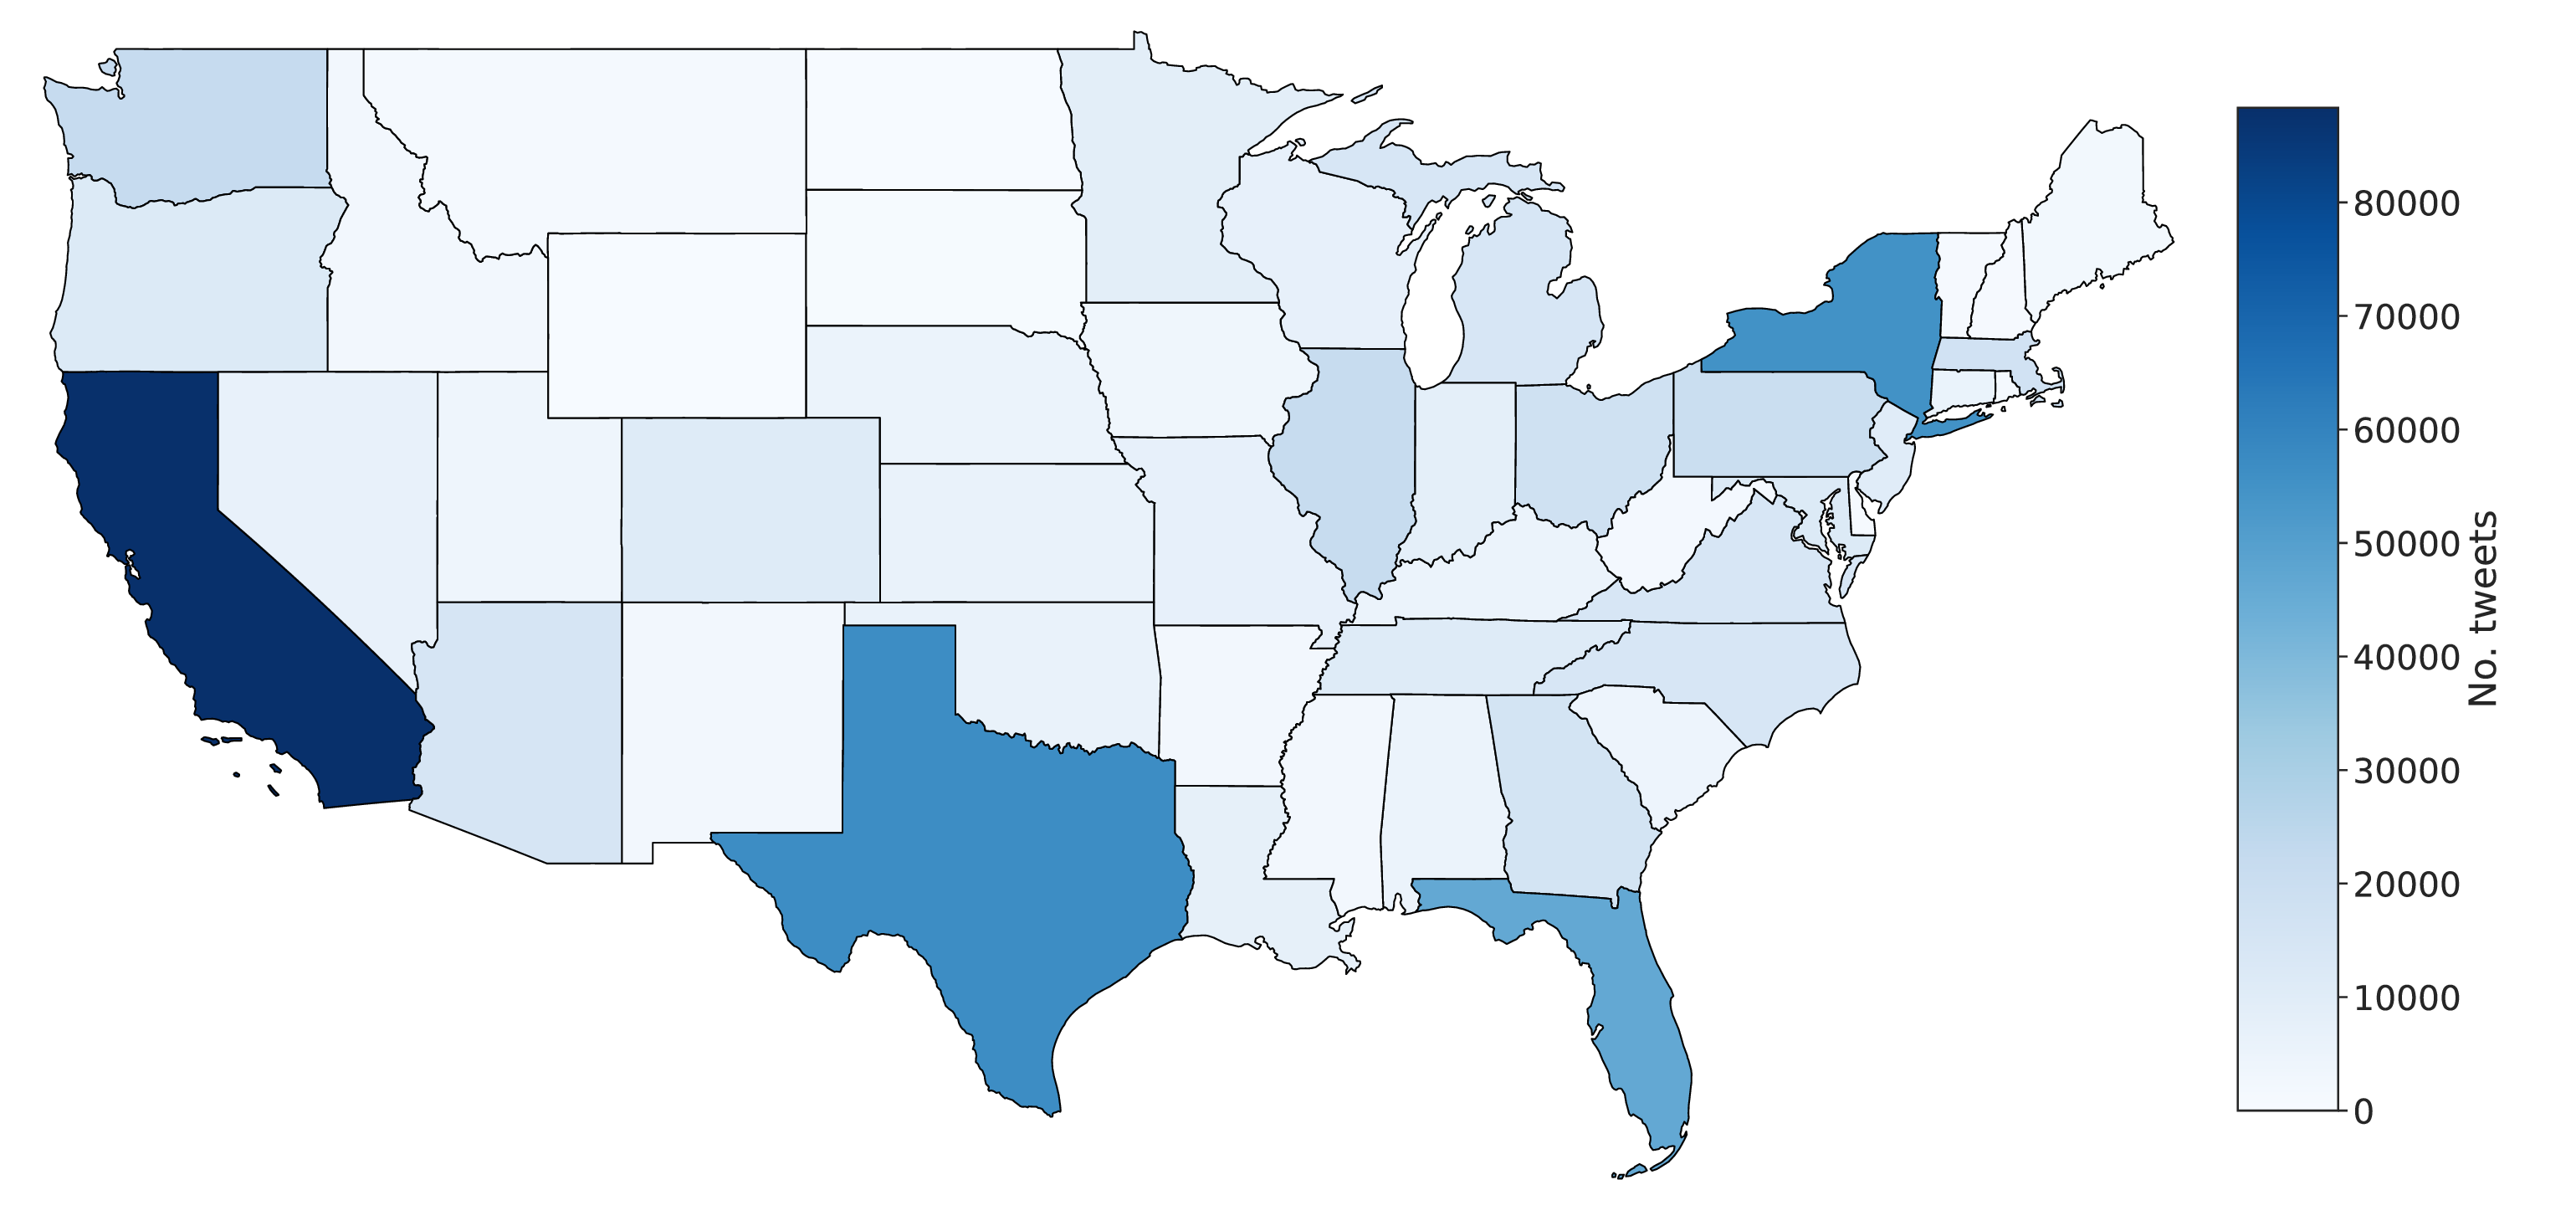
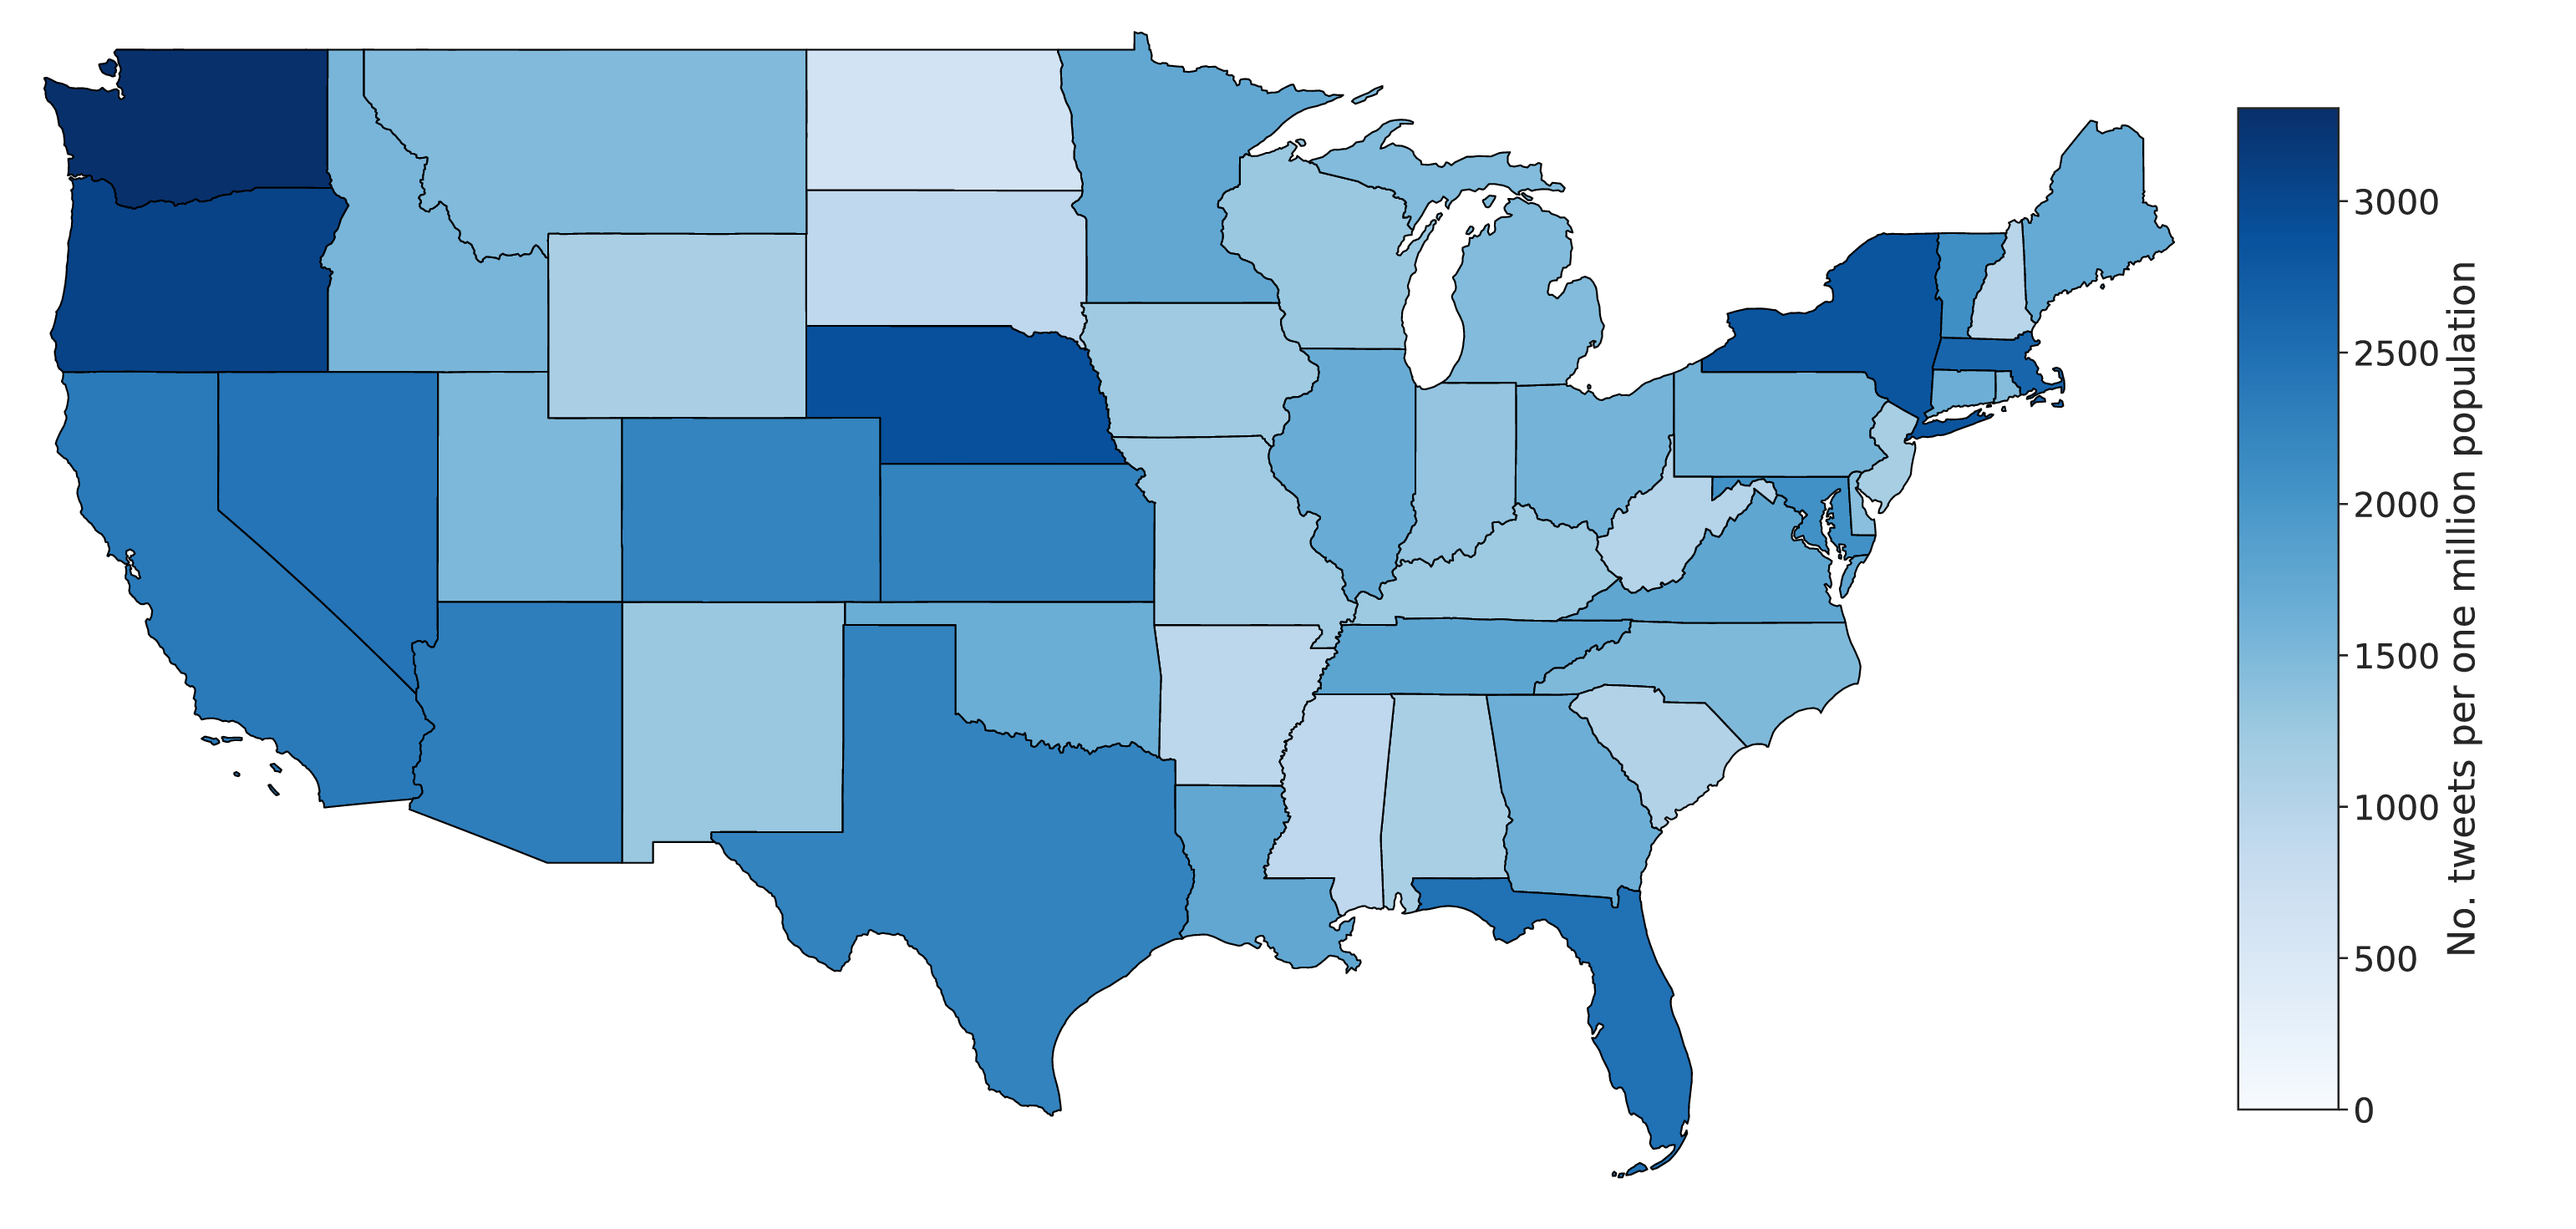
In Figure 5 we show the distribution of the tweets geo-located in the contiguous United States. We use a naive approach to match tweets to U.S. states: we first extract the user location from the profile (if present) and then match it against a dictionary of U.S. states. Finally, we compute the number of tweets for each state based on the activity of users geo-located in that state. Over 1M users in our dataset have location metadata in their profile; we were able to match approximately 40k users resulting in 600k geo-located tweets. Providing an accurate methodology to geo-locate users is outside the scope of this paper; the reader should consider these results only as an illustration of the insights that can be gained from the CoVaxxy data.
Hashtags
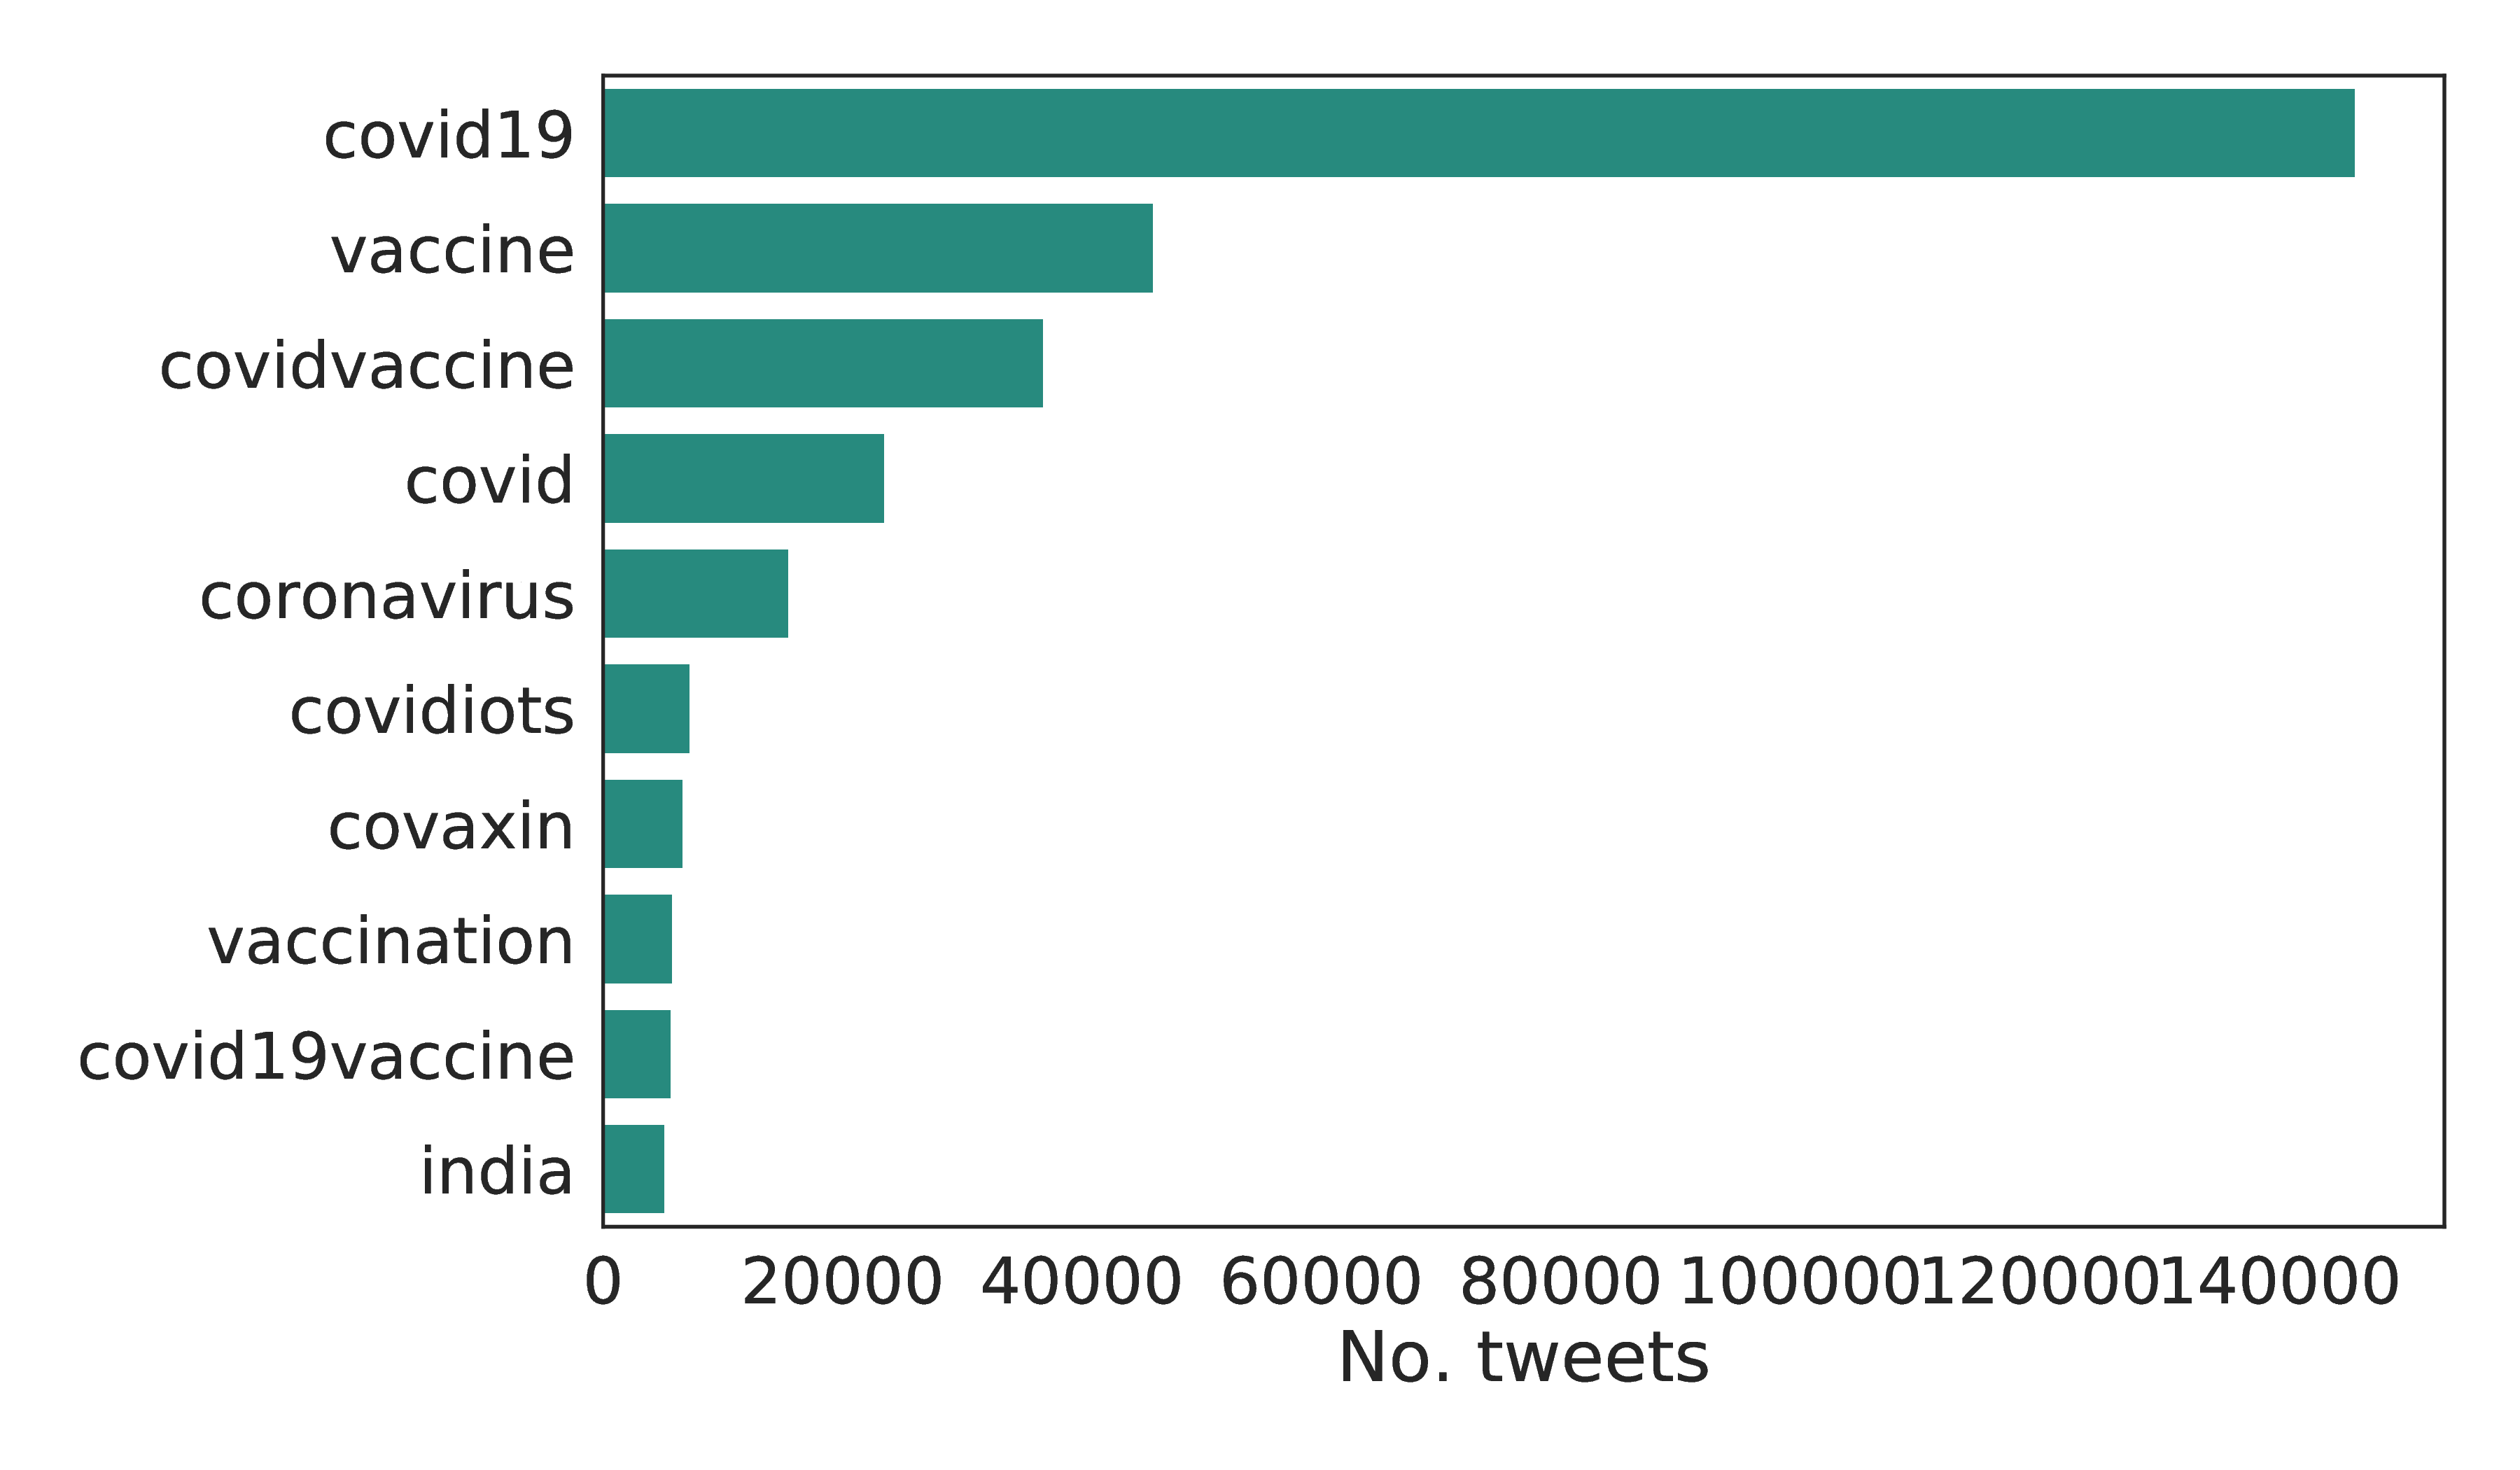
Figure 6 lists the most tweeted hashtags between January 4 and 11. We can see that they are largely related to the SARS-CoV-2 vaccine, with one (“#covidiots”) referring to COVID-19 deniers.
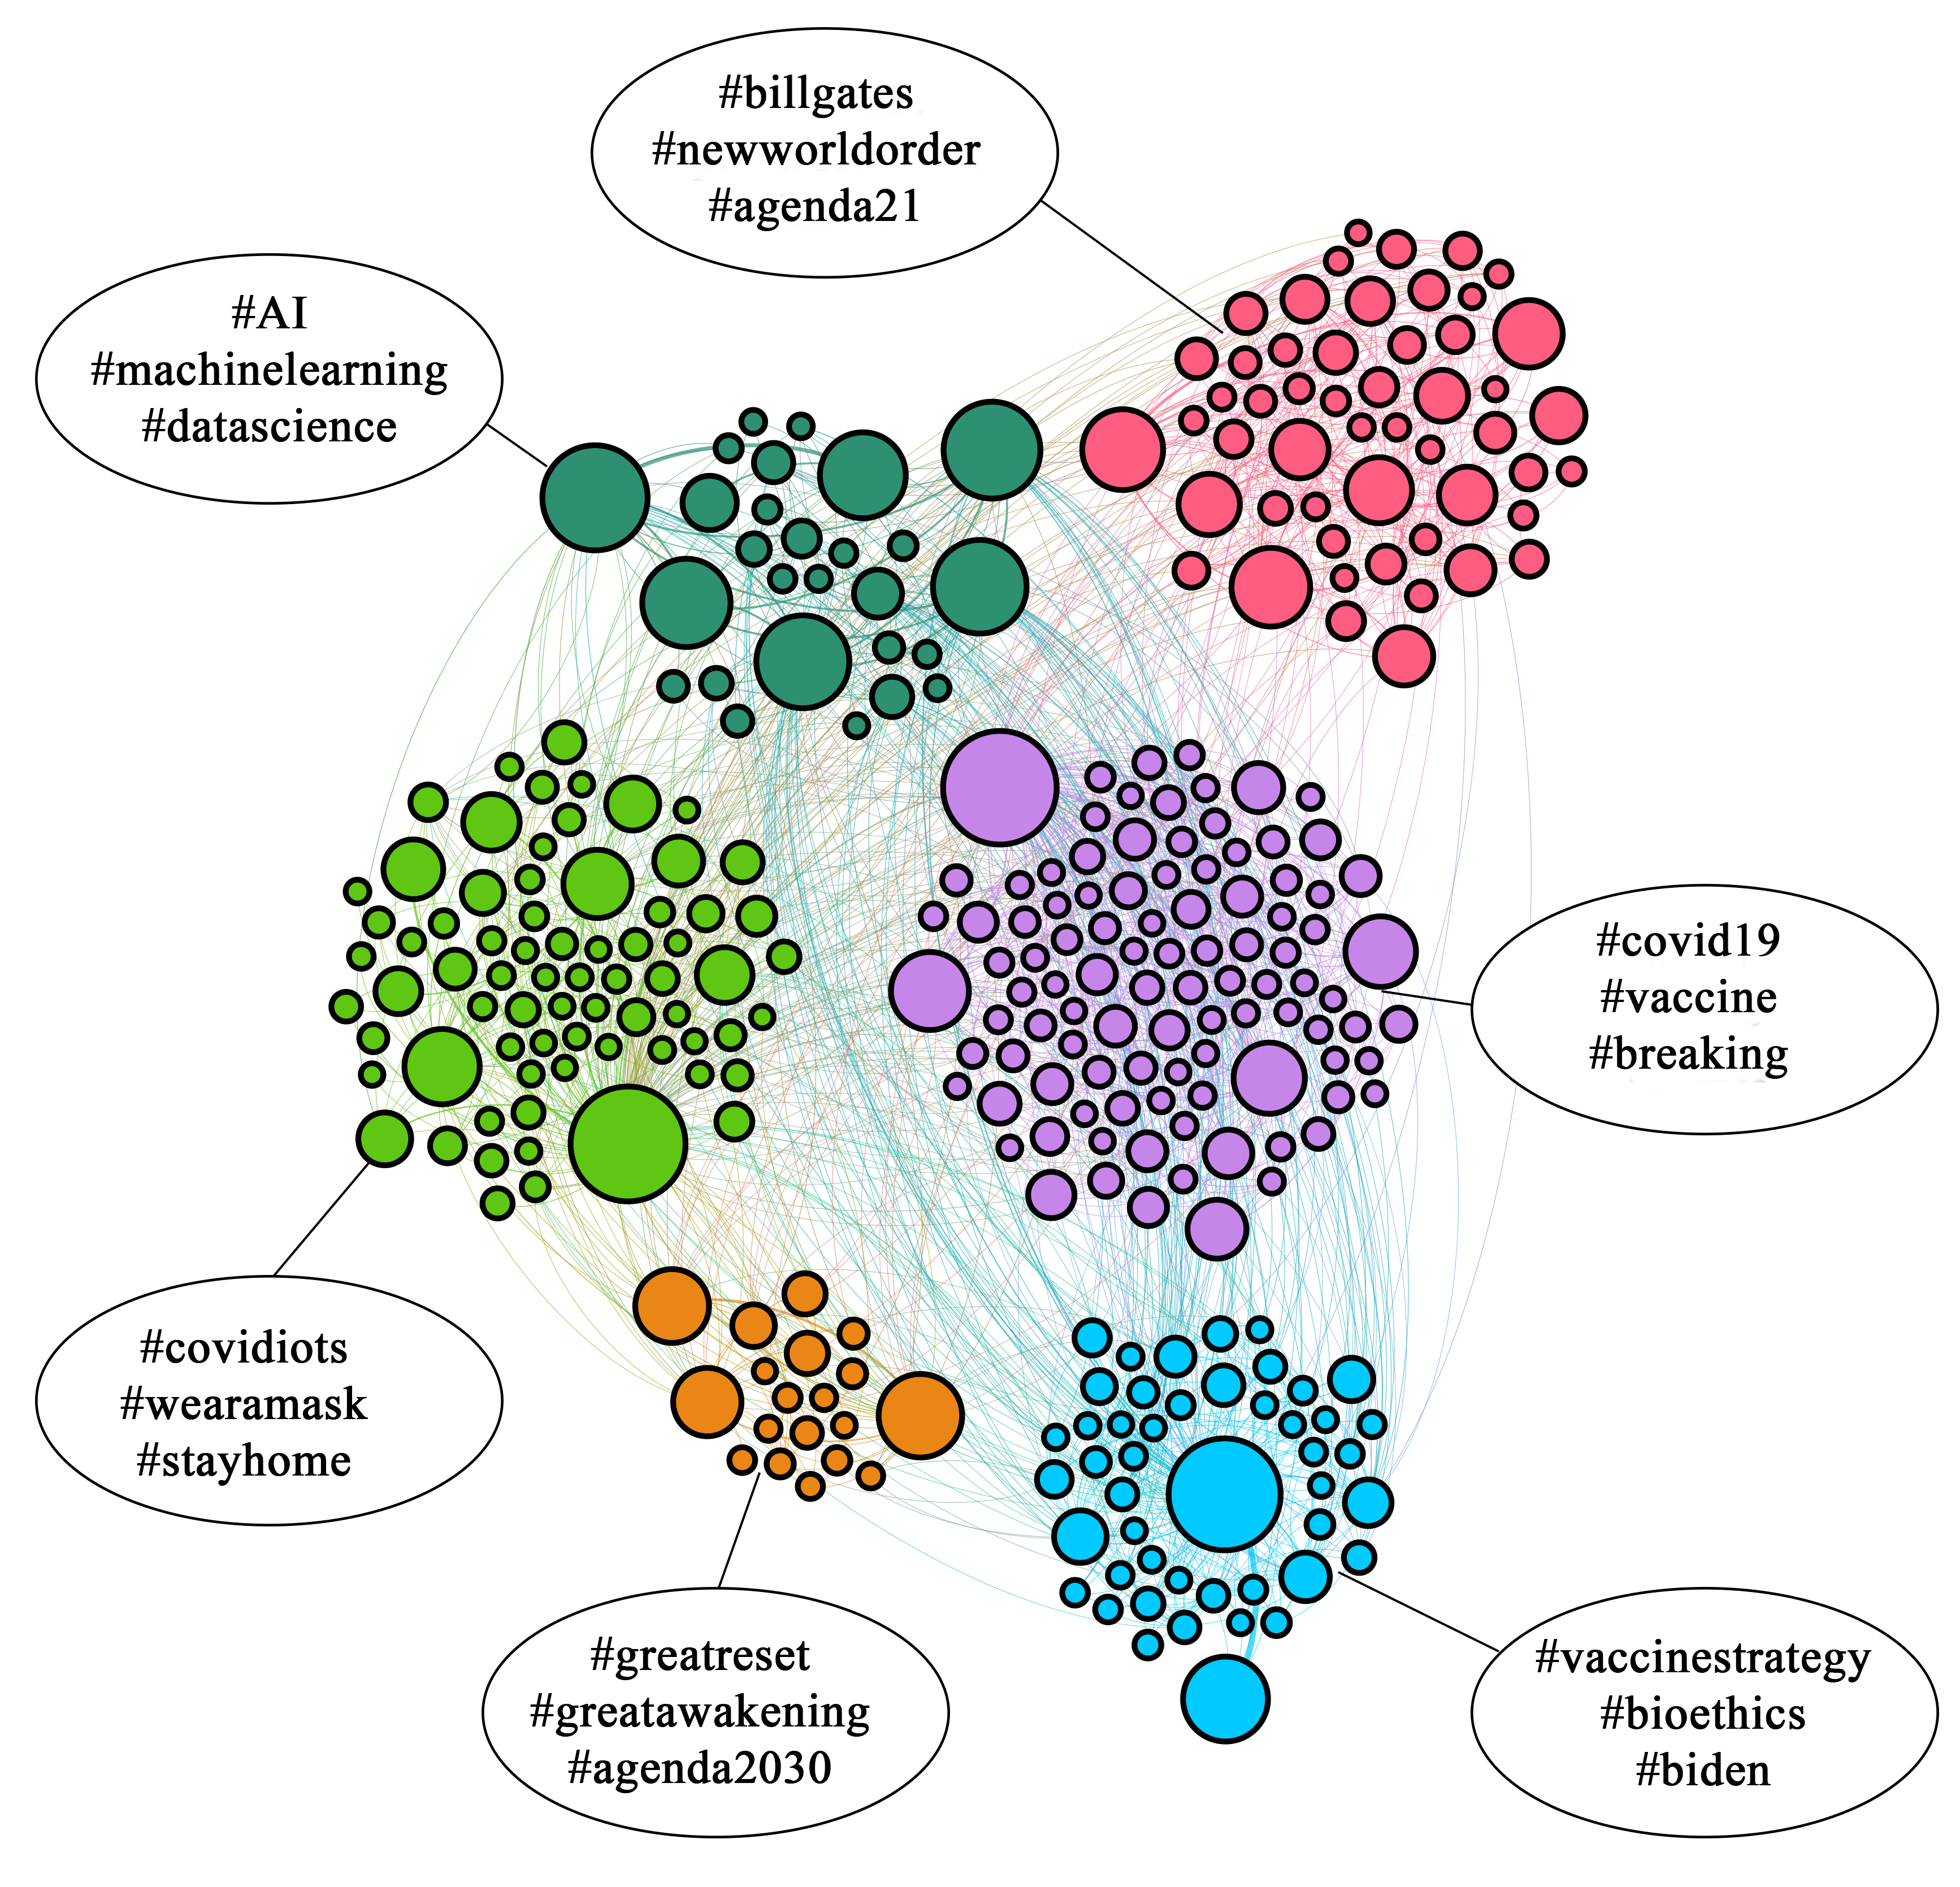
Many different conversations can occur concurrently on Twitter, using different hashtags for different topics. To cluster related hashtags, we have grouped them together using a network algorithm. We form a co-occurrence network with hashtags as nodes and edges weighted according to how often the linked hashtags co-occur within tweets. Nodes are clustered using the Louvain method (Blondel et al. 2008). Groups with hashtags that are used the most are plotted in Figure 7. We observe groups of hashtags associated with vaccine conspiracy theories (“#greatreset,” “#billgates”) as well as positive messages (“#stayhome”).
Sources
In Figure 8 we show the top-10 most shared websites. We exclude “twitter.com,” which accounts for over 3M tweets. These sites are comprised mostly of high-credibility information sources. However, one low-credibility source — “zerohedge.com” — also makes this list (see below for details on the classification). We also observe a large number of links to YouTube, which suggests further investigation will be needed to assess the nature of this shared content.
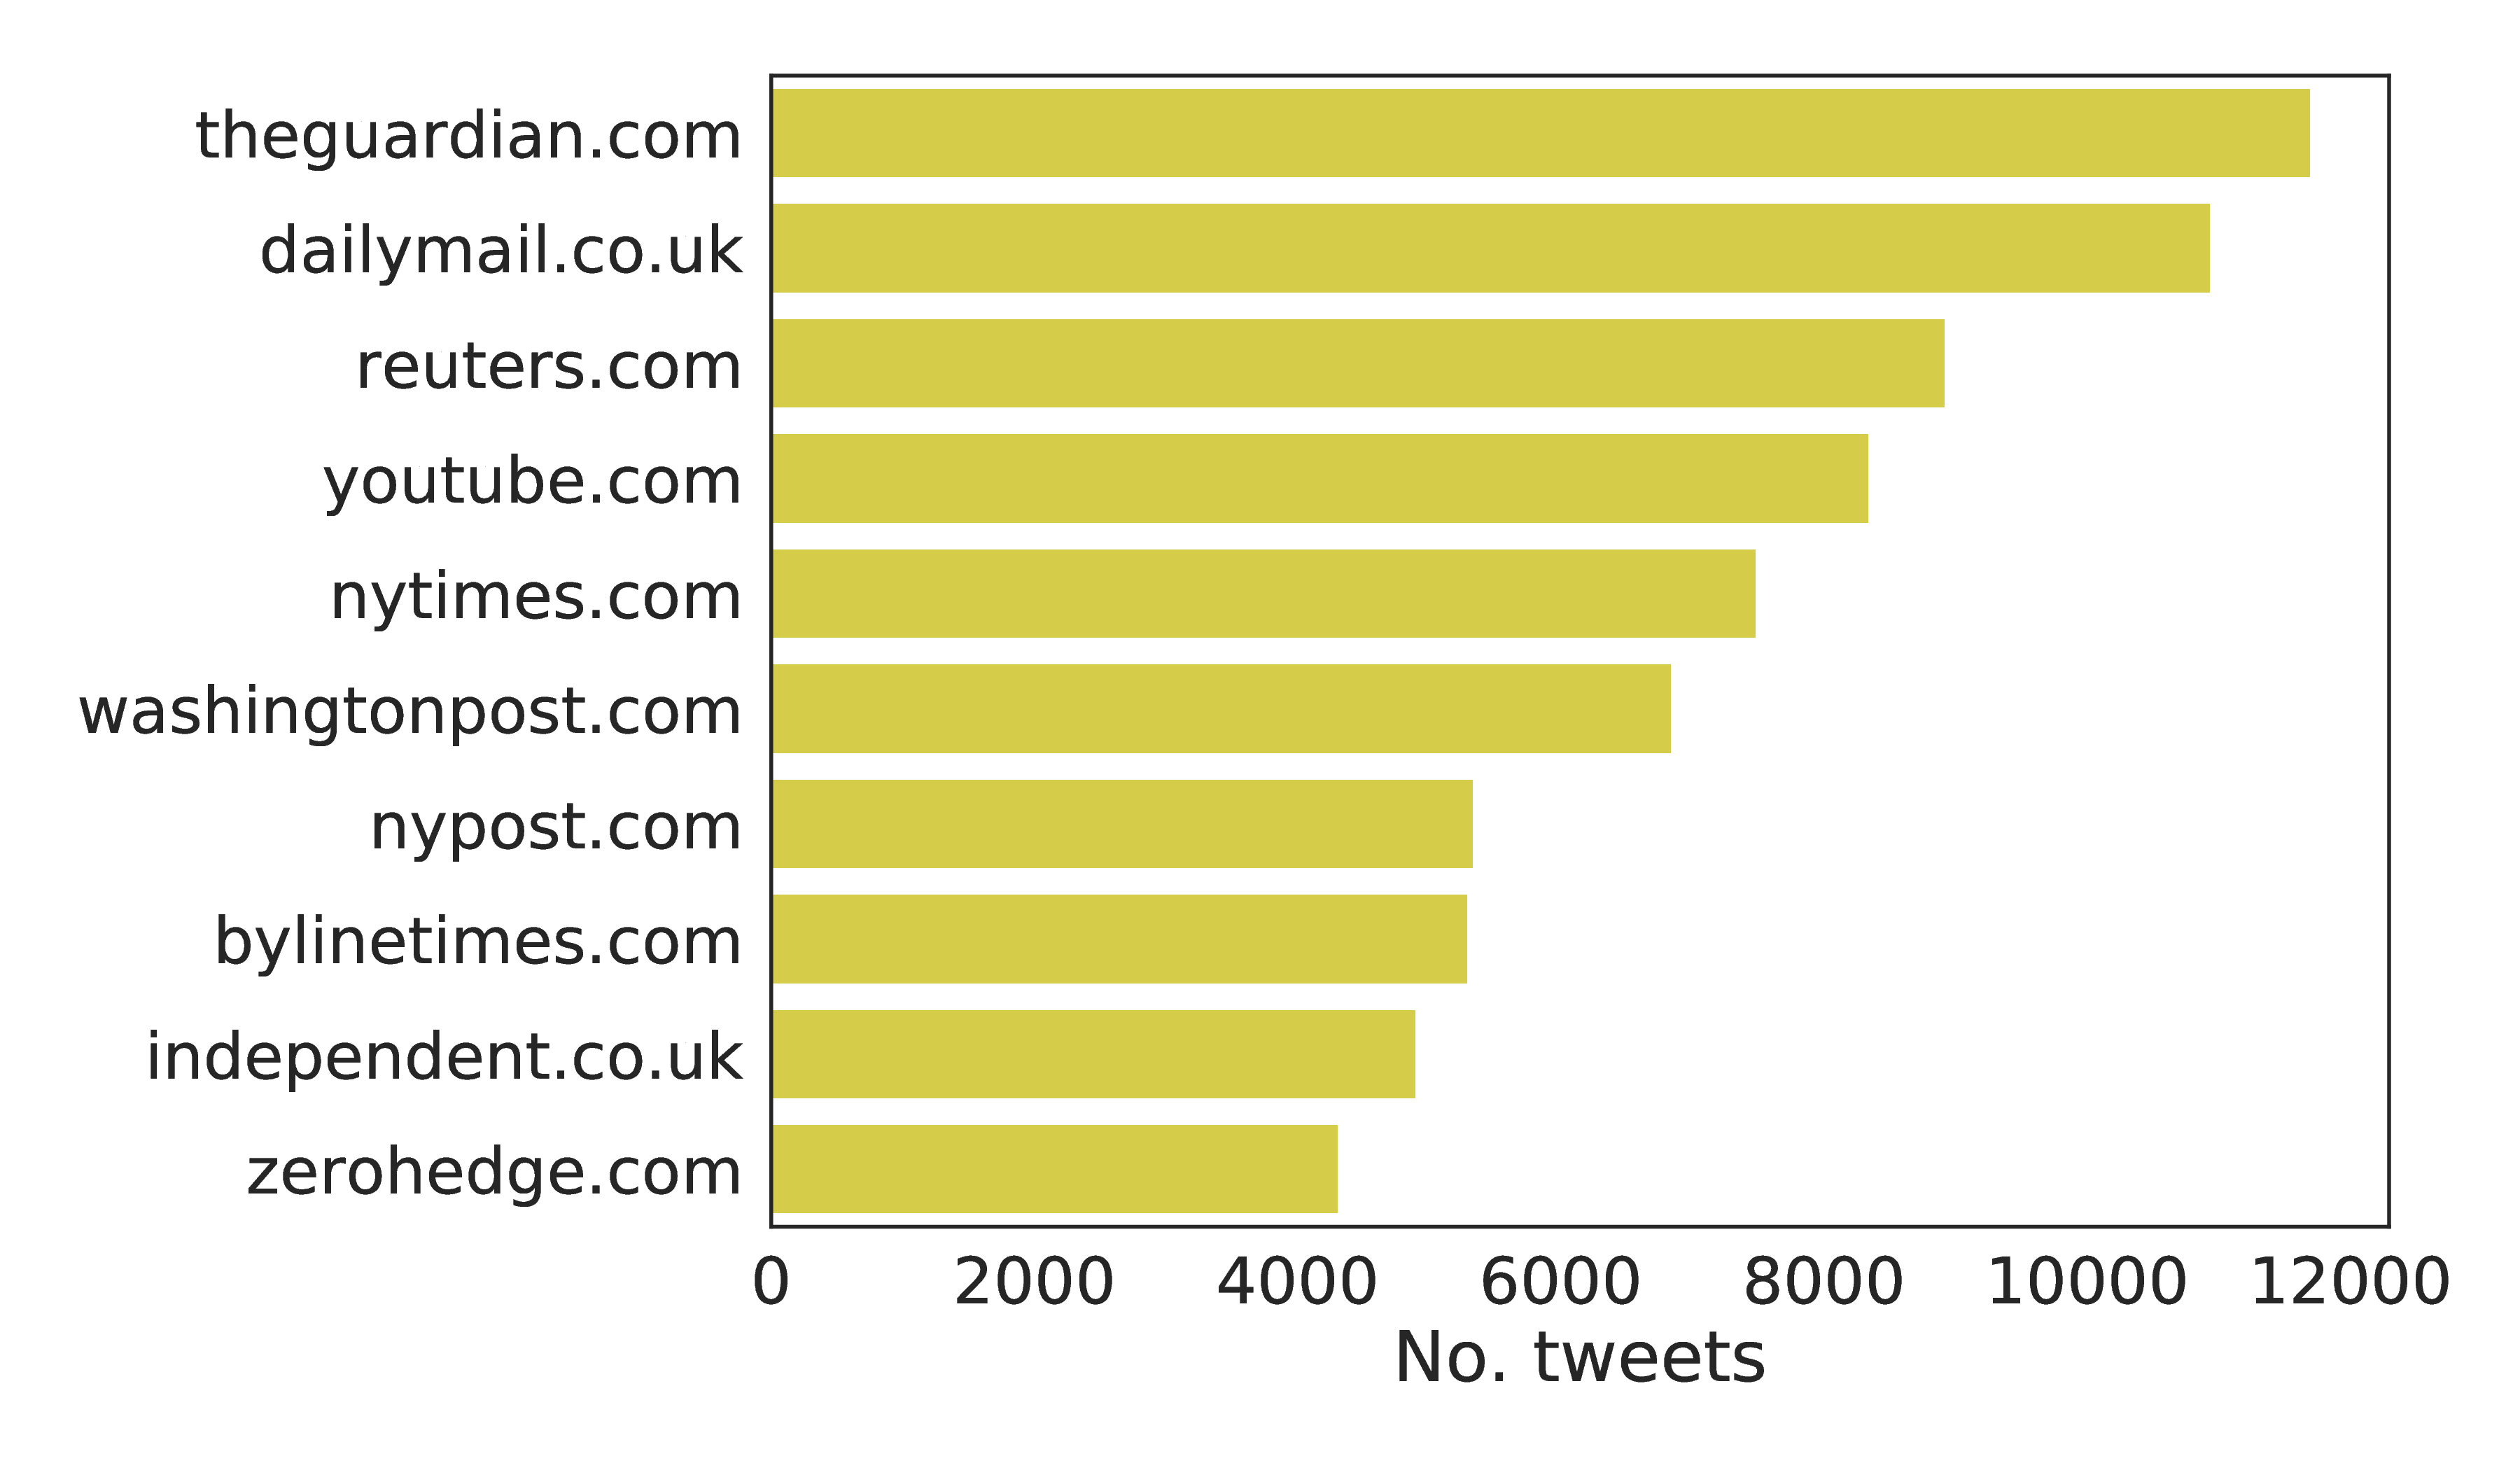
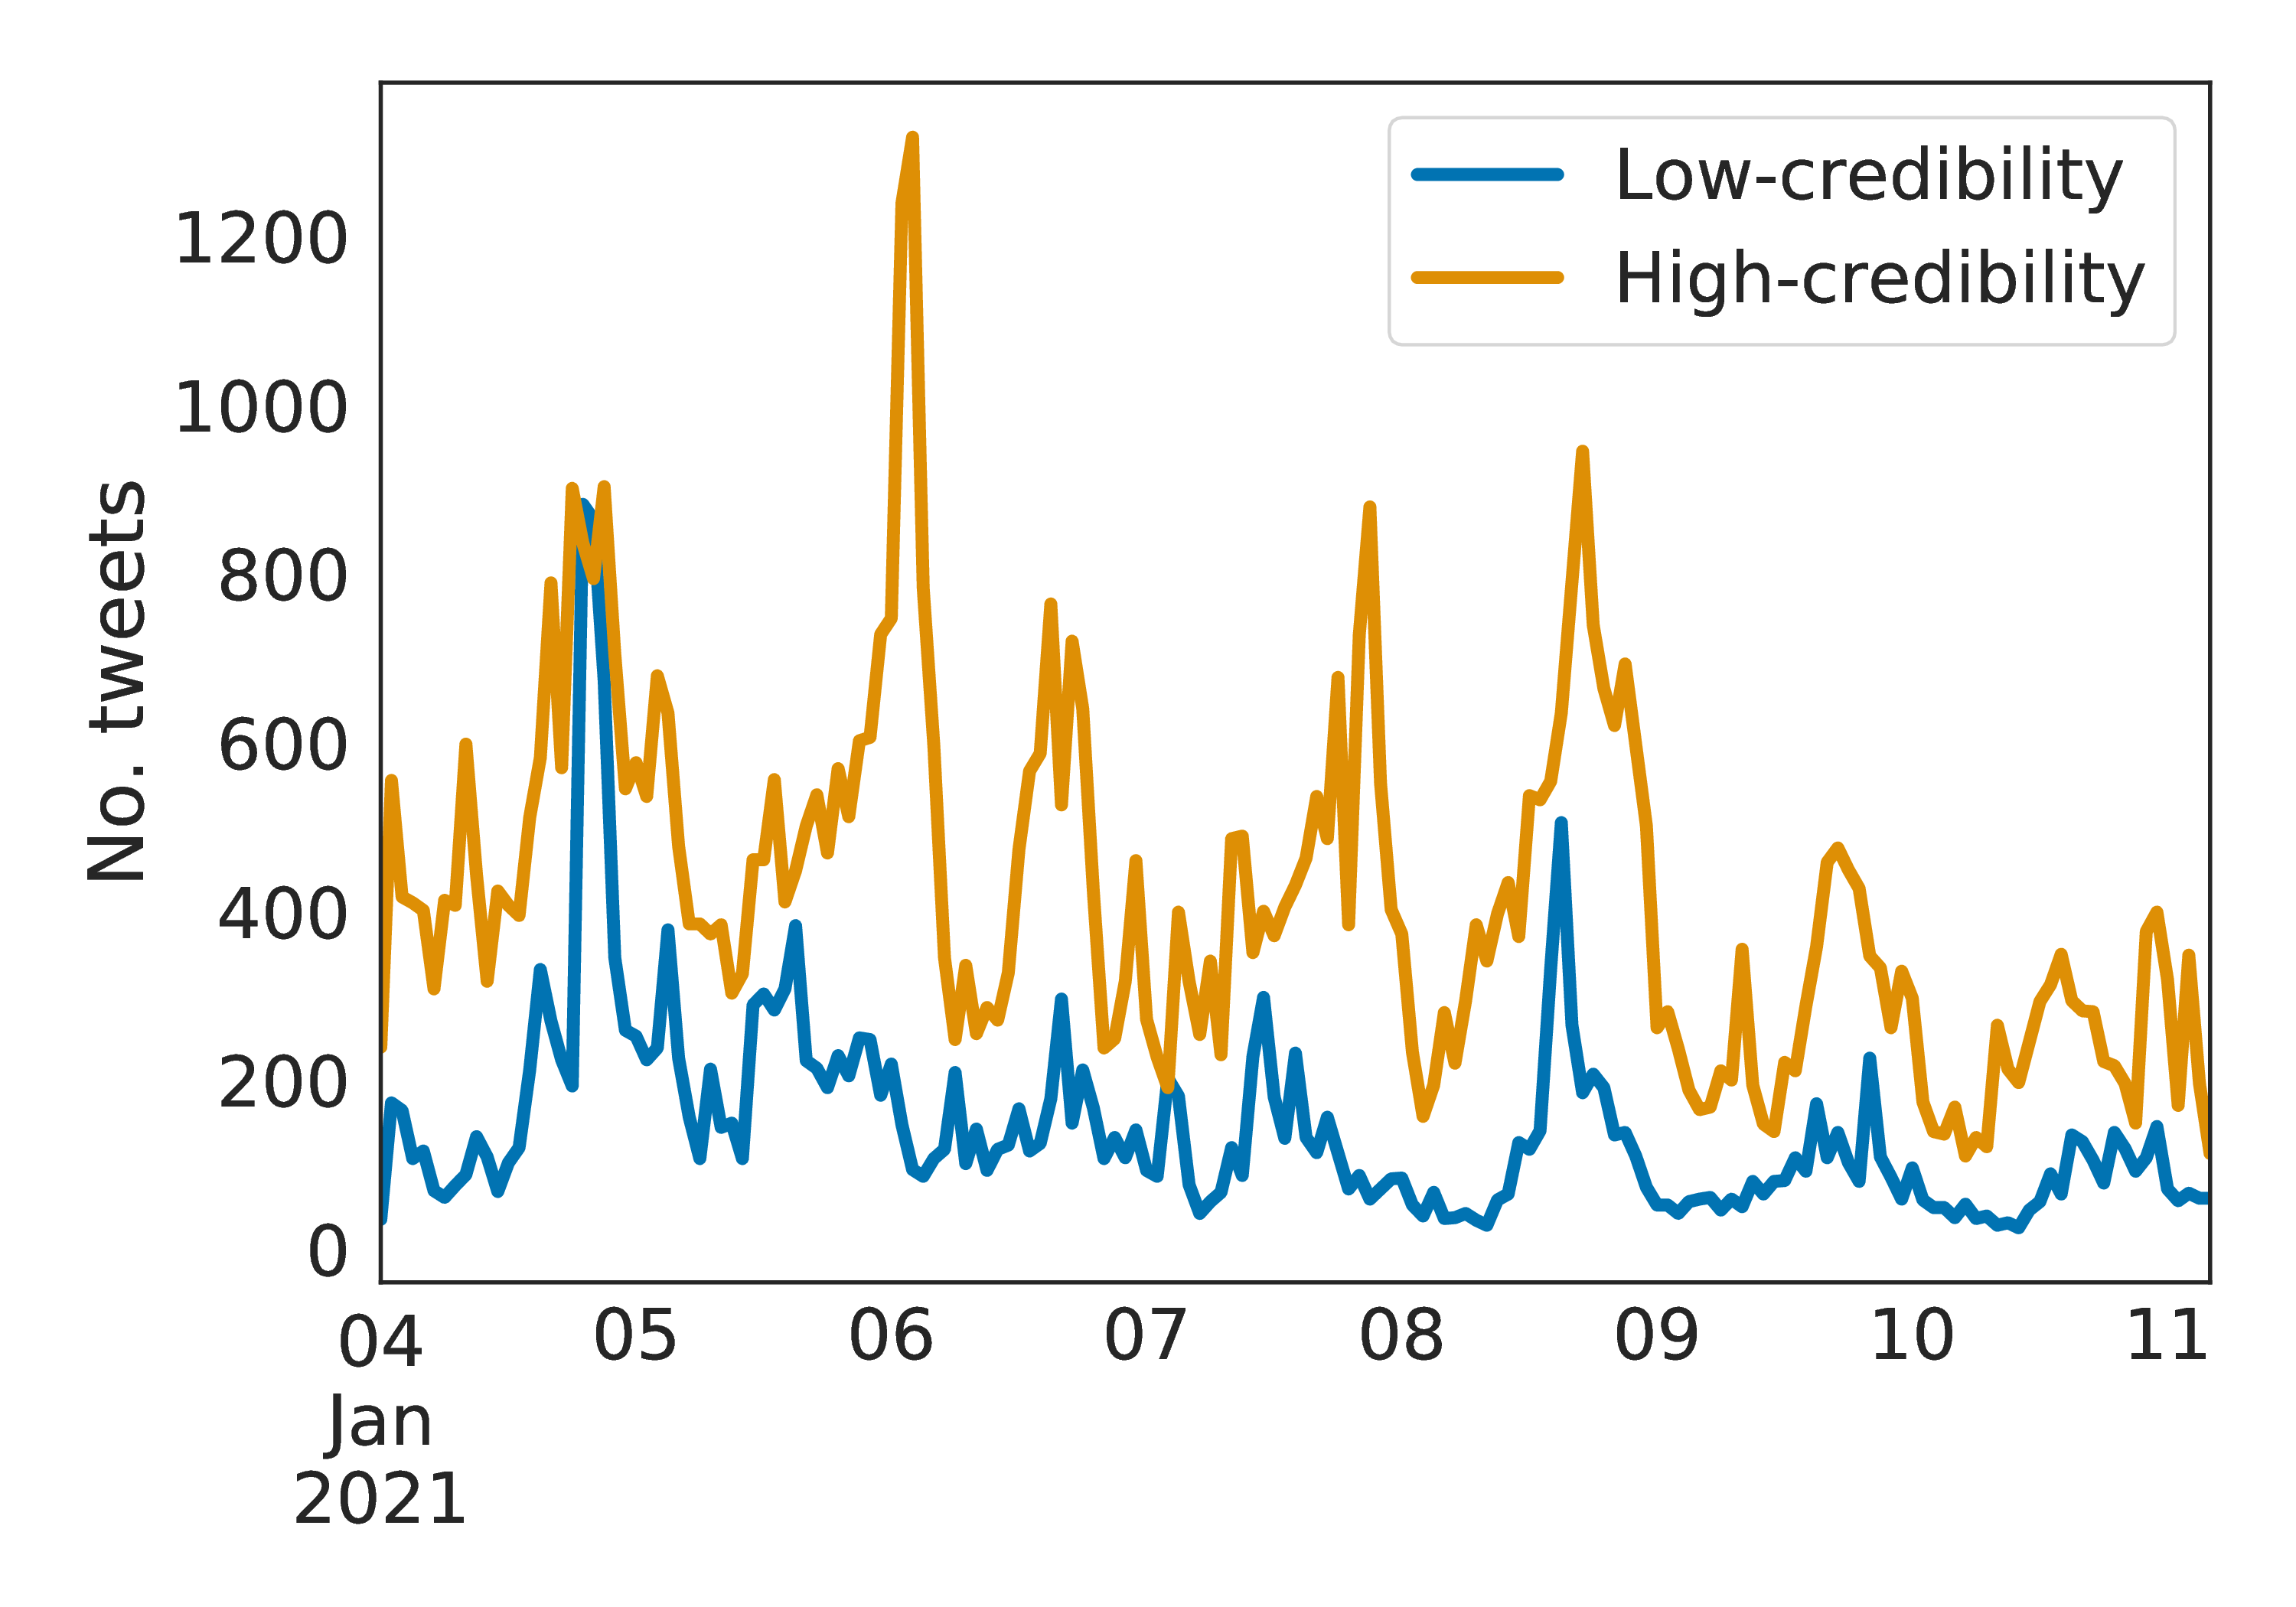
Figure 9 provides time series data illustrating the prevalence of low- and high-credibility information. We follow an approach widely adopted in the literature (Lazer et al. 2018; Shao et al. 2018; Bovet and Makse 2019; Grinberg et al. 2019; Yang et al. 2021) to label links to news articles based on source reliability. In particular, we use a third-party list of 675 low-credibility sources101010https://iffy.news/iffy-plus/ (accessed November 2020) and 26 hand-selected mainstream sources. The mainstream sources in this list are labeled by the Media Bias / Fact Check organization as having a factual reporting record as “very high”, “high”, “mostly factual” or “mixed.” We refer to them as “high-credibility” throughout the paper for simplicity. Overall, links to low-credibility sources account for 24,841 tweets compared to 72,680 tweets linking to our sample of mainstream sources. Readers should note that these numbers do not fully capture the news circulating on Twitter, as the lists we employ cannot be exhaustive.
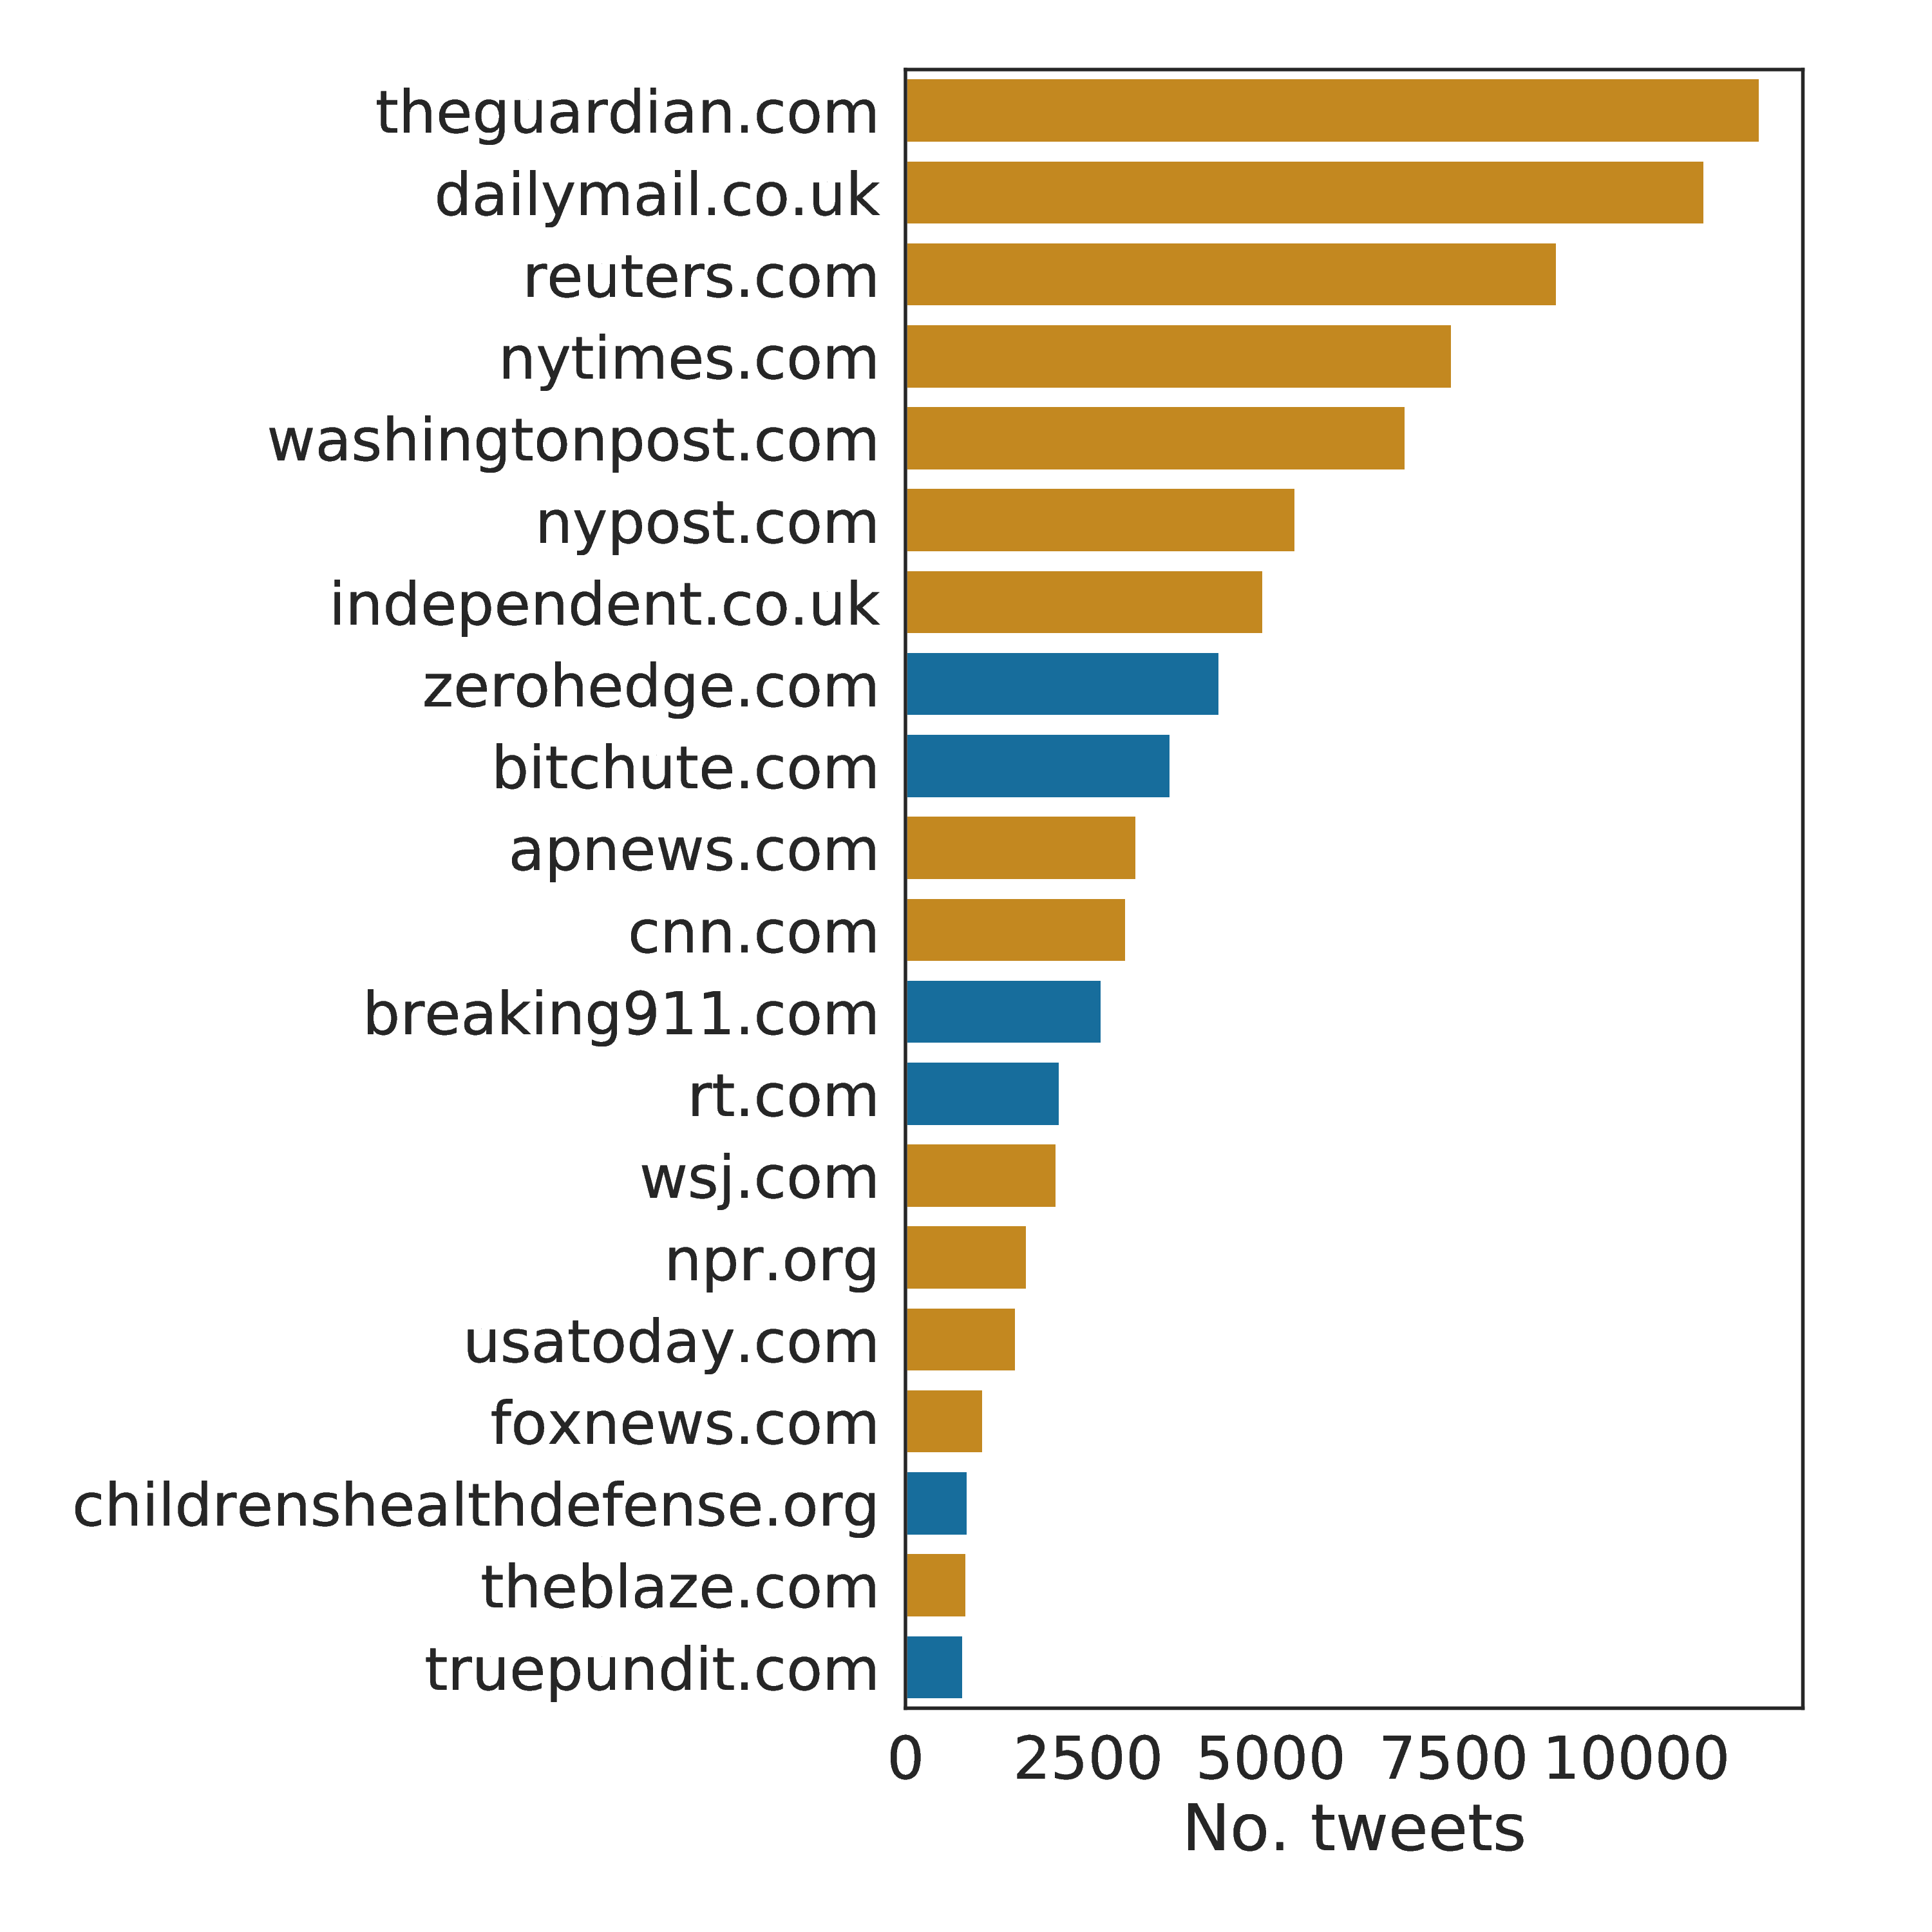
We further list in Figure 10 the 20 most shared news sources in both classes. We notice several unreliable sources (cf. “zerohedge.com” and “bitchute.com”) that exhibit prevalence comparable to more reliable websites.
Discussion
In this paper we present a new public dataset tracking discourse about COVID-19 vaccines on Twitter. We characterize the data in several ways, including prominent keywords, geographic distribution of tweets, and clusters of related hashtags. We also present a data dashboard that visualizes statistics and insights from this data.
In future work, we intend to explore the relationship between online discussion of COVID-19 vaccines and public health outcomes, like COVID-19 mortality and vaccine uptake. We will also leverage existing social media analysis tools to track emerging narratives and suspicious accounts, such as bots, coordinated campaigns, and troll farms (Yang, Hui, and Menczer 2019; Yang et al. 2021; Pierri, Piccardi, and Ceri 2020a, b; Pacheco et al. 2021). Finally, we plan to explore models to better understand how vaccine misinformation and anti-vaccine sentiment spreads on social media.
This dataset has some key limitations. Critically, Twitter users are not a representative sample of the population, nor are their posts a representative sample of public opinions (Wojick and Hughes 2020). Additionally, filtering our stream to include only English-language tweets comes at the price of occasionally excluding some variants of this language. This is because our stream gathers tweets that have been marked as containing English by Twitter’s automatic language identification system, which may not capture some tweets by minority dialect speakers and multilingual speakers (Jurgens, Tsvetkov, and Jurafsky 2017).
The Twitter Filtered Stream API imposes a rate limitation of 1% of all public tweets, which could limit our ability to capture all relevant content in the future. Fortunately, if this happens, Twitter provides the number of tweets not delivered within our stream. During the week described herein, we did not encounter this limitation.
Another potential source of bias is the keyword sampling procedure used to identify and collect COVID-19 vaccine related content, which involved evaluation of keywords to determine what was relevant. We are unable to fully exclude irrelevant content using only keyword-based filtering. However, further filtering is possible at a later stage. Other researchers may also refine the data to properly address their own topics of interest.
Given the large-scale, real-time nature of our data collection infrastructure, users do not have the ability to opt-out. This raises important ethical concerns related to anonymity. To address this concern, we note that (1) our dashboard only displays aggregate data, obfuscating the ability of users to identify those captured within our data; and (2) should a user delete a tweet or account, the related information will not be returned by Twitter during the re-hydration process.
The long-term aim of this project is to tackle the ambitious challenge of linking social media observations directly to public health. We hope that researchers will be able to leverage the CoVaxxy dataset to obtain a clearer picture of how vaccine hesitancy and misinformation affect health outcomes. In turn, such insight might enable public health officials to design better strategies for confronting vaccine hesitancy and refusal.
Acknowledgments
This work was supported in part by the Knight Foundation, Craig Newmark Philanthropies, DARPA (grant W911NF-17-C-0094), EU H2020 (grant 101016233 “PERISCOPE”), and NSF (NRT award 1735095). Any opinions, findings, and conclusions or recommendations expressed in this paper are those of the authors and do not necessarily reflect the views of the funding agencies.
References
- Aguas et al. (2020) Aguas, R.; Corder, R. M.; King, J. G.; Gonçalves, G.; Ferreira, M. U.; and Gomes, M. G. M. 2020. Herd immunity thresholds for SARS-CoV-2 estimated from unfolding epidemics. medRxiv doi:10.1101/2020.07.23.20160762.
- Blondel et al. (2008) Blondel, V. D.; Guillaume, J.-L.; Lambiotte, R.; and Lefebvre, E. 2008. Fast Unfolding of Communities in Large Networks. Journal of Statistical Mechanics: Theory and Experiment 2008(10): P10008.
- Bovet and Makse (2019) Bovet, A.; and Makse, H. A. 2019. Influence of fake news in Twitter during the 2016 US presidential election. Nature Communications 10(1): 7.
- Broniatowski et al. (2018) Broniatowski, D. A.; Jamison, A. M.; Qi, S.; AlKulaib, L.; Chen, T.; Benton, A.; Quinn, S. C.; and Dredze, M. 2018. Weaponized health communication: Twitter bots and Russian trolls amplify the vaccine debate. American Journal of Public Health 108(10): 1378–1384.
- Brunson (2013) Brunson, E. K. 2013. The Impact of Social Networks on Parents’ Vaccination Decisions. Pediatrics 131(5): e1397–e1404. doi:10.1542/peds.2012-2452.
- Burki (2019) Burki, T. 2019. Vaccine Misinformation and Social Media. The Lancet Digital Health 1(6): e258–e259. doi:10.1016/S2589-7500(19)30136-0.
- Chen, Lerman, and Ferrara (2020) Chen, E.; Lerman, K.; and Ferrara, E. 2020. Tracking Social Media Discourse About the COVID-19 Pandemic: Development of a Public Coronavirus Twitter Data Set. JMIR Public Health and Surveillance 6(2): e19273.
- Conover et al. (2012) Conover, M. D.; Gonçalves, B.; Flammini, A.; and Menczer, F. 2012. Partisan asymmetries in online political activity. EPJ Data Science 1(6).
- DeVerna et al. (2021) DeVerna, M.; Pierri, F.; Truong, B. T.; Bollenbacher, J.; Axelrod, D.; Loynes, N.; Torres-Lugo, C.; Yang, K.-C.; Menczer, F.; and Bryden, J. 2021. CoVaxxy Tweet IDs dataset. Zenodo. doi:10.5281/zenodo.4526494.
- Dong, Du, and Gardner (2020) Dong, E.; Du, H.; and Gardner, L. 2020. An interactive web-based dashboard to track COVID-19 in real time. The Lancet Infectious Diseases 20(5): 533–534.
- Funk and Tyson (2020) Funk, C.; and Tyson, A. 2020. Intent to get a COVID-19 vaccine rises to 60% as confidence in research and development process increases. Pew Research Center, https://www.pewresearch.org/science/2020/12/03/intent-to-get-a-covid-19-vaccine-rises-to-60-as-confidence-in-research-and-development-process-increases/ (accessed January, 2021).
- Grinberg et al. (2019) Grinberg, N.; Joseph, K.; Friedland, L.; Swire-Thompson, B.; and Lazer, D. 2019. Fake news on Twitter during the 2016 U.S. presidential election. Science 363(6425): 374–378.
- Hamel, Kirzinger, and Brodie (2020) Hamel, L.; Kirzinger, A.; and Brodie, M. 2020. KFF COVID-19 Vaccine Monitor: December 2020. KFF Health Tracking Poll, https://www.kff.org/coronavirus-covid-19/report/kff-covid-19-vaccine-monitor-december-2020 (accessed January, 2021).
- Huang et al. (2020) Huang, X.; Jamison, A.; Broniatowski, D.; Quinn, S.; and Dredze, M. 2020. Coronavirus Twitter Data: A collection of COVID-19 tweets with automated annotations. Zenodo. doi:10.5281/zenodo.4393598.
- Hussain et al. (2018) Hussain, A.; Ali, S.; Ahmed, M.; and Hussain, S. 2018. The Anti-Vaccination Movement: A Regression in Modern Medicine. Cureus 10(7).
- Johnson et al. (2020) Johnson, N. F.; Velásquez, N.; Restrepo, N. J.; Leahy, R.; Gabriel, N.; El Oud, S.; Zheng, M.; Manrique, P.; Wuchty, S.; and Lupu, Y. 2020. The Online Competition between Pro- and Anti-Vaccination Views. Nature 582(7811): 230–233.
- Jurgens, Tsvetkov, and Jurafsky (2017) Jurgens, D.; Tsvetkov, Y.; and Jurafsky, D. 2017. Incorporating Dialectal Variability for Socially Equitable Language Identification. In Proceedings of the 55th Annual Meeting of the Association for Computational Linguistics, 51–57. Vancouver, Canada: Association for Computational Linguistics.
- Lamsal (2020) Lamsal, R. 2020. Coronavirus (COVID-19) Tweets Dataset. IEEE Dataport. doi:10.21227/781w-ef42.
- Lazer et al. (2018) Lazer, D.; Baum, M.; Benkler, Y.; Berinsky, A.; Greenhill, K.; et al. 2018. The science of fake news. Science 359(6380): 1094–1096.
- Orenstein and Ahmed (2017) Orenstein, W. A.; and Ahmed, R. 2017. Simply put: Vaccination saves lives. Proceedings of the National Academy of Sciences 114(16): 4031–4033.
- Pacheco et al. (2021) Pacheco, D.; Hui, P.-M.; Torres-Lugo, C.; Truong, B. T.; Flammini, A.; and Menczer, F. 2021. Uncovering Coordinated Networks on Social Media. In Proc. AAAI Intl. Conf. on Web and Social Media (ICWSM). In press; preprint arXiv:2001.05658.
- Pierri, Piccardi, and Ceri (2020a) Pierri, F.; Piccardi, C.; and Ceri, S. 2020a. A multi-layer approach to disinformation detection in US and Italian news spreading on Twitter. EPJ Data Science 9(35).
- Pierri, Piccardi, and Ceri (2020b) Pierri, F.; Piccardi, C.; and Ceri, S. 2020b. Topology comparison of Twitter diffusion networks effectively reveals misleading news. Scientific Reports 10: 1372.
- Roozenbeek et al. (2020) Roozenbeek, J.; Schneider, C. R.; Dryhurst, S.; Kerr, J.; Freeman, A. L. J.; Recchia, G.; van der Bles, A. M.; and van der Linden, S. 2020. Susceptibility to misinformation about COVID-19 around the world. Royal Society Open Science 7(10): 201199.
- Shao et al. (2018) Shao, C.; Ciampaglia, G. L.; Varol, O.; Yang, K.-C.; Flammini, A.; and Menczer, F. 2018. The spread of low-credibility content by social bots. Nature Communications 9: 4787.
- Stewart et al. (2015) Stewart, C. A.; Cockerill, T. M.; Foster, I.; Hancock, D.; Merchant, N.; Skidmore, E.; Stanzione, D.; Taylor, J.; Tuecke, S.; Turner, G.; Vaughn, M.; and Gaffney, N. I. 2015. Jetstream: A Self-Provisioned, Scalable Science and Engineering Cloud Environment. In Proceedings of the 2015 XSEDE Conference: Scientific Advancements Enabled by Enhanced Cyberinfrastructure, XSEDE ’15, 1–8. Association for Computing Machinery.
- Towns et al. (2014) Towns, J.; Cockerill, T.; Dahan, M.; Foster, I.; Gaither, K.; Grimshaw, A.; Hazlewood, V.; Lathrop, S.; Lifka, D.; Peterson, G. D.; Roskies, R.; Scott, J. R.; and Wilkins-Diehr, N. 2014. XSEDE: Accelerating Scientific Discovery. Computing in Science & Engineering 16(5): 62–74.
- Wojick and Hughes (2020) Wojick, S.; and Hughes, A. 2020. Sizing Up Twitter Users. Pew Research Center, https://www.pewresearch.org/internet/2019/04/24/sizing-up-twitter-users/ (accessed January, 2021).
- Yang, Hui, and Menczer (2019) Yang, K.-C.; Hui, P.-M.; and Menczer, F. 2019. Bot electioneering volume: Visualizing social bot activity during elections. In Companion Proceedings of The 2019 World Wide Web Conference, 214–217.
- Yang et al. (2021) Yang, K.-C.; Pierri, F.; Hui, P.-M.; Axelrod, D.; Torres-Lugo, C.; Bryden, J.; and Menczer, F. 2021. The COVID-19 Infodemic: Twitter versus Facebook. Big Data & Society In press; preprint arXiv:2012.09353.