Supplementary
Role of interface morphology on the martensitic transformation in pure Fe
Abstract
Using classical molecular dynamics simulations, we study austenite to ferrite phase transformation in iron, focusing on the role of interface morphology. We compare two different morphologies; a flat interface in which the two phases are joined according to Nishiyama-Wasserman orientation relationship vs. a ledged one, having steps similar to the vicinal surface. We identify the atomic displacements along a misfit dislocation network at the interface leading to the phase transformation. In case of ledged interface, stacking faults are nucleated at the steps, which hinder the interface motion, leading to a lower mobility of the inter-phase boundary, than that of flat interface. Interestingly, we also find the temperature dependence of the interface mobility to show opposite trends in case of flat vs. ledged boundary. We believe that our study is going to present a unified and comprehensive view of martensitic transformation in iron with different interface morphology, which is lacking at present, as flat and ledged interfaces are treated separately in the existing literature.
I Introduction
High temperature Austenite (-phase, face centered cubic or FCC) to low temperature ferrite (-phase, body centered cubic or BCC) phase transformation in iron is crucial, as it governs microstructure, and subsequently various material properties of different types of steels.Moritani et al. (2002); Caballero and Bhadeshia (2004); Raabe et al. (2013); Wang et al. (2014a); Toji et al. (2015) As iron is quenched, the transformation from the high to low temperature phase is known to take place via a diffusionless process, which can further be subdivided in two categories, martensitic and massive. In case of martensitic transformation, a definite orientation relationship (OR) between the parent and product phase is required to facilitate coordinated movement of atoms (at the velocity of the sound Bunshah and Mehl (1953)), giving rise to the name military transformation. Massive transformation, on the other hand, is civilian in nature, as the atoms move individually and there is no restriction on OR between the parent and product phase. During the transformation, the motion of the interface is dependent on temperature and cooling rate; and it is also affected by various factors like interface morphology, grain boundaries, alloying elements, and precipitates etc.Moritani et al. (2002); Caballero and Bhadeshia (2004); Raabe et al. (2013); Wang et al. (2014a); Toji et al. (2015)
During the phase transition certain transformation paths are followed, depending on the ORs between the parent and product phase. In 1930, Kurdjumov - Sachs (KS) Kurdjumow and Sachs (1930) identified an OR in mild steel using X-ray diffraction as and later, Nishiyama -Wasserman (NW) Nishiyama (1934) found a slightly distinct OR as in Fe-30Ni alloys. Based on the crystal symmetry of the two parent phases, 24 and 12 orientational variants are possible in KSKurdjumow and Sachs (1930) and NWNishiyama (1934) ORs, respectively. Several other ORs, like BainBain and Dunkirk (1924), PitschPitsch (1962) and Greninger and TroianoGreninger and Troiano (1949) have also been discussed in the literature.
Our work is concerned with the austenite to ferrite phase transition in iron, where we consider the inter-phase interface to be formed according to NW OR or some derivative of it. For this particular OR, the inter-phase boundary is classified as a semi-coherent interface, having an array of dislocations (termed as misfit dislocations), which help to partially reduce the misfit strain, originating from the lattice mismatch across the interface. It is now widely accepted that experimentally observed ORs do not correspond exactly to NW (or KS). The deviations can appear in the form of ledges or disconnections, which exhibit both step character and dislocation properties and higher index habit planes are observed at the inter-phase boundary.Shiflet and Merwe (1994); Shiflet and van der Merwe (1994)
Mainly because of importance of steel as a structural material, austenite to ferrite phase transition in iron is a widely researched topic. Various aspects of transformation have been investigated in pure ironLee et al. (2013); Bos et al. (2006); Tateyama et al. (2008); Sandoval et al. (2009); Sandoval and Urbassek (2009a); Song and Hoyt (2012, 2013, 2018, 2015); Tripathi et al. (2018); Wang and Urbassek (2013a); Sinclair and Hoagland (2008), iron alloys Wang et al. (2014b, c), thin filmsWang and Urbassek (2013b), single crystals Karewar et al. (2018, 2019), bicrystals Karewar et al. (2020), and nanowiresSandoval and Urbassek (2009b, c). Several studies, based on molecular dynamics (MD) simulations, cover kinetics and atomic mechanisms during the transformation, for flatBos et al. (2006); Wang and Urbassek (2013a); Sandoval and Urbassek (2009c), as well as ledged interfaces Song and Hoyt (2012, 2013); Tripathi et al. (2018). Bos et al. Bos et al. (2006) performed MD simulations for several possible ORs and concluded that martensitic transformation takes place with the aid of glissile screw dislocation networks nucleated at the interface during the incubation time. Tateyama et al.Tateyama et al. (2008) found a planar and needle-like growth in case of NW and KS OR, respectively. They also reported a decrease in interface velocity when the parent and product phase was rotated in the range of from NW to KS OR. Wang and Urbassek Wang and Urbassek (2013a) conducted MD simulation to uncover the pressure and temperature dependence of the FCC-BCC transformation using Meyer-Entel potential and identified the phonon softening, leading to the phase transition. Song and Hoyt Song and Hoyt (2013) investigated an inter-phase boundary obeying NW OR, along with structural disconnections (sessile in nature) and reported the nucleation and movement of a secondary set of glissile disconnections at the terrace plane, leading to the FCC-BCC transformation. Ou et al. Ou et al. (2016) investigated three semicoherent interfaces joined by NW, KS, and Nagano ORs and found martensitic transformations in the coherent areas of the interface (having low potential energy), while some diffusional jumps were also observed in the incoherent areas (having high potential energy). Karewar et al. Karewar et al. (2018, 2019) conducted a MD simulation of martensitic transformation in single-crystal Fe and Fe-C systems with different planar defects such as twin boundaries and stacking faults (SFs). They observed several well-known transformation mechanisms (such as NW, KS, Burgers path Burgers (1934), and BB/OC model Bogers and Burgers (1964); Olson and Cohen (1972)) depending on the type of the defect structure present in the simulation system. Tripathi et al. Tripathi et al. (2018) reported that the ledges or disconnections at the interface are the preferential nucleation sites for the BCC phase and interface movement was guided by the growth of the BCC phase along the ledge vector. Maresca et al. Maresca and Curtin (2017) also studied the motion of the ledged FCC/BCC interface. A recent MD study by Karewar et al. Karewar et al. (2020) discussed the role of misfit dislocations on the martensitic transformation in case of a flat interface. The authors observed that the screw dislocations within the interface plane govern the atomic displacements, leading to the phase transformation.
The phenomenological theory of martensitic transformation Bhadeshia and Wayman (2014) provides the orientation relationship between the parent and product phases but does not elaborate on the atomistic displacements during the transformation. Similarly, most of the MD studies mentioned in the previous paragraphBos et al. (2006); Tateyama et al. (2008); Sandoval et al. (2009); Sandoval and Urbassek (2009a); Song and Hoyt (2012, 2013, 2018, 2015); Tripathi et al. (2018); Wang and Urbassek (2013a); Sinclair and Hoagland (2008); Wang et al. (2014b, c); Wang and Urbassek (2013b); Sandoval and Urbassek (2009b, c); Wang and Urbassek (2013a); Karewar et al. (2020); Maresca and Curtin (2017); Sandoval and Urbassek (2009b); Ou et al. (2016) do not explicitly discuss the movements of the individual or group of atoms during the transformation. Further, all the studies focus on transformation in the presence of either flat or ledged interfaces, lacking a clear qualitative or quantitative comparison among different interface morphologies. Moreover, there exist conflicting reports on the mobility of the interface, with some studies claiming the flat interface to be immobile,Song and Hoyt (2012, 2013, 2018); Tripathi et al. (2018) contradicting with others.Bos et al. (2006); Tateyama et al. (2008); Ou et al. (2016) In order to bridge this gap, one needs to compare transformation in flat vs. ledged interfaces using exactly similar simulation parameters like boundary conditions, interatomic potential, thermostat and barostat etc. In this work, we attempt to resolve this issue by studying atomic mechanisms during the austenite to ferrite phase transformation in iron using classical MD simulations. We capture several on-the-fly pictures of atomic displacements during the martensitic transformation. By doing this, we are able to provide a comprehensive description of the martensitic transformation in iron; specifically, the effect of morphology, by comparing flat vs. ledged interfaces, which has not been done so far (to the best of our knowledge). We identify two distinct types of atomic motions leading to the phase transformation; one set of movements (mainly along the misfit dislocation network present at the interface) are confined to the interface planes and the other having out-of-the interface plane component as well (the latter observed exclusively in case of the ledged interface). Interestingly, the temperature dependence of the interface mobility is found to show opposite trends in case of flat and ledged interfaces.
II Simulation Details
Atomic trajectories are obtained using classical MD simulations, as implemented in Large-scale Atomic/Molecular Massively Parallel Simulator (LAMMPS).lam (1995) An embedded atom method (EAM) based potential, developed by Ackland et al.Ackland et al. (1997), is used to describe the inter-atomic interactions among the iron atoms. Several materials characteristics, like lattice parameter, cohesive energy, vacancy formation energy, and elastic constants, predicted by this potential are known to be in good agreement with the experimental data, as well as density functional theory (DFT) based predictions.Tripathi et al. (2018) However, this empirical potential overestimates the melting point of FeSun et al. (2004) and also fails to correctly predict the austenite-ferrite transition temperature of 1185 K. Despite these limitations, Ackland potential has been used in several MD studies of iron, including the FCC-to-BCC phase transformation.Song and Hoyt (2012, 2013); Abe et al. (2016); Terentyev et al. (2016)
| Phase | Direction | Orientation | Dimensions (Å) | Tilt angle | No. of atoms |
| BCC (Flat) | x y z | 20.39 260.97 77.85 | - | 69120 | |
| BCC (Ledged) | x y z | 20.39 240.58 77.85 | - | 63720 | |
| FCC (Flat) | x y z | ] | 261.17 261.71 78.15 | 0∘ | 351480 |
| FCC (Ledged) | x y z | ] | 213.24 241.25 78.15 | 4.04∘ | 321600 |
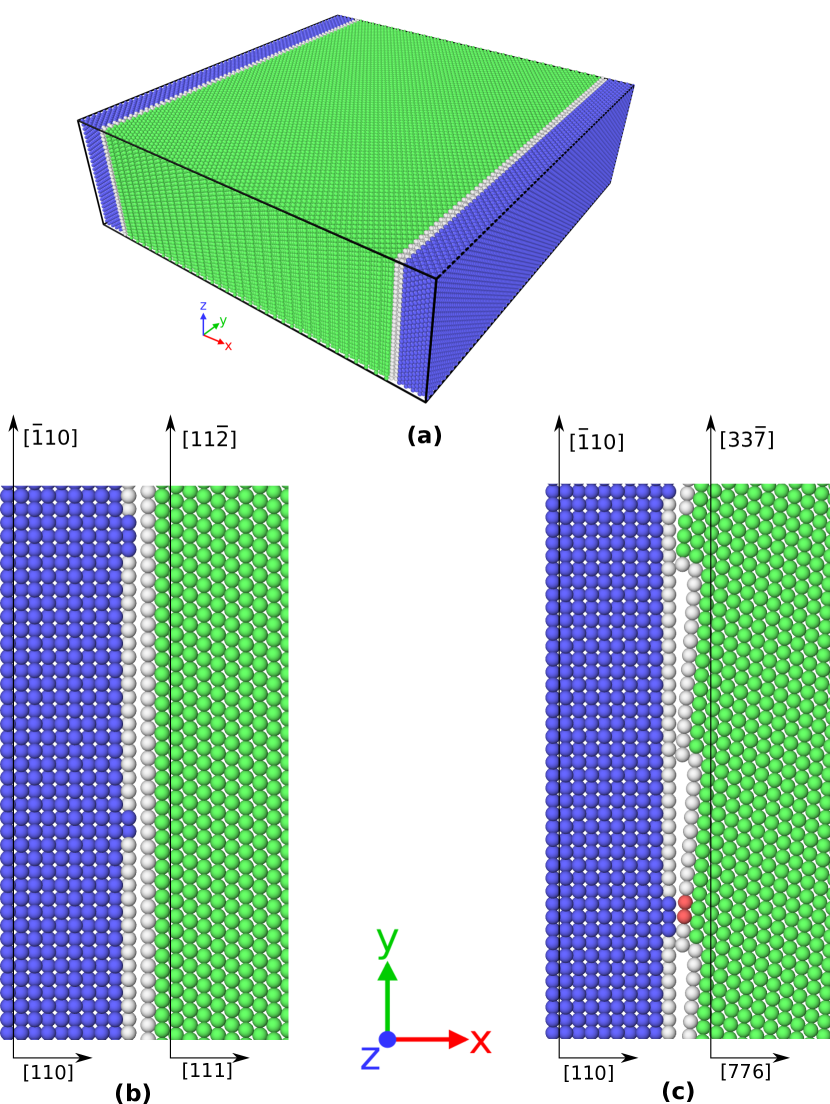
A sandwich structure of the BCC-FCC-BCC sequence is created, such that the -axis is normal to the phase boundary, which is aligned parallel to the plane [Figure 1(a)]. The crystallographic orientation of , , and direction of the BCC and FCC regions, and their dimensions (at T=600 K) are listed in Table 1. After creating the two regions separately, they are joined together to get the final simulation box of BCC-FCC-BCC sandwich shape [Fig. 1(a)]. Spacing between BCC and FCC phase is taken as an average of inter-planar spacing of both the phases. The and dimensions of the BCC and FCC phases are chosen very carefully, such that the mismatch of the dimensions at the cross-section is minimal (less than 0.5%). A large mismatch leads to high stresses at the phase boundary, which may affect the transformation behavior. The sandwich shaped simulation box remains periodic and without any free surfaces in each direction.
Two types of interfaces, namely flat [Figure 1 (b)] and ledged [Figure 1 (c)], are created. The flat interface is created using ideal NW OR, such that
.
In case of the ledged interface, the FCC phase is rotated about the -direction (parallel to the direction of FCC) by an angle of , with respect to the ideal NW OR [Table 1]. As a result of this, and axis becomes parallel to the crystallographic directions and , respectively, in the FCC phase. Because of the rotation, the ledged interface contain steps with one atom height in the FCC side of the interface [Fig. 1(c)], similar to the vicinal surface. A detailed analysis of the phase boundary is given in our previous work Tripathi et al. (2018), while the important features relevant for the current work are shown in Fig S1 in the Supporting Information. According to adaptive common neighbor analysis (a-CNA)Stukowski (2012), most of the atoms present at the phase boundary does not belong to the parent BCC or product FCC phase, but marked as some unidentified category, which happens because of the lattice parameter mismatch between the parent phases. After creating the sandwich shaped simulation box, both BCC and FCC phases are individually equilibrated, first using NVT ensemble for 100 ps to bring all the atoms in thermal equilibrium. Subsequently, NPxT ensemble is used for volume equilibration for another 100 ps, keeping and dimensions fixed. This reduced the stresses in the simulation system to less than 20 MPa. After equilibrating the BCC and FCC phases independently, phase transformation dynamics are executed using the NPT ensemble for 5-30 ns (depending on interface type and temperature). During the phase transformation, each dimension was allowed to equilibrate independently to reduce the transformation stresses.
Four different values of temperature (600 K, 800 K, 1000 K, and 1200 K) are chosen to study the transformation kinetics in the flat and ledged interface. The thermal vibrations of the atoms at high temperatures make it difficult to identify the atomic displacements responsible for FCC-to-BCC transformation. Therefore, atomic positions averaged over 1 ps are used for the purpose of visualization and data analysis. The atomic displacements are further scaled by a factor of 1.75 for better visibility. Detailed analysis of the interface (in terms of misfit dislocations) is carried out at an even low temperature of 100 K, than that of transformation dynamics (600 to 1200 K). We use Nye Tensor analysis in the assigned mode (NTA),Hartley and Mishin (2005); Nye (1953) as implemented in AADIS (atomistic analyzer for dislocation character and distribution) code, Yao and Zhang (2020) to study the misfit dislocation structure at the interfaces. The analysis helps us to characterize the dislocation line directions and Burgers vectors of the misfit dislocations.
III Results
III.1 Structure of the interfaces
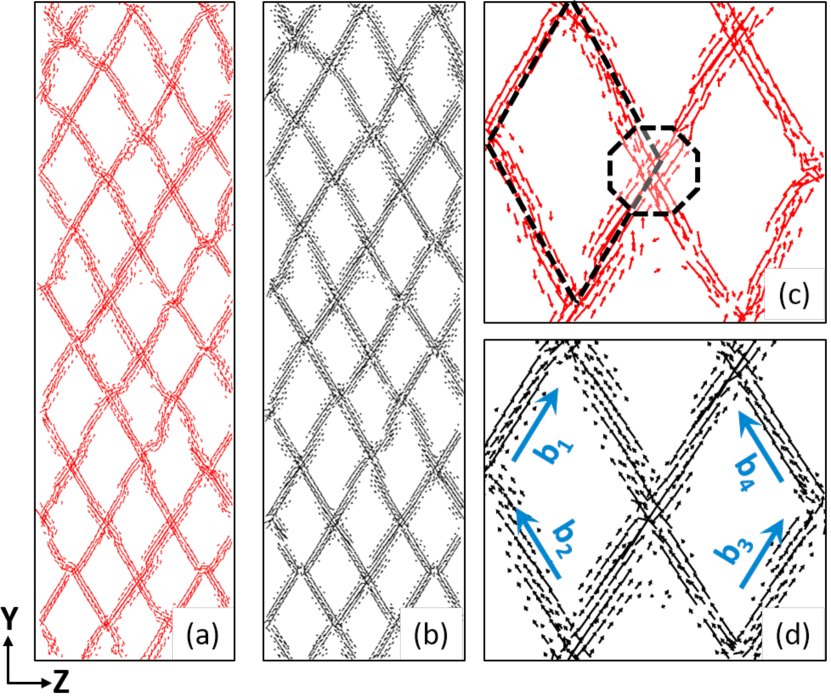
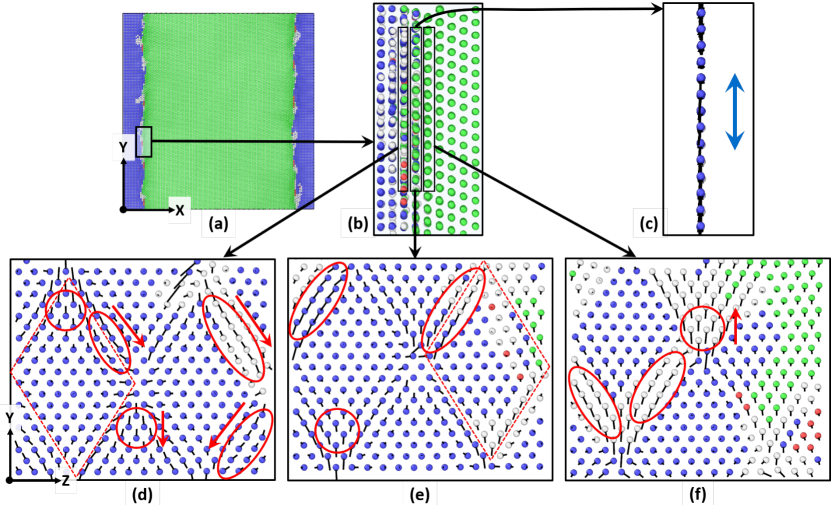
Before studying the transformation, first we analyze the atomic structure of the interface using NTA, which reveals the presence of misfit dislocations at the BCC-FCC interface. In case of the flat interface, the dislocation line directions (red line) and the Burgers vectors (black line) are separately shown in Figures 2(a) and (b), respectively. Interestingly, the dislocation network forms a diamond-shaped pattern, where the dislocations are lined along the edges of the diamond, while the area inside forms the coherent region of the interface. For a better visibility, a close-up view of the interface is shown in Figures 2(c-d). As seen in this figure, the dislocation line directions and the Burgers vectors are parallel to each other, which indicates that the misfit dislocations present at the interface are screw dislocations, with Burgers vectors along . The dislocation line directions and Burgers vectors are parallel to the interface plane ( plane), and there is no component out-of-the interface plane. Such a screw dislocation network at the FCC/BCC interface has previously been postulated by Howe et al.Howe et al. (2009) Further analysis reveals that the flat interface consists of areas with low and high potential energy, as shown in Figure S2 in the Supporting Information. Comparing Figure 2 with Figure S2, it can be seen that low potential energy areas lie within the diamond, showing a coherent FCC-BCC interface in these regions. On the other hand, areas with misfit dislocations (along the edges of the diamond and in particular, the octagon marked in Figure 2) have higher potential energy, resulting from incoherent stacking of the FCC and BCC phase.
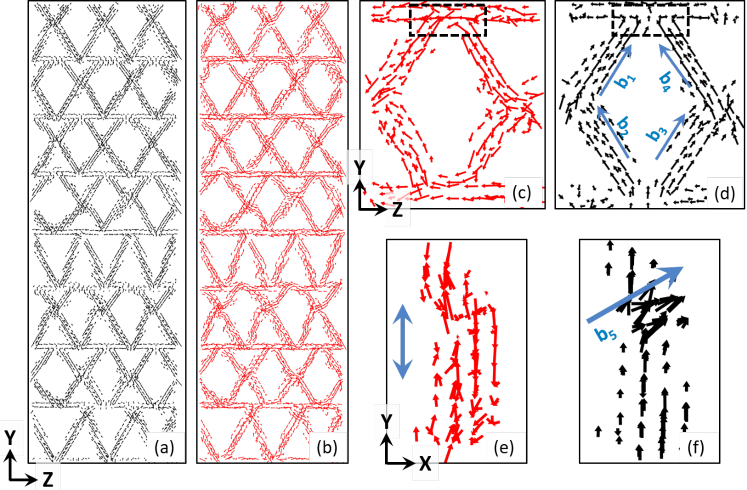
Figure 3(a-b) shows misfit dislocation network structure at the ledged interface. Similar to the case of the flat inter-phase boundary, the diamond-shaped network of screw dislocation is formed at the ledged interface also. However, due to the presence of the ledges, the pattern is not as regular, as observed in the case of the flat interface. Figure 3(c-f) presents the enlarged view of the NTA at one of the diamond regions for better visibility, clearly showing that the dislocation line directions along the edges of the diamond are parallel to the interface ( plane), having no out-of-the interface plane component.
However, an important distinction (compared to the flat boundary) arises near the ledges, where an additional set of dislocations appear, with Burgers vectors also having an out-of-the interface plane component. As shown in figure 3(d,f), unlike the dislocation lines, Burgers vector on the plane has noticeable -component. The SFs are nucleated from this region when the transformation starts (to be discussed later in subsection III.3). Atoms located near the ledges are found to have the highest potential energy, as shown in Figure S3, Supporting Information.
III.2 Transformation mechanisms: Flat interface
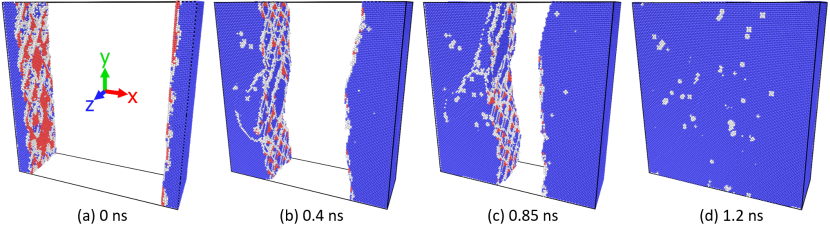
Figure 4 shows the overview of the transformation for the flat interface at 600 K. The structure at 0 ns (just after equilibration) is shown in figure 4(a), which is the starting configuration for the transformation simulations. Two intermediate states at 0.4 and 0.85 ns are shown in figures 4(b-c) and the transformation is completed at 1.2 ns [Figure 4(d)]. From the figures, it is clear that the transformation from the FCC-to-BCC phase happens only at the interface. Otherwise, the BCC phase would have nucleated somewhere inside the FCC phase, which is not observed in any of our simulations.
Since the transformation happens at the phase boundary, we further investigate the atomic displacements (leading to the FCC-to-BCC transformation) near the interface. Figure 5(a) shows the configuration just after equilibration (0 ns), and a zoomed-in view of the area marked by the rectangle is shown in subfigure (b). Atomic displacements at one of the FCC monolayers (at the interface) is captured during the transformation at 10 ps [Figure 5(c)]. As shown in the figure, all the atomic displacements are parallel to the plane (blue arrow showing the atomic movements vertically upwards or downwards), having no out-of-the interface plane component.
Having established that the atomic displacements responsible for the phase transition are confined to the interface planes, we now analyze atomic motions in these planes. The zoomed-in view of three monolayers (originally FCC planes) adjacent to the interface are illustrated in figures 5(d-f) in projection (parallel to the interface). Coordinated movements of several groups of atoms (confined to the interface planes) can be observed in all three monolayers. Moreover, the atomic displacements are found to take place mainly in the regions, where the misfit dislocation networks were located in the beginning. The same type of atomic displacements observed in the diamond region [Figure 5(d-f)] are also found on the entire monolayer at the interface, as well as few adjacent layers in the FCC region. The atomic displacements at the interface plane create an atomic drag, that propels the atoms on the neighboring atomic layers to move in a similar fashion. This interface governed transformation propagates through the entire FCC phase layer-by-layer until the transition is complete, as shown in the Supplementary Information Figure S4.
In the case of a flat interface, the transformation is aided by the screw dislocations at the interface. These screw dislocations (having high PE) move on the or slip system, as shown by red arrows and red ellipses in Figure 5(d-f), thereby reducing the PE and facilitating the phase transformation. This mechanism is the same as the Kurdjmov-Sachs (KS) FCC-to-BCC transformation mechanism Kurdjumow and Sachs (1930). The corresponding FCC-to-BCC orientation relationship during the transformation can be written as,
.
On the other hand, within the red circles, atomic movements as per the Burgers-Bogers-Olson-Cohen (BB/OC) method Bogers and Burgers (1964); Olson and Cohen (1972) are observed [Figure 5(d-f)]. As per the BB/OC method, the BCC phase nucleates as a result of the two shears, and , where is the Burgers vector of the Shockley partial for the FCC twin shear. During the transformation, regions of HCP stacking is observed, as shown in the Supplementary Information Figure S2 and S4, which is the meta-stable structure after the first atomic shear . The atoms in this meta-stable state move further according to the second shear (), completing the transformation. Figure S5 in the supplementary material shows the schematic of the BB/OC mechanism and similar transformation pathways are observed in the present simulations. The KS and BB/OC mechanisms were also reported in previous MD studies of phase transformations in single crystal and bicrystal iron Karewar et al. (2020); Ou et al. (2016); Karewar et al. (2018, 2019).
III.3 Transformation mechanisms: Ledged interface
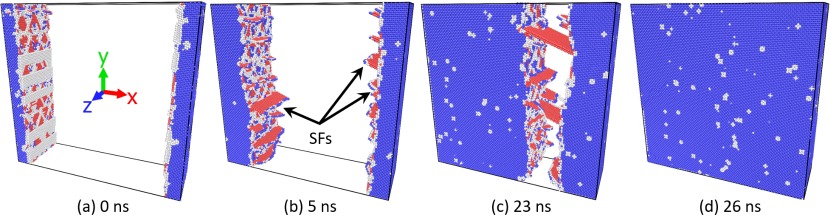
Figure 6(a-d) shows the evolution of the martensitic transformation in the presence of the ledged interface at 600 K. The equilibrated structure of the simulation box at 0 ns is shown in figure 6(a). Two intermediate states are shown at 5 ns and 23 ns [Figures 6(b-c)] and the transformation is completed at 26 ns [Figure 6(d)]. In addition to the transformation mechanisms found at the flat interface, an additional feature is observed in case of ledged inter-phase boundary. During the process of transformation, stacking faults (SFs) are nucleated from the atomic ledges [Figure 6(b-c)]. The nucleation of SFs at the atomic ledges has been observed previously in pure Fe.Song and Hoyt (2012, 2013); Tripathi et al. (2018) These SFs play an important role in FCC-to-BCC phase transformation, which is going to be described in detail in the following discussion.
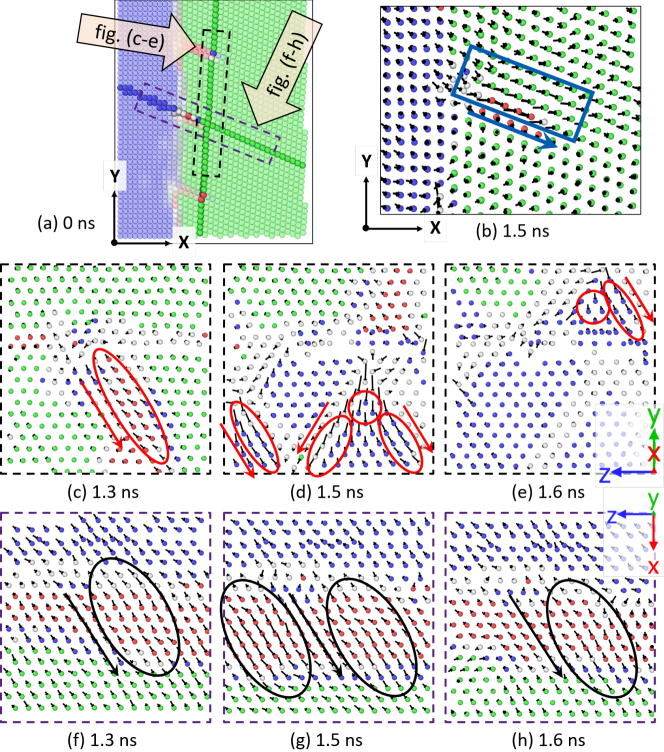
The atomic displacements inducing the FCC-to-BCC transformation are shown in Figure 7. The close-up view of the interface at 0 ns (just before starting the transformation), which includes few layers from both FCC and BCC phase, is shown in Figure 7(a). One can clearly see the atoms with HCP stacking near the ledges, where SFs are nucleated. Figure 7(b) shows the close-up view of the atomic displacements near the interface on a monolayer, in the same projection plane as in sub-figure (a). The interface in this figure is perpendicular to the direction; and thus, it can be concluded that, in the presence of the ledged inter-phase boundary, out-of-the interface plane atomic displacements (marked by the blue rectangle) also takes place, in addition to the in-plane atomic displacements (similar to the case of the flat interface planes), leading to the phase transformation.
To analyze the in-plane and out-of-the interface plane atomic displacements in ledged interfaces, we investigate the two highlighted monolayers (within the dashed rectangles), as shown in Figure 7(a). For these monolayers, the atomic displacements (in a plane perpendicular to the arrows) are shown in sub-figures (c-e) and (f-h). Sub-figures 7(c-e) show the atomic displacements on plane. The atomic displacements in this monolayer lie within the interface plane and there is no out-of-plane component. Similar to the flat interface [Figure 5(d-f)], the atomic displacements on this monolayer [Figure7(c-e)] follow two mechanisms- (i) KS mechanism shown in the red ellipses and (ii) BB/OC mechanism shown within the red circles.
Sub-figures 7(f-h) show the monolayers parallel to the stacking fault nucleated from the ledges. The atomic displacements on this layer follow the HCP-to-BCC Burgers path on the slip system shown within the black ellipses. Figure S6 [Supporting Information] further shows the similarity between the atomic displacements as per the Burgers path and the displacements observed in the present simulations. These type of out-of-the interface plane displacements are mainly observed on the atomic layers at and near the SFs. Therefore, the SFs, nucleated from the ledges affect the martensitic transformation by generating an additional out-of-the interface plane atomic displacement component.
IV Discussion
| Tempera- ture (K) | (kJ/mole) | Flat interface velocity (m/s) | Ledged interface velocity (m/s) |
| 600 | 2.20 | 13.460.95 | 0.210.05 |
| 800 | 2.06 | 10.330.48 | 0.780.04 |
| 1000 | 1.91 | 7.660.31 | 1.370.06 |
| 1200 | 1.76 | 5.691.23 | 2.060.32 |
As seen in the previous section, in the case of the flat interface, FCC-to-BCC transformation takes place by only in-plane (of the interface) atomic shear component. On the other hand, an additional set of out-of-the interface plane displacements are observed in the presence of the ledged interface. The two types of displacements in presence of the ledged interface (in-plane and out-of interface plane) compete with each other during the transformation. The out-of-plane atomic displacements caused by the SFs create a barrier to the in-plane atomic movements (due to the screw dislocations) and thereby slow down the transformation rate in systems having ledged interfaces, compared to the ones with flat interfaces.
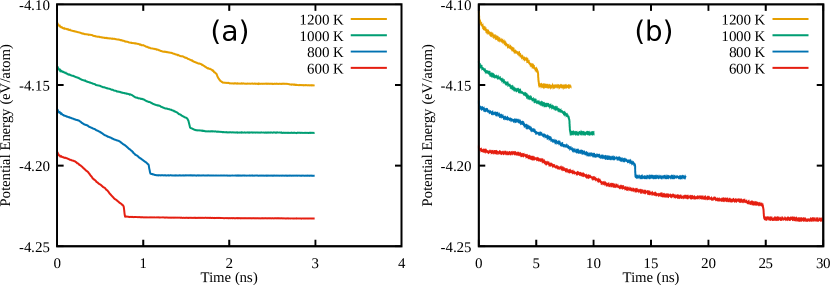
In figure 8, it is also observed that for the systems with flat interfaces, the transformation rate increase with a decrease in temperature. On the contrary, for systems with the ledged interface, the transformation slows down with decreasing temperature. Such contrasting behavior in the presence of the two different types of interfaces needs thorough analysis and is beyond the scope of the present work. Our preliminary analysis suggests that for the flat interfaces, the transformation is mainly driven by the reduction of the Gibbs free energy . Using a similar approach used previously by Tripathi et al. Tripathi et al. (2018), thermodynamic integration at different temperatures are carried out to get the values of at different temperatures, as shown in table 2. It can be seen that the value of increases with decreasing temperature. The increase in the driving force at lower temperatures suggests faster kinetics in the case of systems with flat interfaces.
The transformation in the systems with the ledged interface is mainly controlled by the defect mobility i.e. SF movement in the simulation system. While the calculation of the SF mobility at different temperatures is beyond the scope of this paper, our results suggest that the mobility of the SFs affects the velocity of the interface. Lower velocity of the SFs results a lower velocity of the interface and thereby a slower transformation kinetics and vice versa. The interface velocities are reported in the table 2, calculated using the approach previously mentioned in the literature Song and Hoyt (2012); Tripathi et al. (2018). The velocity of the ledged interface increases with an increase in temperature from 600 K to 1200 K, which is possibly due to the higher SF mobility at a higher temperature.
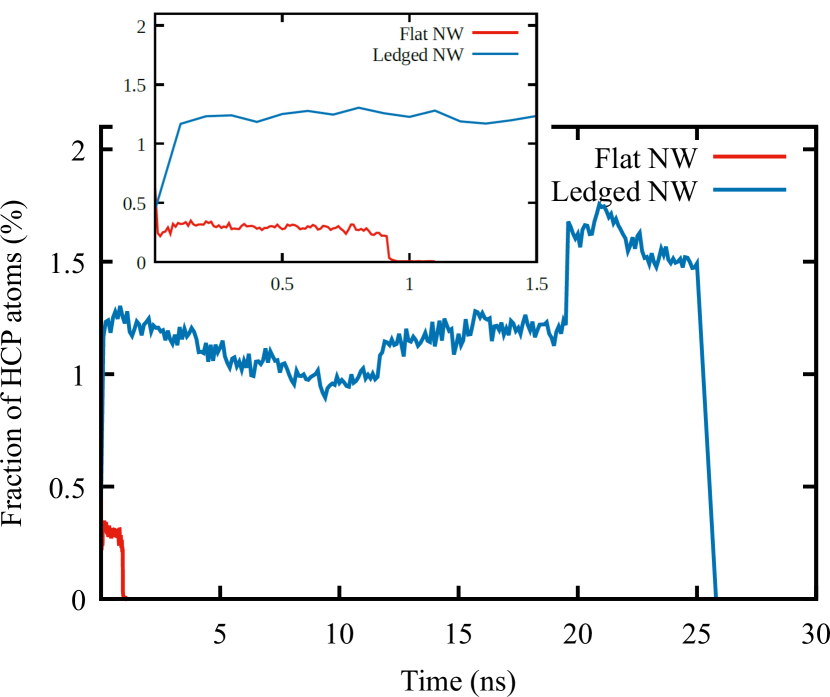
Since the presence of SFs significantly impacts the transformation rate, further analysis is carried out in terms of the fraction of SFs (or fraction of atoms with HCP stacking) present in the simulation systems. The fraction of atoms with HCP stacking in systems with different morphologies are compared in Figure 9 at 600 K. As seen here the fraction of atoms with HCP stacking is much higher in the presence of a ledged interface than that of a flat interface. A similar trend is observed at higher temperatures as well. This is because of the nucleation and propagation of the SFs from the atomic ledges. Moreover, the fraction of atoms having HCP stacking remains almost unchanged during transformation in systems with the flat interface; on the other hand, it increases during transformation (at 20 ns) in the presence of a ledged interface in the system. This increase in the fraction of SFs happens when the two interfaces, from left and right, come closer and the SFs propagating from them merge [Figure 6(c)]. As expected, no atoms with HCP stacking are found once the FCC-to-BCC transformation is completed.
V Conclusions
In summary, using classical molecular dynamics simulations and an embedded atom method type interatomic potential, we illustrate the effect of the morphology of the FCC/BCC interface on the martensitic transformation in iron. We compare two types of morphologies: a flat one, where the phases are joined according to NW OR and a ledged one, where the FCC phase is rotated by with respect to the ideal NW OR. In case of the flat morphology, we find misfit screw dislocations, having their Burger vector component lying within the interface plane. We identify the atomic displacements, parallel to the interface plane and taking place along the misfit dislocation network, leading to the phase transition, following the KS and BB/OC FCC-to-BCC transformation mechanism. In addition to the in-plane (parallel to the interface) movements, we also find out-of-the interface plane motion, contributing to the phase transition in case of ledged interface. We find some SFs to be nucleated at the ledges, causing the atomic shear as per the HCP-to-BCC Burgers path, leading to transformation from the parent FCC to product BCC phase, via the intermediate HCP phase (appearing as SFs). We find the mobility of the inter-phase boundary to be lower in case of the ledged interface, as SFs hinder the interface motion. Interestingly, the transformation kinetics shows opposite trend as a function of temperature in case of the flat and ledged interface. In presence of the flat interfaces, the kinetics is controlled by the driving force for the transformation (i.e. ). In presence of the ledged interface, the mobility of the defects (SFs) controls the velocity of the interfaces and which subsequently controls the transformation kinetics. We believe that our study will provide a better understanding of austenite to ferrite phase transformation in iron and help to bridge the existing gaps in the literature.
VI Acknowledgements
S. B. acknowledges funding from SERB (CRG/2019/006961). Authors acknowledge HPC IITK and NCHC NCTU Taiwan for providing computational facilities.
Author contribution: P. K. T. and S. K. contributed equally to this work.
References
- Moritani et al. (2002) T. Moritani, N. Miyajima, T. Furuhara, and T. Maki, “Comparison of interphase boundary structure between bainite and martensite in steel,” Scripta Materialia 47, 193 – 199 (2002)
- Caballero and Bhadeshia (2004) F.G. Caballero and H.K.D.H. Bhadeshia, “Very strong bainite,” Current Opinion in Solid State and Materials Science 8, 251 – 257 (2004)
- Raabe et al. (2013) D. Raabe, S. Sandlöbes, J. Millán, D. Ponge, H. Assadi, M. Herbig, and P.-P. Choi, “Segregation engineering enables nanoscale martensite to austenite phase transformation at grain boundaries: A pathway to ductile martensite,” Acta Materialia 61, 6132 – 6152 (2013)
- Wang et al. (2014a) M-M. Wang, C.C. Tasan, D. Ponge, A. Kostka, and D. Raabe, “Smaller is less stable: Size effects on twinning vs. transformation of reverted austenite in trip-maraging steels,” Acta Materialia 79, 268 – 281 (2014a)
- Toji et al. (2015) Yuki Toji, Goro Miyamoto, and Dierk Raabe, “Carbon partitioning during quenching and partitioning heat treatment accompanied by carbide precipitation,” Acta Materialia 86, 137 – 147 (2015)
- Bunshah and Mehl (1953) RF Bunshah and RF Mehl, “Rate of propagation of martensite,” Trans. Aime 197, 1251–1258 (1953)
- Kurdjumow and Sachs (1930) G. Kurdjumow and G. Sachs, “Uber den Mechanismus der stahlhärtung,” Zeitschrift für Physik 64, 325–343 (1930)
- Nishiyama (1934) Z. Nishiyama, “Mechanism of transformation from face-centred to body-centred cubic lattice,” Sci Rep Tohoku Imp Univ. 23, 637–664 (1934)
- Bain and Dunkirk (1924) Edgar C Bain and NY Dunkirk, “The nature of martensite,” trans. AIME 70, 25–47 (1924)
- Pitsch (1962) W. Pitsch, “Der orientierungszusammenhang zwischen zementit und austenit,” Acta Metallurgica 10, 897 – 900 (1962)
- Greninger and Troiano (1949) Alden B Greninger and Alexander R Troiano, “The mechanism of martensite formation,” JOM 1, 590–598 (1949)
- Shiflet and Merwe (1994) G. J. Shiflet and J. H. Merwe, “The role of structural ledges as misfit- compensating defects: fcc-bcc interphase boundaries,” Metallurgical and Materials Transactions A 25, 1895–1903 (1994)
- Shiflet and van der Merwe (1994) G.J. Shiflet and J.H. van der Merwe, “The role of structural ledges at phase boundaries—ii. f.c.c.-b.c.c. interfaces in nishiyama-wasserman orientation,” Acta Metallurgica et Materialia 42, 1189 – 1198 (1994)
- Lee et al. (2013) Tae-Ho Lee, Heon-Young Ha, Jun-Yun Kang, Joonoh Moon, Chang-Hoon Lee, and Seong-Jun Park, “An intersecting-shear model for strain-induced martensitic transformation,” Acta Materialia 61, 7399 – 7410 (2013)
- Bos et al. (2006) C. Bos, J. Sietsma, and B. J. Thijsse, “Molecular dynamics simulation of interface dynamics during the fcc-bcc transformation of a martensitic nature,” Phys. Rev. B 73, 104117 (2006)
- Tateyama et al. (2008) Shinji Tateyama, Yasushi Shibuta, and Toshio Suzuki, “A molecular dynamics study of the fcc–bcc phase transformation kinetics of iron,” Scripta Materialia 59, 971 – 974 (2008)
- Sandoval et al. (2009) Luis Sandoval, Herbert M. Urbassek, and Peter Entel, “Solid-solid phase transitions and phonon softening in an embedded-atom method model for iron,” Phys. Rev. B 80, 214108 (2009)
- Sandoval and Urbassek (2009a) Luis Sandoval and Herbert M. Urbassek, “Transformation pathways in the solid-solid phase transitions of iron nanowires,” Applied Physics Letters 95, 191909 (2009a), https://doi.org/10.1063/1.3258002
- Song and Hoyt (2012) H. Song and J.J. Hoyt, “A molecular dynamics simulation study of the velocities, mobility and activation energy of an austenite–ferrite interface in pure fe,” Acta Materialia 60, 4328 – 4335 (2012)
- Song and Hoyt (2013) H. Song and J.J. Hoyt, “An atomistic simulation study of the migration of an austenite–ferrite interface in pure fe,” Acta Materialia 61, 1189 – 1196 (2013)
- Song and Hoyt (2018) H. Song and J. J. Hoyt, “A molecular dynamics study of the nucleus interface structure and orientation relationships during the austenite-to-ferrite transformation in pure fe,” Canadian Metallurgical Quarterly 57, 12–19 (2018)
- Song and Hoyt (2015) H Song and J J Hoyt, “An atomistic simulation study of the crystallographic orientation relationships during the austenite to ferrite transformation in pure fe,” Modelling and Simulation in Materials Science and Engineering 23, 085012 (2015)
- Tripathi et al. (2018) Pawan Kumar Tripathi, Sumit Kumar Maurya, and Somnath Bhowmick, “Role of disconnections in mobility of the austenite-ferrite interphase boundary in fe,” Phys. Rev. Materials 2, 113403 (2018)
- Wang and Urbassek (2013a) B. Wang and H. M. Urbassek, “Phase transitions in an fe system containing a bcc/fcc phase boundary: An atomistic study,” Phys. Rev. B 87, 104108 (2013a)
- Sinclair and Hoagland (2008) C.W. Sinclair and R.G. Hoagland, “A molecular dynamics study of the fcc→bcc transformation at fault intersections,” Acta Materialia 56, 4160 – 4171 (2008)
- Wang et al. (2014b) Binjun Wang, Emilia Sak-Saracino, Nina Gunkelmann, and Herbert M. Urbassek, “Molecular-dynamics study of the α↔γ phase transition in fe–c,” Computational Materials Science 82, 399 – 404 (2014b)
- Wang et al. (2014c) Binjun Wang, Emilia Sak-Saracino, Luis Sandoval, and Herbert M Urbassek, “Martensitic and austenitic phase transformations in fe–c nanowires,” Modelling and Simulation in Materials Science and Engineering 22, 045003 (2014c)
- Wang and Urbassek (2013b) Binjun Wang and Herbert M Urbassek, “Computer simulation of strain-induced phase transformations in thin fe films,” Modelling and Simulation in Materials Science and Engineering 21, 085007 (2013b)
- Karewar et al. (2018) S. Karewar, J. Sietsma, and M.J. Santofimia, “Effect of pre-existing defects in the parent fcc phase on atomistic mechanisms during the martensitic transformation in pure fe: A molecular dynamics study,” Acta Materialia 142, 71 – 81 (2018)
- Karewar et al. (2019) Shivraj Karewar, Jilt Sietsma, and Maria J. Santofimia, “Effect of c on the martensitic transformation in fe-c alloys in the presence of pre-existing defects: A molecular dynamics study,” Crystals 9 (2019), 10.3390/cryst9020099
- Karewar et al. (2020) S. Karewar, A. Elzas, J. Sietsma, and M. J. Santofimia, “An atomistic perspective of martensite twinning in iron,” (2020), arXiv:2001.11053 [cond-mat.mtrl-sci]
- Sandoval and Urbassek (2009b) Luis Sandoval and Herbert M. Urbassek, “Finite-size effects in fe-nanowire solid−solid phase transitions: A molecular dynamics approach,” Nano Letters 9, 2290–2294 (2009b), pMID: 19438190, https://doi.org/10.1021/nl9004767
- Sandoval and Urbassek (2009c) Luis Sandoval and Herbert M Urbassek, “Solid–solid phase transitions in fe nanowires induced by axial strain,” Nanotechnology 20, 325704 (2009c)
- Ou et al. (2016) X Ou, J Sietsma, and M J Santofimia, “Molecular dynamics simulations of the mechanisms controlling the propagation of bcc/fcc semi-coherent interfaces in iron,” Modelling and Simulation in Materials Science and Engineering 24, 055019 (2016)
- Burgers (1934) W.G. Burgers, “On the process of transition of the cubic-body-centered modification into the hexagonal-close-packed modification of zirconium,” Physica 1, 561 – 586 (1934)
- Bogers and Burgers (1964) A.J Bogers and W.G Burgers, “Partial dislocations on the 110 planes in the b.c.c. lattice and the transition of the f.c.c. into the b.c.c. lattice,” Acta Metallurgica 12, 255 – 261 (1964)
- Olson and Cohen (1972) G.B. Olson and Morris Cohen, “A mechanism for the strain-induced nucleation of martensitic transformations,” Journal of the Less Common Metals 28, 107 – 118 (1972)
- Maresca and Curtin (2017) F. Maresca and W.A. Curtin, “The austenite/lath martensite interface in steels: Structure, athermal motion, and in-situ transformation strain revealed by simulation and theory,” Acta Materialia 134, 302 – 323 (2017)
- Bhadeshia and Wayman (2014) H.K.D.H. Bhadeshia and C.M. Wayman, “9 - phase transformations: Nondiffusive,” in Physical Metallurgy (Fifth Edition), edited by David E. Laughlin and Kazuhiro Hono (Elsevier, Oxford, 2014) fifth edition ed., pp. 1021 – 1072
- lam (1995) “Fast parallel algorithms for short-range molecular dynamics,” J. Comput. Phys. 117, 1 (1995), http://lammps.sandia.gov
- Ackland et al. (1997) G. J. Ackland, D. J. Bacon, A. F. Calder, and T. Harry, “Computer simulation of point defect properties in dilute fe-cu alloy using a many-body interatomic potential,” Philosophical Magazine A 75, 713–732 (1997)
- Sun et al. (2004) D. Y. Sun, M. Asta, J. J. Hoyt, M. I. Mendelev, and D. J. Srolovitz, “Crystal-melt interfacial free energies in metals: fcc versus bcc,” Phys. Rev. B 69, 020102 (2004)
- Abe et al. (2016) Y. Abe, T. Tsuru, S. Shi, N. Oono, and S. Ukai, “Effect of the dilation caused by helium bubbles on edge dislocation motion in -iron: molecular dynamics simulation,” Journal of Nuclear Science and Technology 53, 1528–1534 (2016)
- Terentyev et al. (2016) D. Terentyev, A. Bakaev, D. Van Neck, and E. E. Zhurkin, “Glide of dislocations in slip system: an atomistic study,” Philosophical Magazine 96, 71–83 (2016)
- Stukowski (2012) Alexander Stukowski, “Structure identification methods for atomistic simulations of crystalline materials,” Modelling and Simulation in Materials Science and Engineering 20, 045021 (2012)
- Hartley and Mishin (2005) C.S. Hartley and Y. Mishin, “Characterization and visualization of the lattice misfit associated with dislocation cores,” Acta Materialia 53, 1313 – 1321 (2005)
- Nye (1953) J.F Nye, “Some geometrical relations in dislocated crystals,” Acta Metallurgica 1, 153 – 162 (1953)
- Yao and Zhang (2020) B.N. Yao and R.F. Zhang, “AADIS: An atomistic analyzer for dislocation character and distribution,” Computer Physics Communications 247, 106857 (2020)
- Howe et al. (2009) J.M. Howe, R.C. Pond, and J.P. Hirth, “The role of disconnections in phase transformations,” Progress in Materials Science 54, 792 – 838 (2009)