X-ray pulsar XTE J1858+034: discovery of the cyclotron line and the revised optical identification
Abstract
We present results of a detailed investigation of the poorly studied X-ray pulsar XTE J1858+034 based on the data obtained with the NuSTAR observatory during the outburst of the source in 2019. The spectral analysis resulted in the discovery of a cyclotron absorption feature in the source spectrum at 48 keV both in the pulse phase averaged and resolved spectra. Accurate X-ray localization of the source using the NuSTAR and Chandra observatories allowed us to accurately determine the position of the X-ray source and identify the optical companion of the pulsar. The analysis of the counterpart properties suggested that the system is likely a symbiotic binary hosting an X-ray pulsar and a late type companion star of K-M classes rather than Be X-ray binary as previously suggested.
1 Introduction
The transient X-ray pulsar (XRP) XTE J1858+034 was discovered with the All Sky Monitor onboard the RXTE observatory in 1998 (Remillard et al., 1998). Pulsations with a period of s detected during the same outburst in the RXTE/PCA data (Takeshima et al., 1998) and the transient nature of XTE J1858+034 led these authors to conclude that the system is likely an XRP with Be counterpart. A long-term light curve based on the RXTE/ASM data clearly shows regular outbursts with a period of 380 d, which was interpreted as the orbital period of the binary system (Doroshenko et al., 2008).
The energy spectrum of XTE J1858+034 is typical for XRPs and can be described as an absorbed cut-off power law with an equivalent hydrogen column density of cm-2, modified by an iron emission line around 6.6 keV (Paul & Rao, 1998). A similar spectral shape and spectral parameters were obtained from INTEGRAL data (Filippova et al., 2005; Doroshenko et al., 2008) collected during an outburst in 2004 (Molkov et al., 2004). Evidence of a cyclotron absorption line has never been reported for XTE J1858+034 in the literature, therefore, the magnetic field strength of the neutron star (NS) remains uncertain. On the other hand, Paul & Rao (1998) discovered quasi-periodic oscillations at 0.11 Hz, which is significantly higher than the spin frequency. Interpreting this feature in the frame of the beat frequency model, they estimated the NS magnetic field to be G, where is the distance to the system in kpc.
The X-ray localisation of XTE J1858+034 was originally obtained from the RXTE data (Marshall et al., 1998) and later improved by Molkov et al. (2004) using the observations with INTEGRAL/JEM-X and INTEGRAL/IBIS/ISGRI. Based on these results Reig et al. (2005) proposed a star with the coordinates RA=, Dec=, as a possible counterpart for the source. Optical spectroscopy indicated that it was the only nearby star exhibiting H emission, however, its position was not consistent with the JEM-X uncertainty. Therefore, this association can only be considered tentative.
The relative faintness of XTE J1858+034 even during its outbursts and shortage of available data did not allow to make any definitive conclusions regarding the physical properties of the NS in the system up to date. Here we report the results of a NuSTAR observation of XTE J1858+034 performed during its outburst in the Fall 2019 (detected by the MAXI instrument, Nakajima et al., 2019), which allowed to conduct detailed spectral and timing analysis and localize the source. The localization of the source was then further refined using an archival Chandra observation, and subsequent near-IR identification of the companion star using the Nordic Optical Telescope (NOT) telescope.
2 Observations and data reduction
This work is based on several data sets in X-ray (Chandra, XMM-Newton and NuSTAR observatories) and near-IR (the UKIDSS survey and NOT telescope) bands. The complete list of the data used is presented in Table 1.
| ObsID | Start date | Start MJD | Exposure (ks) |
| XMM-Newton | |||
| 0302970201 | 2006-04-11 | 53836.91 | 25 |
| Chandra | |||
| 14645 | 2013-02-17 | 56340.17 | 5 |
| NuSTAR | |||
| 90501348002 | 2019-11-03 | 58790.29 | 43 |
| Nordic Optical telescope | |||
| STzd200003-7 | 2016-04-21 | 57499.11 | 0.12a |
| NCzd200587-640 | 2016-04-21 | 57499.11 | 0.54b |
| NCzi150446-449 | 2016-09-15 | 57646.99 | 2.4 |
-
•
a Per filter .
-
•
b Per filter .
2.1 NuSTAR observatory
The NuSTAR observatory includes two identical co-aligned X-ray telescopes focusing X-ray photons onto two Focal Plane Modules A and B (FPMA and FPMB) (Harrison et al., 2013). In the context of the current work the most important NuSTAR capabilities are the moderately high imaging resolution of 18′′ (full width at half maximum) and unprecedented sensitivity in hard X-rays from 3 to 79 keV. XTE J1858+034 was observed with NuSTAR on November 3, 2019 with an exposure of 43 ks (see Table 1) near the peak of the outburst.
The raw data were reduced following the standard procedures described in the NuSTAR user guide and using the standard NuSTAR Data Analysis Software (nustardas) v1.8.0 with CALDB version 20190513. The source spectrum was extracted from a source-centered circular region with radius of 80′′ using the nuproducts routine. The background was extracted from a source-free circular region with radius of 80′′ in the corner of the field of view. In order to apply standard minimization procedures, the original source spectrum was rebinned in order to have at least 25 counts per energy bin. The following spectral analysis was performed using xspec package (Arnaud, 1996).
2.2 XMM-Newton observatory
In order to investigate different states of XTE J1858+034, the XMM-Newton data obtained during the quiescent state of the source were also analysed. The source was observed in April 2006 for 25 ks. EPIC pn and EPIC MOS detectors were operated in the full frame mode with medium filters. The data reduction procedures using the XMM-Newton Science Analysis Software (SAS; version 18.0) were applied following standard procedures.111https://www.cosmos.esa.int/web/xmm-newton/sas-threads After the standard pipeline processing, we searched for possible intervals of high background and rejected them. This resulted in lowering of the effective exposure down to 16 ks and 6 ks for MOS and pn, respectively. For the analysis of the EPIC data, we selected events with patterns in the range 0–4 for the pn camera and 0–12 for the two MOS cameras, using a circular region with a radius of 20′′ around the source positions. The circular background region with a radius of 30′′ was placed close to the source at the same CCD and avoiding other point sources.
2.3 Chandra observatory
XTE J1858+034 was observed by Chandra advanced CCD Imaging Spectrometer (ACIS; Garmire et al., 2003) on February 17, 2013 with an exposure of ks as part of the project aimed at studies of the transient XRPs in a quiescent state (Tsygankov et al., 2017b). For the data reduction we used the software package ciao v4.12 with an up-to-date caldb v4.9.1. The procedure celldetect was used to determine coordinates of sources in the Chandra field of view. The source spectrum was extracted from a circular aperture with a radius of 3′′ around the position, while for the background extraction we used a circular region near the source with a radius of 15′′.
2.4 Nordic Optical Telescope
Optical and near-IR observations were obtained at the Nordic Optical Telescope (NOT) through applications in the fast-track service (Djupvik & Andersen, 2010), using the Standby CCD camera StanCam and the Nordic Optical Telescope near-IR Camera and spectrograph (NOTCam222For details about NOTCam, we refer to http://www.not.iac.es/instruments/notcam/.). StanCam images in bands, as well as NOTCam high spatial resolution images (/pix) in the bands were obtained on April 20, 2016 in good seeing conditions (FWHM = –). The near-IR images were obtained by small step dithering in a 33 pattern with 30 s exposures in each position obtained in ramp-sampling mode, reading out every 5 s, giving a total of 540 s per filter in the combined , and images. The StanCam exposures of 120 s showed no detection in any band, while the near-IR images detected a red counterpart at the location of the X-ray source. A -band spectrum was obtained on Sept 15, 2016 under less favourable conditions. The setup used was the WF camera (/pix), Grism #1 with a dispersion of 4.1 Å per pixel, the 128 micron slit ( wide), and the -band filter (#208) used as an order sorter, which gives a resolution of 10.5 Å and a resolving power of / = 2100. The spectra were obtained in the ABBA dithering mode, exposing 600 s per position and using the ramp-sampling mode to read out non-destructively 10 times every 60 s. In-situ arc and halogen lamps were observed to take out the effect of fringing as much as possible and to account for flexure in the wavelength calibration. A telluric standard close to the target was observed immediately before the target.
The near-IR images were reduced using the NOTCam IRAF package to do bad-pixel correction, flat-fielding with differential twilight flats, sky-subtraction, and shifting and median combining of the individual images. The individual 2D -band spectra were hot-pixel and zero-pixel corrected, flat-fielded and sky subtracted before 1D extraction using standard IRAF tasks. The individual 1D spectra were wavelength calibrated and thereafter combined to a final spectrum. This was divided by the telluric standard spectrum to correct for atmospheric features and afterwards multiplied by a black body continuum of the same spectral type as the telluric standard to correct the slope in the spectrum. Due to mediocre sky conditions the final spectrum had a poor S/N ratio and was therefore smoothed over 17 pixels, lowering the resolving power to R = 120.
3 Results
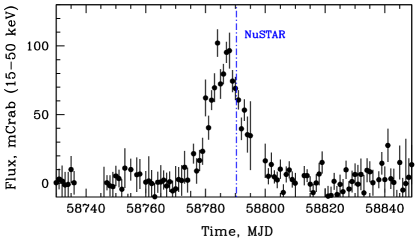
XTE J1858+034 was observed by the NuSTAR observatory close to the peak of the 2019 outburst. The light curve of the source in the 15–50 keV energy band obtained333http://swift.gsfc.nasa.gov/results/transients/ by the Burst Alert Telescope on board the Neil Gehrels Swift Observatory (Swift/BAT; Krimm et al., 2013) is shown in Fig. 1. The relatively high brightness of the source allowed us to study its properties in a broad energy band in details. At the same time soft band Chandra and XMM-Newton data were collected in the low state with low counting statistics which was insufficient to detect pulsations. All uncertainties in the paper are reported at 1 confidence level, unless otherwise stated.
3.1 Pulse profile and pulsed fraction
Orbital parameters except for the orbital period are not known for XTE J1858+034. Considering that the available X-ray data only covers a small fraction of the orbit, it was also impossible to determine those based on the X-ray timing. Therefore, for the timing analysis only the barycentric but no binary correction was applied to the light curves. Using standard epoch folding technique (efsearch task of ftools; Leahy, 1987) strong pulsations in the full band were found with the period s. The uncertainty for the pulse period value was determined from the simulated light curves following the procedure described by Boldin et al. (2013).
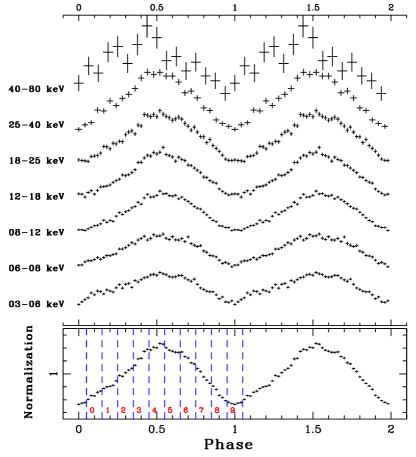
High count statistics allowed us to reconstruct the pulse profile of the source in several energy bands (selected to provide sufficient number of photons in each) from 3 to 79 keV (see Fig. 2). Even at the highest energies (in the 40–80 keV band) where counting statistics is limited, pulsations at an expected period are significantly detected in a blind search (Lomb-Scargle false alarm probability for over 2.5 millions of trial periods). The overall shape of the pulse profile is sine-like single-peaked, consistent with the results from the INTEGRAL observatory obtained by Doroshenko et al. (2008). We note, however, that although the pulse profile shape remains constant at different energies, some tentative sign of a phase lag is observed with the soft profile lagging the hard one.
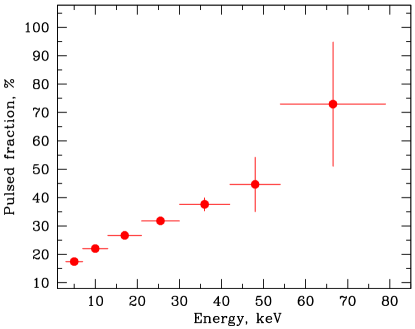
Based on the energy-resolved pulse profiles with 12 phase bins, we also calculated the pulsed fraction444, where and are maximum and minimum fluxes in the pulse profile, respectively. as function of energy presented in Fig. 3. The linear increase of the pulsed fraction towards the higher energies can be clearly seen, which is consistent with typical behavior of the most of XRPs (Lutovinov & Tsygankov, 2009).
3.2 Phase-averaged spectral analysis
Previously the spectral properties of XTE J1858+034 in X-ray band were studied using RXTE and INTEGRAL data (Paul & Rao, 1998; Filippova et al., 2005; Doroshenko et al., 2008). In both cases it was concluded that the source spectrum can be fit with an absorbed power law with a high energy exponential cut-off, i.e. the typical spectrum for XRPs. No evidence for other features such as cyclotron lines was reported. The NuSTAR observatory, owing to a sufficiently high energy resolution and much better sensitivity at high energies, allowed us to conduct a much more detailed search for the possible cyclotron lines in the source spectrum.
| Parameter | Units | Value |
|---|---|---|
| keV | ||
| keV | ||
| ph cm-2 s-1 | ||
| keV | 1.0a | |
| keV | ||
| – | ||
| keV | ||
| keV | ||
| Strengthcyc | – | |
| – | ||
| Fluxe | erg s-1 cm-2 | |
| (d.o.f.) | – | 1909.3 (1682) |
-
•
a Input soft photons temperature. 3 upper limit.
-
•
b Plasma temperature.
-
•
c Plasma optical depth.
-
•
d Cross-normalisation factor between two NuSTAR modules.
-
•
e Unabsorbed flux in the 3–100 keV energy band.
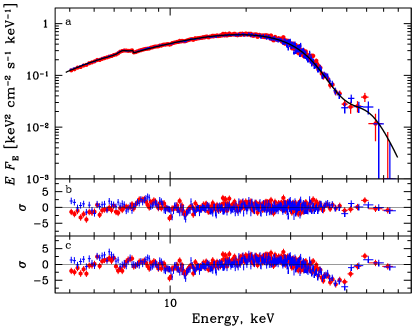
Similarly to RXTE and INTEGRAL, the NuSTAR spectrum below 40 keV can be well described with several continuum models. In particular, we attempted to fit the data with several commonly used for XRPs phenomenological continuum models, i.e. Comptonization model (comptt in xspec) and power law with high-energy exponential cutoff (cutoffpl or pohighecut in xspec). A more detailed study of different phenomenological and physical models applied to the source spectrum is presented in the accompanying paper by Malacaria et al. (in press).
To get an adequate fit, a photoelectric absorption at low energies (phabs in xspec assuming standard solar abundance from Anders & Grevesse 1989) and a fluorescent iron emission line (gau in xspec) were introduced to the model. However, irrespective of the continuum model we used, also residuals around keV in absorption are immediately apparent in the phase-averaged spectrum of XTE J1858+034. Figure 4 demonstrates the case of the comptt continuum model (see panel c), but similar residuals also appear with other models. The fit can be greatly improved by inclusion of a gaussian absorption line in the model (Fig. 4b). The best-fit spectral parameters are presented in Table 2. Inclusion of an absorption line with energy 47.7(2) keV improves the fit from to . The high statistical significance of the feature is obvious from the huge value. Its proper estimate using the xspec script simftest is technically infeasible due to an unrealistically large number of required simulations (the largest change obtained in simulations was only 48, which allows us to conclude that the significance estimated using this method must be high and in any case more than ). Applying the F-test we calculated a false detection probability for the line .
The detection of a cyclotron line at keV implies a magnetic field in XTE J1858+034 of G assuming a gravitational redshift for the typical NS parameters ( km and ). Applying of the cyclabs model instead of gabs to describe the line results in a lower cyclotron energy of keV. The discrepancy between these two models is related to their definition and was found in other studies (e.g. Nakajima et al., 2010; Mushtukov et al., 2015b; Doroshenko et al., 2017), see also the discussion of different line models in the review of Staubert et al. (2019). We emphasize only that it should be kept in mind when comparing results from different studies.
In the quiescent state XTE J1858+034 was observed twice: in April 2006 with XMM-Newton and in February 2013 with Chandra. In both cases the source was found in the very low state with the flux about three orders of magnitude lower than in our NuSTAR observation. Both spectra were fitted with an absorbed power law (phabspow in xspec) and black body (phabsbb in xspec) in order to determine the origin of the source emission in quiescence. A systematic study of the quiescent emission in transient XRPs with Be optical companions was conducted by Tsygankov et al. (2017b), however XTE J1858+034 was excluded from their sample due to the uncertain nature of its optical counterpart.
Taking into account the small number of the collected photons, spectra in the low state were binned to have at least one count in each energy channel and fitted using the W-statistics (Wachter et al., 1979). For the same reason it was impossible to constrain the absorption column simultaneously with other parameters. Therefore we fixed it at the best-fit value obtained from the NuSTAR data ( cm-2). The best-fit spectral parameters in the soft X-ray band are presented in Table 3. It is clear that both models can fit the data equally well.
We also fitted XMM-Newton/MOS and pn data jointly using the same simple models but with as a free parameter in order to check if the absorption value depends on the luminosity state of the source. As a result for the black-body model we obtained cm-2 and temperature keV, for the power law cm-2 and photon index . With a similar quality of the fit we cannot make any final conclusion on the possibility of lower absorption in the quiescent state.
Both Chandra and XMM-Newton observed XTE J1858+034 shortly after the flares and measured hard spectra (i.e. both have low photon indexes or high black-body temperatures) and fluxes. The hard spectral shape points to a likely non-thermal origin of the emission (Tsygankov et al., 2017b). The source exhibits regular outburst activity and persistent accretion between flares cannot be excluded. Moreover, owing to the long spin period XTE J1858+034 may belong to the group of pulsars accreting from a cold low-ionized disk even in quiescent state (Tsygankov et al., 2017a).
| Parameter | Chandra | XMM-Newton |
| phabspow model | ||
| () | 7.5fix | |
| C-value (d.o.f.) | 27.5 (23) | 105.5 (119) |
| Fluxa (erg s-1 cm-2) | ||
| phabsbb model | ||
| () | 7.5fix | |
| (keV) | ||
| C-value (d.o.f.) | 27.4 (23) | 104.9 (119) |
| Fluxa (erg s-1 cm-2) | ||
-
•
a Unabsorbed flux in the 0.5–10 keV energy band.
3.3 Phase-resolved spectral analysis
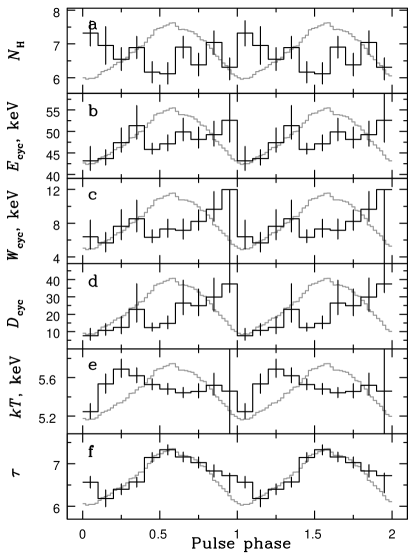
The high counting statistics of the NuSTAR data allowed us to perform a pulse phase-resolved spectral analysis. For that we used our best-fit model from the phase-averaged spectroscopy (phabs(gau+comptt)gabs) and the phase-binning shown in Fig. 2 which was defined based on the available counting statistics and observed pulse profile morphology. The source spectral parameters variations over the pulse are shown in Fig. 5. Based on the simftest simulations the significance of the cyclotron line in all phase-resolved spectra was shown to be higher than .
We see that the continuum parameters (temperature and optical depth of the comptonizing plasma) vary significantly, whereas the relatively large uncertainty on the cyclotron line parameters prevent us from making any conclusion on their stability. The fitted values for absorption column, iron line parameters and the temperature of the seed photons stay constant within the errors over the pulse.
3.4 X-ray position
The original localization accuracy of XTE J1858+034 obtained with the RXTE observatory was 6′ (Remillard et al., 1998). This was further improved by Marshall et al. (1998) based on repeated scans across the source with the RXTE/PCA instrument which allowed to localize the source at RA(2000)=, Dec(2000)=, with a 90-percent confidence error radius of 25. Later, using the imaging capabilities of the JEM-X and IBIS telescopes onboard the INTEGRAL observatory, Molkov et al. (2004) further constrained coordinates of XTE J1858+034: RA=, Dec=, for the IBIS/ISGRI data with the 2′ uncertainty, and RA=, Dec= for the JEM-X data with the 1′ uncertainty. The X-ray image of the sky field obtained with the Chandra observatory is shown in Fig. 6. Two weak X-ray sources compatible with these localization regions were found in the data.
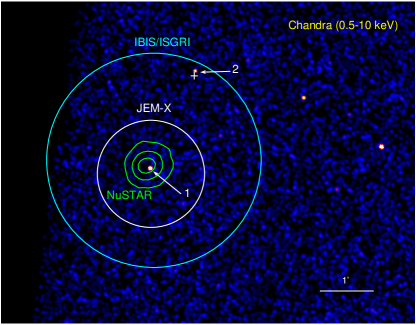
In order to determine the nature of XTE J1858+034, Reig et al. (2005) performed optical photometric and spectroscopic observations of the field around the best-fit INTEGRAL position. It was revealed that only one star with the coordinates RA=, Dec= exhibits H emission (marked with a white cross in Fig. 6). This star was proposed to be a possible counterpart of XTE J1858+034, since the counterpart was expected to be a Be-star.
However, Fig. 6 demonstrates that this star cannot be an optical companion of XTE J1858+034 (source marked with “1”). This conclusion is confirmed by at least three facts: a coincidence of the localization regions obtained by INTEGRAL/JEM-X and NuSTAR (see green contours in Fig. 6), detection of X-ray pulsations with the period of 221 s by NuSTAR, and coincidence of NuSTAR and Chandra positions.
Using our Chandra data we obtained the precise coordinates for XTE J1858+034 of RA=, Dec= (J2000, marked with “1” in Fig. 6), using the wavdetect tool from the ciao package. A statistical uncertainty of at 90% confidence level was obtained following the recommendations available on the online threads555https://cxc.harvard.edu/ciao/threads/wavdetect/. Taking into account the systematic uncertainty of Chandra absolute positions of the same value666https://cxc.harvard.edu/cal/ASPECT/celmon/, the resulting localization accuracy of the source we obtained is (90% confidence level radius; see blue circle in Fig. 7).
4 Discussion
4.1 Structure of the emitting region
The observational properties of X-ray emission from XRPs depend on the physical conditions and geometrical structure of the emitting regions at the NS surface, and thus can be used to probe them. As was already mentioned in Sect. 3.1, the pulse profile of XTE J1858+034 has a sine-like single-peaked shape that is almost independent of energy. At the same time some tentative sign of a phase lag is observed with the soft profile lagging the hard one. A quantitative interpretation of this phenomenon is not possible in absence of adequate models describing emission of X-ray pulsars, however, qualitatively one may speculate that it may be associated with the resonant scattering of X-ray photons by the accretion flow above the hot spot. Indeed, considering that the source is likely in the sub-critical regime of accretion (see below), the optical thickness of the accretion flow above the hot spot is below unity for a non-resonant scattering. Thus, the low energy photons ( keV) leave the system freely with a pencil-beam emission diagram (Basko & Sunyaev, 1975). However, the scattering cross-section near the cyclotron energy ( keV; see below) is well above unity (Herold, 1979; Daugherty & Harding, 1986). Because of that, the cyclotron photons are scattered by the accretion flow. Thus results in an energy-dependent beam function, leading to the observed lag between the pulse profiles.
Variations of the spectral continuum over the pulse phase are also consistent with a pencil-beam emission diagram. From Fig. 5 one can notice also that the optical depth appears to correlate with the flux in the profile, whereas the plasma temperature shows an anti-correlation (except main minimum) reaching maximum values in the wings of the flux peak (see Fig. 5e). This behavior can be interpreted in terms of the sub-critical accretion onto strongly magnetized NS with a pencil-beam emission diagram. In this case the accretion flow loses its kinetic energy in the atmosphere of a NS, resulting in the inverse temperature profile in the NS atmosphere with hotter upper layers where most of energy is released (Basko & Sunyaev, 1975). The maximal flux in the pulse profile corresponds to the situation when an observer looks at a hot spot close to the local normal. Then photons from the deeper and colder layers are detected resulting in a negative/positive correlation of temperature/optical depth with the photon energy flux. This result points to a pencil beam pattern for the pulsars operating in a sub-critical regime. The estimated luminosity of XTE J1858+034 during our NuSTAR observation is erg s-1 for the distance of 10 kpc (see below), whereas the critical luminosity for the pulsar with magnetic field G is expected to be around erg s-1 (Mushtukov et al., 2015a). Thus one may conclude that XTE J1858+034 was observed very close to the critical luminosity, but still in the sub-critical regime.
4.2 Origin of the IR companion
The study of optical catalogs and observational data showed the absence of any object in the localization region of the X-ray source. The upper limit on the observed magnitudes in filters , according to the Pan-STARRS instrumental filters, is around .
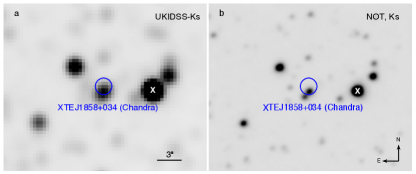
Inspecting the UKIDSS catalogue777http://wsa.roe.ac.uk/ we found that position of XTE J1858+034 determined from the Chandra data is compatible with a faint infrared star, which in turn is apparently blended with another one (Fig. 7a). The blue circle illustrates an uncertainty of the source X-ray position. Based on the UKIDSS data it is impossible to separate fluxes from these stars to measure correct magnitudes of the counterpart in near-IR bands. Therefore to measure characteristics of the counterpart of XTE J1858+034 we performed observations with the NOT telescope in several filters (). The image of the sky field around XTE J1858+034, obtained with NOTCam in the filter is shown in Fig. 7b. It is clearly seen, that the two objects are perfectly separated, by a distance of , and thus the only infrared companion of the source in the NOTCam data is a star with the coordinates of RA=, Dec= (J2000).
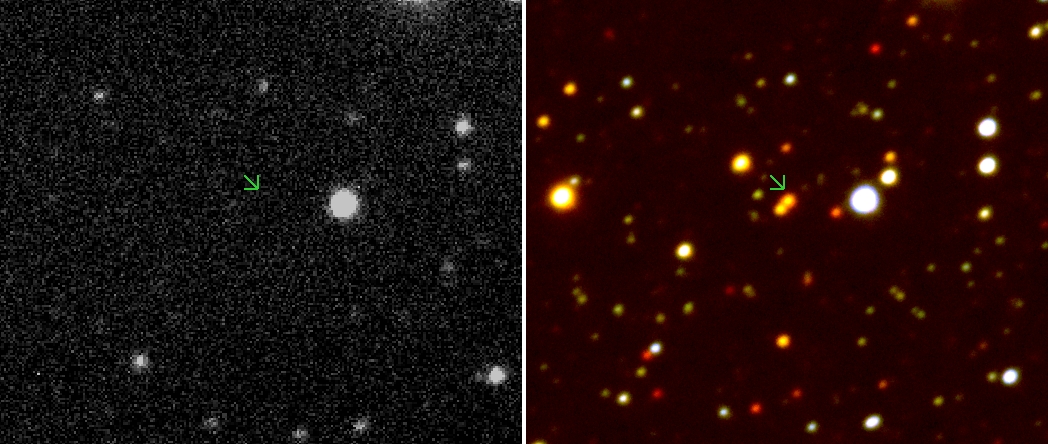
The StanCam images obtained at the NOT in good seeing show no detection at the location, see the -band image compared to the color image in Fig. 8. Photometric analysis of the NOT data using the PSF-photometry (DAOPHOT II) allowed us to determine magnitudes of this star as , , . Note, that for calibrating instrumental magnitudes and converting them into ones we used the GPS/UKIDSS catalog as reference.
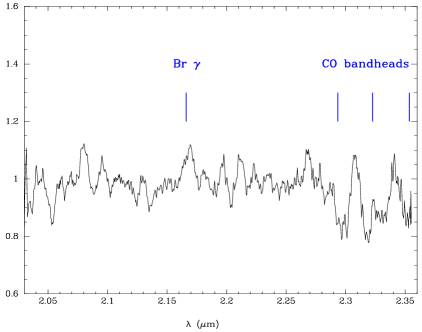
The -band spectrum obtained with NOTCam resulted in a very low S/N ratio of around 7 due to less than optimal conditions. Smoothing the spectrum over 17 pixels, however, and thereby lowering the resolving power from 2100 to 120, improved the S/N to 20, and revealed tentative detection of the CO 2-0, 3-1, and 4-2 bandheads in absorption at 2.29, 2.32 and 2.35 microns, respectively, of which the latter is cut halfway by the instrument sensitivity, see Fig. 9. The RMS in the smoothed spectrum is of the order of 5% and the depth of the features around 15%, giving a 3 detection. As shown in the -band spectral catalog of Wallace & Hinkle (1997) the presence of these CO bands in absorption strongly suggests a late spectral type of luminosity class I or III.
The EW estimated for the 2-0 bandhead at 2.297 m is 24 Å which would point to a late M-type giant or early M-type supergiant according to the relation between spectral type and CO equivalent widths in Figure 2 in Davies et al. (2007). The 3-1 bandhead at 2.323 m is even broader but also more contaminated with noise. We believe it is fairly safe to deduce that the object is a late type, most likely an M-type giant or supergiant. The rest of the spectrum remains featureless, although there is a small bump below detection levels at the position of Br-.
Some conclusions can also be made about the nature of the studied star based on the photometric results. Taking intrinsic colors of different classes of stars from Wegner (2014, 2015), we compare them with the color of the counterpart determined from the NOT observations. From a simple relation we can find an extinction correction for each class of stars to correspond to the measured color of the source. Assuming a standard extinction law (Cardelli et al., 1989) expected in this sky region, we can transform each into . At the same time, comparing absolute magnitudes in the -band of the same stars (Wegner, 2000, 2006, 2007) with the measured magnitude of the source in the -band (taking into account ), we can estimate a probable distance to each class of stars from a relation .
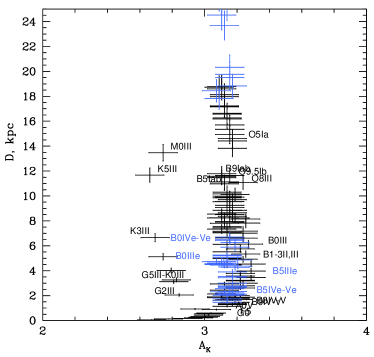
The results of such estimations for different classes of stars are presented in Fig. 10. From this diagram it is not possible to unambiguously determine the class of the companion, but we can get some restrictions on the extinction magnitude towards the source. In particular, for OB-giants or supergiants the extinction toward XTE J1858+034 should be around , for red giant stars , and for main sequence stars is somewhere between these values. In particular, if we assume that the optical counterpart of XTE J1858+034 is a giant star it should be located at 4–14 kpc from the Sun. Note, that above extinction converted into the hydrogen column density via standard relations (Predehl & Schmitt, 1995; Güver & Özel, 2009) agree generally with results obtained from the source X-ray spectrum in the low state.
A significant absorption towards the source can easily explain its non-detection in optical filters at the NOT telescope and with Gaia. The extinction corresponds to for the standard law. Thus an expected magnitude of the source in the -filter should be 30.
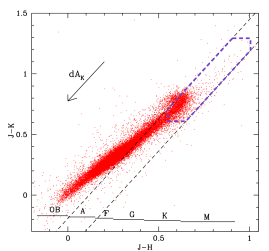
At the next step we compare the observed colors and of the counterpart with intrinsic ones of different classes of stars in a similar way as described by Karasev et al. (2012). The red dots in Fig. 11 indicate colors of the different type stars in the nearest 100 pc from the Sun taken from the 2MASS catalogue and Hipparcos observatory data (van Leeuwen, 2007). The interstellar extinction for such nearby stars in the IR-filters is negligibly small, so we obtain the desired set of unabsorbed reference stars of different classes. The strips at the bottom indicate the regions of the diagram corresponding to a particular type of stars (marked by the letters, see, e.g., Wegner 2014, 2015).
The position of the IR counterpart of XTE J1858+034 ( and ) is far beyond this diagram due to a significant interstellar extinction (see Fig. 12). But, correcting the source’s magnitudes for different extinctions, we can shift its colors downward and to the left toward unreddened stars. The direction of this motion is indicated by the dashed straight lines whose slope corresponds to the ratio under the assumption of a standard extinction law (Cardelli et al., 1989).
The separation between the lines corresponds to the uncertainty of the measured colors of the source. Only the stars lying within the dashed lines can be the source’s companions. We see from the figure that only the red giants of late K or M classes are eligible to be a real companion of XTE J1858+034. At the same time, early classes of giants or supergiants can be excluded according to this diagram.
As was previously shown, if the counterpart of XTE J1858+034 is indeed a red giant star, the magnitude of the absorption towards the source is . Using these values for the extinction correction of the observed colors, we can additionally restrict the class of possible source companions (a violet dashed polygon in Fig. 11).
Summarizing all of the above, we can conclude that the most likely optical counterpart of the source is a K-M red giant located at a distance of 7–14 kpc. It is worth noting that such a significant distance to the system is supported by the X-ray timing analysis performed by Malacaria et al. (in press), whose estimate is kpc.
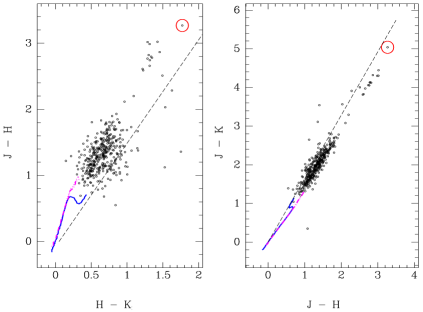
The same conclusion can be reached using a slightly different approach to the analysis and interpretation of photometric measurements. The photometry of point sources in the 80 FOV of the NOTCam HR-camera in the and color-color diagrams are shown in Fig. 12. In both diagrams the intrinsic colors of main-sequence stars are shown as a continuous blue curve, while those of giants (dotted pink curve) and super-giants (dot-dashed pink curve) taken from Koornneef (1983). Giants and supergiants overlap but both clearly separate from the main-sequence stars at late spectral types. The reddening vector is plotted for an A0 star as a dashed line based on a standard interstellar extinction law (Cardelli et al., 1989). The target is the encircled dot, one of the reddest objects detected in all three filters. We see that the target seems to follow the trace of a highly reddened late type giant or supergiant, and its location does not fit an early type reddened star. The photometry clearly supports the spectroscopic suggestion of a K or M giant or supergiant. The intrinsic color is in the small range from 0.12 to 0.35 mag from K0 to M6 stars according to Koornneef (1983) and Wegner (2014). The two extremes give = from 1.42 to 1.65 mag, which translates to extinction estimates of in the range from 2.5 to 2.9 mag. This gives a dereddened -band magnitude in the range from 10.6 to 11.0 mag. The different spectral types have different absolute -band magnitudes, resulting in a range of distances from 7–14 kpc for K-M giants, while for supergiants the distance is even larger.
4.3 Previously proposed companions
At least two different stars were earlier considered as a possible companion of XTE J1858+034 (Reig et al., 2005; Malacaria et al., 2020). The first star was discussed above and is the only one in the nearby vicinity of XTE J1858+034 (see Fig. 6, marked by a cross), whose optical spectrum shows H emission. Reig et al. (2005) suggested this object to be a Be star and a possible counterpart of XTE J1858+034. It is important to note that coordinates of this star reported by Reig et al. (2005) are approximately 6′′ away from another X-ray object, registered by Chandra inside the INTEGRAL/IBIS error circle (marked with “2” in Fig. 6, coordinates RA=, Dec=; Skiff 2014). We checked Pan-STARRS and Gaia data and found that there is only one optical star coinciding exactly with the Chandra source “2”. Its magnitudes in optical filters are similar to the ones reported by Reig et al. (2005). These facts allow us to suggest that this star and the star reported by Reig et al. (2005) are the same object. The Gaia data indicate that it is located at a distance of pc (Bailer-Jones et al., 2018) and has an effective temperature of K (Gaia Collaboration et al., 2018). These measurements as well as the registration of the H emission line by Reig et al. (2005) indicate that it can be a nearby cataclysmic variable.
5 Conclusion
In this work we present the results of the spectral and temporal analysis of a poorly studied XRP XTE J1858+034 performed in a broad range of energies and mass accretion rates. The spectrum of the source obtained with the NuSTAR observatory during an outburst in 2019 revealed the presence of a cyclotron absorption line in the energy spectrum at keV, that allowed us to estimate the NS magnetic field strength to be G. The spectral properties of XTE J1858+034 observed by the XMM-Newton and Chandra observatories in the quiescent state point to ongoing accretion in this state, which we interpreted as accretion from the cold (low-ionization) accretion disk.
Chandra data allowed us to obtain the precise localisation of XTE J1858+034 for the first time. Observations at the NOT telescope revealed only one potential near-IR companion of the pulsar. Spectral properties of the counterpart point to the red giant star located at 7–14 kpc suggesting that the system is likely a symbiotic binary hosting an XRP rather than Be X-ray binary as previously proposed. This distance agrees well with estimates obtained from the timing properties of the pulsar (Malacaria et al., in press).
References
- Anders & Grevesse (1989) Anders, E., & Grevesse, N. 1989, Geochim. Cosmochim. Acta, 53, 197, doi: 10.1016/0016-7037(89)90286-X
- Arnaud (1996) Arnaud, K. A. 1996, in Astronomical Society of the Pacific Conference Series, Vol. 101, Astronomical Data Analysis Software and Systems V, ed. G. H. Jacoby & J. Barnes, 17
- Bailer-Jones et al. (2018) Bailer-Jones, C. A. L., Rybizki, J., Fouesneau, M., Mantelet, G., & Andrae, R. 2018, AJ, 156, 58, doi: 10.3847/1538-3881/aacb21
- Basko & Sunyaev (1975) Basko, M. M., & Sunyaev, R. A. 1975, A&A, 42, 311
- Boldin et al. (2013) Boldin, P. A., Tsygankov, S. S., & Lutovinov, A. A. 2013, Astronomy Letters, 39, 375, doi: 10.1134/S1063773713060029
- Cardelli et al. (1989) Cardelli, J. A., Clayton, G. C., & Mathis, J. S. 1989, ApJ, 345, 245, doi: 10.1086/167900
- Daugherty & Harding (1986) Daugherty, J. K., & Harding, A. K. 1986, ApJ, 309, 362, doi: 10.1086/164608
- Davies et al. (2007) Davies, B., Figer, D. F., Kudritzki, R.-P., et al. 2007, ApJ, 671, 781, doi: 10.1086/522224
- Djupvik & Andersen (2010) Djupvik, A. A., & Andersen, J. 2010, Astrophysics and Space Science Proceedings, 14, 211, doi: 10.1007/978-3-642-11250-8_21
- Doroshenko et al. (2017) Doroshenko, V., Tsygankov, S. S., Mushtukov, A. A., et al. 2017, MNRAS, 466, 2143, doi: 10.1093/mnras/stw3236
- Doroshenko et al. (2008) Doroshenko, V. A., Doroshenko, R. F., Postnov, K. A., Cherepashchuk, A. M., & Tsygankov, S. S. 2008, Astronomy Reports, 52, 138, doi: 10.1134/S1063772908020054
- Filippova et al. (2005) Filippova, E. V., Tsygankov, S. S., Lutovinov, A. A., & Sunyaev, R. A. 2005, Astronomy Letters, 31, 729, doi: 10.1134/1.2123288
- Gaia Collaboration et al. (2018) Gaia Collaboration, Brown, A. G. A., Vallenari, A., et al. 2018, A&A, 616, A1, doi: 10.1051/0004-6361/201833051
- Garmire et al. (2003) Garmire, G. P., Bautz, M. W., Ford, P. G., Nousek, J. A., & Ricker, George R., J. 2003, in Society of Photo-Optical Instrumentation Engineers (SPIE) Conference Series, Vol. 4851, X-Ray and Gamma-Ray Telescopes and Instruments for Astronomy., ed. J. E. Truemper & H. D. Tananbaum, 28–44, doi: 10.1117/12.461599
- Güver & Özel (2009) Güver, T., & Özel, F. 2009, MNRAS, 400, 2050, doi: 10.1111/j.1365-2966.2009.15598.x
- Harrison et al. (2013) Harrison, F. A., Craig, W. W., Christensen, F. E., et al. 2013, ApJ, 770, 103, doi: 10.1088/0004-637X/770/2/103
- Herold (1979) Herold, H. 1979, Phys. Rev. D, 19, 2868, doi: 10.1103/PhysRevD.19.2868
- Karasev et al. (2012) Karasev, D. I., Lutovinov, A. A., Revnivtsev, M. G., & Krivonos, R. A. 2012, Astronomy Letters, 38, 629, doi: 10.1134/S1063773712100039
- Koornneef (1983) Koornneef, J. 1983, A&A, 500, 247
- Krimm et al. (2013) Krimm, H. A., Holland, S. T., Corbet, R. H. D., et al. 2013, ApJS, 209, 14, doi: 10.1088/0067-0049/209/1/14
- Leahy (1987) Leahy, D. A. 1987, A&A, 180, 275
- Lutovinov & Tsygankov (2009) Lutovinov, A. A., & Tsygankov, S. S. 2009, Astronomy Letters, 35, 433, doi: 10.1134/S1063773709070019
- Malacaria et al. (2020) Malacaria, C., Jenke, P., Roberts, O. J., et al. 2020, ApJ, 896, 90, doi: 10.3847/1538-4357/ab855c
- Marshall et al. (1998) Marshall, F. E., Chakrabarty, D., & Finger, M. H. 1998, IAU Circ., 6828, 2
- Molkov et al. (2004) Molkov, S. V., Cherepashchuk, A. M., Revnivtsev, M. G., et al. 2004, The Astronomer’s Telegram, 274, 1
- Mushtukov et al. (2015a) Mushtukov, A. A., Suleimanov, V. F., Tsygankov, S. S., & Poutanen, J. 2015a, MNRAS, 447, 1847, doi: 10.1093/mnras/stu2484
- Mushtukov et al. (2015b) Mushtukov, A. A., Tsygankov, S. S., Serber, A. V., Suleimanov, V. F., & Poutanen, J. 2015b, MNRAS, 454, 2714, doi: 10.1093/mnras/stv2182
- Nakajima et al. (2010) Nakajima, M., Mihara, T., & Makishima, K. 2010, ApJ, 710, 1755, doi: 10.1088/0004-637X/710/2/1755
- Nakajima et al. (2019) Nakajima, M., Negoro, H., Kurogi, K., et al. 2019, The Astronomer’s Telegram, 13217, 1
- Paul & Rao (1998) Paul, B., & Rao, A. R. 1998, A&A, 337, 815. https://arxiv.org/abs/astro-ph/9805366
- Predehl & Schmitt (1995) Predehl, P., & Schmitt, J. H. M. M. 1995, A&A, 293, 889
- Reig et al. (2005) Reig, P., Negueruela, I., Papamastorakis, G., Manousakis, A., & Kougentakis, T. 2005, A&A, 440, 637, doi: 10.1051/0004-6361:20052684
- Remillard et al. (1998) Remillard, R., Levine, A., Takeshima, T., et al. 1998, IAU Circ., 6826, 2
- Skiff (2014) Skiff, B. A. 2014, VizieR Online Data Catalog, B/mk
- Staubert et al. (2019) Staubert, R., Trümper, J., Kendziorra, E., et al. 2019, A&A, 622, A61, doi: 10.1051/0004-6361/201834479
- Takeshima et al. (1998) Takeshima, T., Corbet, R. H. D., Marshall, F. E., Swank, J., & Chakrabarty, D. 1998, IAU Circ., 6826, 1
- Tsygankov et al. (2017a) Tsygankov, S. S., Mushtukov, A. A., Suleimanov, V. F., et al. 2017a, A&A, 608, A17, doi: 10.1051/0004-6361/201630248
- Tsygankov et al. (2017b) Tsygankov, S. S., Wijnands, R., Lutovinov, A. A., Degenaar, N., & Poutanen, J. 2017b, MNRAS, 470, 126, doi: 10.1093/mnras/stx1255
- van Leeuwen (2007) van Leeuwen, F. 2007, A&A, 474, 653, doi: 10.1051/0004-6361:20078357
- Wachter et al. (1979) Wachter, K., Leach, R., & Kellogg, E. 1979, ApJ, 230, 274, doi: 10.1086/157084
- Wallace & Hinkle (1997) Wallace, L., & Hinkle, K. 1997, ApJS, 111, 445, doi: 10.1086/313020
- Wegner (2000) Wegner, W. 2000, MNRAS, 319, 771, doi: 10.1046/j.1365-8711.2000.03884.x
- Wegner (2006) —. 2006, MNRAS, 371, 185, doi: 10.1111/j.1365-2966.2006.10549.x
- Wegner (2007) —. 2007, MNRAS, 374, 1549, doi: 10.1111/j.1365-2966.2006.11265.x
- Wegner (2014) —. 2014, Acta Astron., 64, 261
- Wegner (2015) —. 2015, Astronomische Nachrichten, 336, 159, doi: 10.1002/asna.201312143