CaEGCN: Cross-Attention Fusion based Enhanced Graph Convolutional Network for Clustering
Abstract
With the powerful learning ability of deep convolutional networks, deep clustering methods can extract the most discriminative information from individual data and produce more satisfactory clustering results. However, existing deep clustering methods usually ignore the relationship between the data. Fortunately, the graph convolutional network can handle such relationship, opening up a new research direction for deep clustering. In this paper, we propose a cross-attention based deep clustering framework, named Cross-Attention Fusion based Enhanced Graph Convolutional Network (CaEGCN), which contains four main modules: the cross-attention fusion module which innovatively concatenates the Content Auto-encoder module (CAE) relating to the individual data and Graph Convolutional Auto-encoder module (GAE) relating to the relationship between the data in a layer-by-layer manner, and the self-supervised model that highlights the discriminative information for clustering tasks. While the cross-attention fusion module fuses two kinds of heterogeneous representation, the CAE module supplements the content information for the GAE module, which avoids the over-smoothing problem of GCN. In the GAE module, two novel loss functions are proposed that reconstruct the content and relationship between the data, respectively. Finally, the self-supervised module constrains the distributions of the middle layer representations of CAE and GAE to be consistent. Experimental results on different types of datasets prove the superiority and robustness of the proposed CaEGCN.
Index Terms:
Cross-attention fusion mechanism, Graph convolutional network, Deep clustering.Supplementary materials
The supplementary code is available at https://github.com/huogy/CaEGCN.
I Introduction
Clustering is an essential topic in data mining area, which divides a collection of objects into multiple clusters of similar objects. Inspired by the powerful feature extraction capability of deep convolutional network, many deep learning based clustering methods have been proposed in recent years, demonstrating much significant progress in clustering research [1, 2, 3, 4]. The two-step spectral clustering method is usually employed here: A ‘good’ data representation or similarity matrix which is learned from these deep learning methods can be pipelined to the downstream models/algorithms such as K-means [5] or Normalized Cut [6] to obtain the final clustering result.
However, existing deep clustering methods only focus on the data content, and usually ignore the relationship between the data, i.e., the structural information. With the development of the data collection and analysis technologies, people not only collect the data but also obtain or build the relationship between the data in the form of graphs, such as social networks [7], biochemical structure networks [8] and railway networks [9]. These graphs can help people make better data-driven decisions. Therefore, how to embed the relationship between the data into deep clustering becomes a thorny problem.
Furthermore, based on these raw graphs, one wishes to mine the latent relationship between the data effectively. As we know, the edges in a graph represent the explicit relationship, which is also regarded as the first-order structural relationship. Many graph embedding methods exploit such relationship, including DeepWalk [10], node2vec [11], and LINE [12]. But, the data relationship in the real-world is complicated. There still exist many implicit and complicated relationships. For example, two nodes may not be directly connected in a graph, while they have many identical neighbors. However it is natural belief that these two nodes have a high-order structural relationship.
In order to improve the clustering effect of deep clustering methods, utilizing the high-order relationships is necessary. As an important approach in deep learning methods, Graph Convolutional Network (GCN) [13, 14, 8] can mine such potential high-order relationship between the data. GCN transfers the graph structured data to a low-dimensional, compact, and continuous feature space. While GCN simultaneously has very successful application in encoding and exploring graph structure and node content, it seems little attention has been given to applying GCNs to deep clustering tasks.
For the purpose of clustering, we can naturally construct an auto-encoder module based on a GCN, the so-called GAE module. GCN can lead the signals to be smoother, which is the inherent advantage of GCN. However, such signal smoothing operation makes the signals more similar, losing the diversity of signals. It has been proven that GCN is prone to over-smoothing when the number of layers becomes large [15], which results in a poor performance in related tasks. So, GCN cannot be stacked as deeply as the CNN model in visual tasks.
To overcome this drawback of GCN, we introduce a common auto-encoder network to supplement the data content information to GAE, like the effect of the residual network. Multiple layers are usually stacked in the deep network, and each layer captures different latent features of the data. To combine the high-order relationship of the data (in GAE) with the potential details of the corresponding content information (in auto-encoder) layer-by-layer, we propose a cross-attention fusion mechanism, which highlights the discriminative information for clustering tasks. Different from the traditional attention mechanism, our cross-attention fusion mechanism fuses two kinds of heterogeneous representations, i.e., the regular data and the irregular graph.
In this paper, we propose a novel clustering framework, named Cross-Attention Fusion based Enhanced Graph Convolutional Network (CaEGCN). In CaEGCN, we can extract the high-order relationship between the data through the Graph Convolutional Auto-encoder module (GAE). To alleviate the over-smoothing problem of GAE and supplement the content information to GAE, we build a Content Auto-encoder module (CAE) composed of a common auto-encoder, which extracts the content information of the data. Besides, we propose a cross-attention fusion mechanism to encode above two modules to output a complete representation. In order to guide the optimal clustering direction of the entire model in an end-to-end manner, we introduce a self-supervised module.
The contributions of this paper are listed as follows as a summary,
-
•
We propose an end-to-end cross-attention fusion based deep clustering framework, in which the cross-attention fusion module creatively concatenates the graph convolutional auto-encoder module and content auto-encoder module in multiple layers;
-
•
We propose a cross-attention fusion module to assign the attention weights to the fused heterogeneous representation;
-
•
In the graph convolutional auto-encoder module, we propose simultaneously reconstructing the content and relationship between the data, which effectively strengthens the clustering performance of CaEGCN;
-
•
We test CaEGCN on the natural language, human behavior and image datasets to prove the robustness of CaEGCN.
The rest of the paper is organized as follows. In Section II, we briefly review the graph convolutional network, deep clustering and attention mechanism, respectively. In Section III, we detail the cross-attention fusion based enhanced graph convolutional network for clustering by presenting the four main modules. In Section IV, the proposed method is evaluated on clustering problems with several public datasets. Finally, the conclusion and the future work are discussed in Section V.
II Related Work
In this section, we review the necessary knowledge related to the research of this paper, which are graph convolutional network, deep clustering and attention mechanism.
II-A Graph Convolutional Network (GCN)
Many research fields consider certain natural graph structures, such as the traffic road network [16], the human skeleton points [17] and molecules structures in biology [18]. Graph is a kind of irregular structural data, which is dispersive and disorderly. To cope with such irregular data, a lot of GCN based methods have been proposed. These methods can be divided into two main categories: spectral-based GCN methods [13, 15, 14] and spatial-based GCN methods [8, 19]. In a GCN, nodes can be assigned to the features of data, and the edge weight information describes the similarity between nodes, which shows that graph has a strong information organization ability.
The spectral-based GCN methods exploit the spectrum representation of a graph. Kipf et al. [15] initially proposed the graph convolutional networks for prediction tasks, which simulates the graph convolutional operation through the local first-order approximation of spectral convolutions. Wang et al. [20] introduced the generative adversarial mechanism into the learning of graph representation, and developed a new graph softmax function utilizing the latent structure information of the data.
The spatial-based GCN methods directly define the operations on the graph and extract the information from the spatial neighbor groups. Velickovic et al. [8] proposed a graph attention network, which computes the corresponding hidden information for each node and uses the attention mechanism to weight the importance of each node compared with its neighbors. More comprehensive reviews about GCN can be found in [21].
II-B Deep Clustering
The current deep learning researches mainly concentrate on the supervised learning tasks. How to extend it onto a framework for unsupervised clustering is a meaningful problem. Fortunately, some researchers have conducted the related works. Xie et al. [2] proposed a deep embedded clustering method, which exploits the deep learning to learn the feature representations and the cluster assignments of the data. Ji et al. [3] constructed a self-expression layer between the encoder and decoder of the auto-encoder.
With the development of multi-view clustering, more and more researchers introduce the relationship between the data to enhance the clustering performance. Kipf et al. [22] used the graph convolutional encoder and an inner product decoder to build a Variational Graph Auto-encoder (VGAE), which learns the latent features of undirected graphs for clustering. Pan et al. [23] improved the VGAE framework and introduced an adversarial regularization rule to optimize the learned representation for clustering. Wang et al. [24] employed the graph attention network to weight the importance of neighboring nodes, and obtained a more accurate representation of each node. Li et al. [25] jointed the advantages of K-means and spectral clustering, and embedded it into the graph auto-encoder to generate the better data representations. Bo et al. [26] transferred the representation learned by the auto-encoder to the corresponding GCN, and proposed a dual self-supervision mechanism to unify these two different deep neural architectures, which is an important baseline in this paper.
In above, GCN-based clustering methods update network parameters by reconstructing the adjacency matrix and sufficiently exploit the structure information, but they ignore the node information and the over-smoothing problem.
II-C Attention Mechanism
Recently, in the fields of machine translation [27, 28], semantic segmentation [29] and image generation [30], the attention mechanism has become a trick module that improves the effectiveness of most models. Self-attention is a variant of the traditional attention mechanism. Vaswani et al. [27] proposed the self-attention mechanism in machine translation applications, which obtains the satisfactory experimental results. Besides, self-attention mechanism is robust and easily embedded into recurrent neural networks [31], generative adversarial networks [32] and other neural networks, which also achieves the excellent experimental results.
Many scholars continuously optimize the self-attention mechanism. Wang et al. [33] introduced a dependency tree into the self-attention mechanism to represent the relationship between words. Yu et al. [34] extracted the local information through the convolution model to complement the global interaction of the self-attention mechanism. Xue et al. [35] used the self-attention mechanism in image segmentation, which better achieves the accurate segmentation through the long-range context relations
To simultaneously handle the heterogeneous data in the proposed model, i.e., the regular data and the irregular graph, we propose the cross-attention fusion module in this paper.
III Cross-Attention Fusion based Enhanced Graph Convolutional Network
In this section, we present a novel cross-attention fusion based enhanced graph convolutional network model, which sufficiently integrates the content information and the relationship between the data in a multi-level adaptive manner to improve the clustering performance.
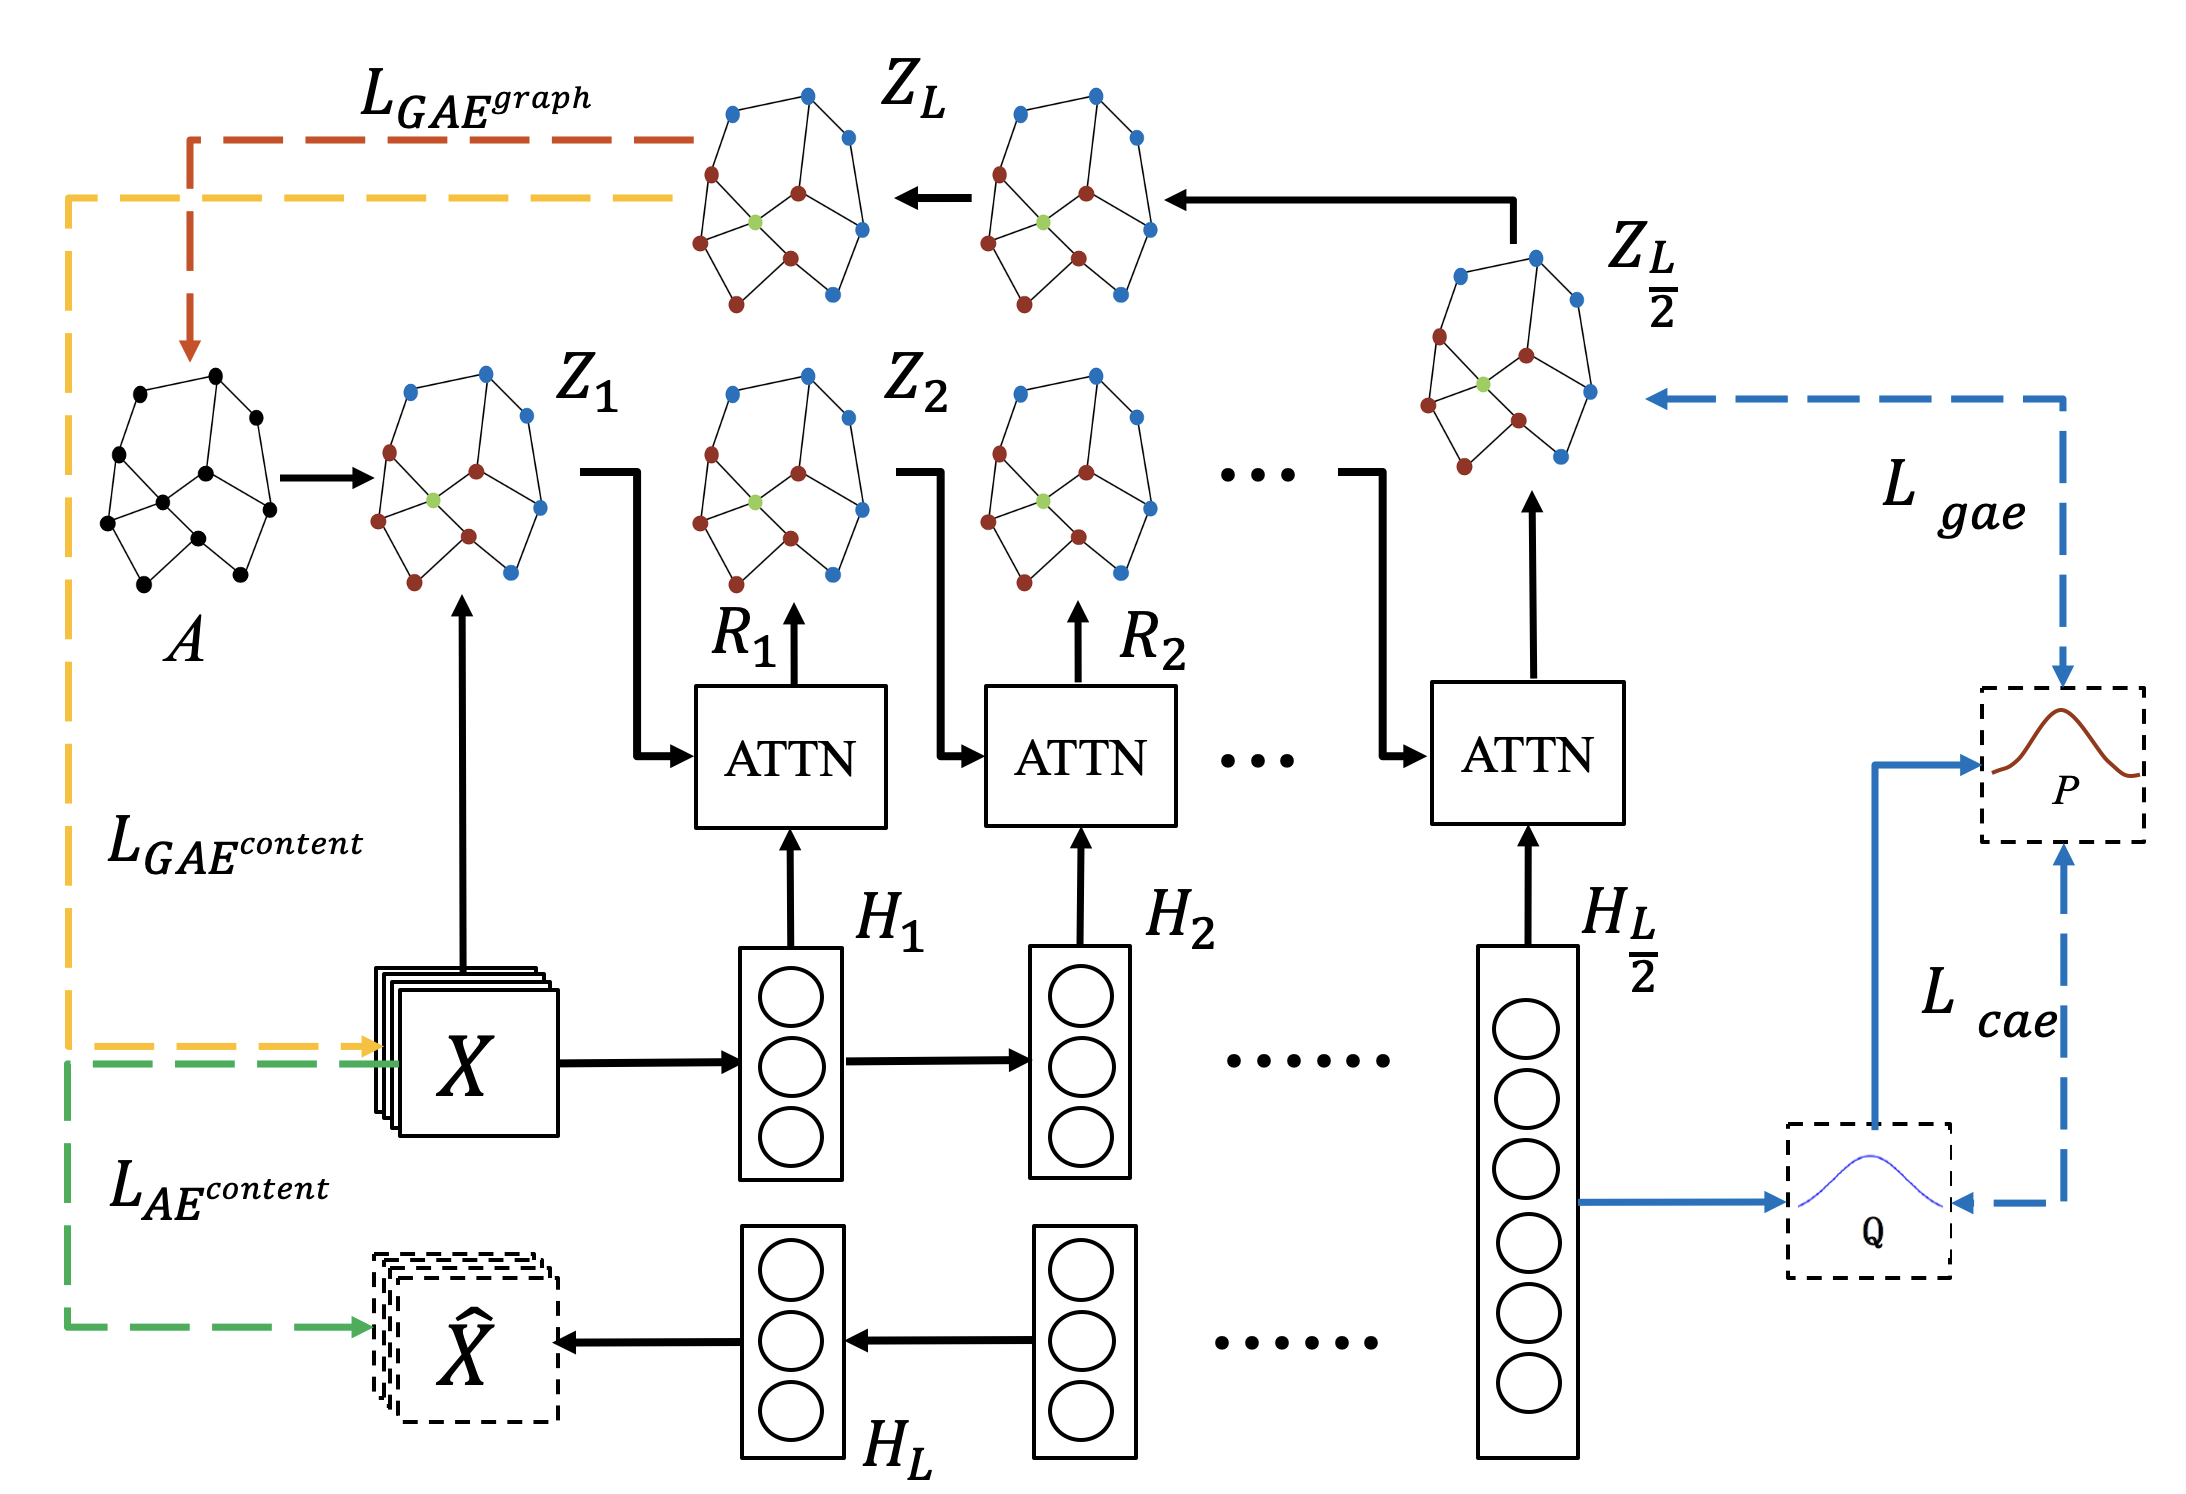
The overall network architecture is shown in Figure 1, consisting of four main modules: an auto-encoder module for extracting the content information; a GCN based auto-encoder module for exploiting the relationship between the data; a cross-attention module for concatenating above two modules,where the multi-level adaptive fusing strategy supplements the effective content information as much as possible during the transmission process; and a self-supervised module used to constrain the consistency of the distributions of middle layer representations.
III-A Constructing the Graph
Before presenting the proposed CaEGCN model, we first construct the necessary graph of raw data. Given a set of data containing samples and the -th sample , we employ the commonly-used -nearest neighbor (KNN) to construct the corresponding graph to exhibit its structure information.
For the image data, we calculate the similarity between samples using the heat kernel method as [36],
| (1) |
where represents the variance scale parameter.
As for the natural language data, the inner-product method is chosen to measure the similarity between samples as follow,
| (2) |
Then, with the above calculated similarities among all samples, we pick up the highest correlation neighbors of each sample and connect them; so, a graph is obtained. In many applications, the graph information actually comes with the given dataset .
III-B Content Auto-encoder Module (CAE)
As we know, deep convolutional network can effectively extract the critical features from the complex data. Auto-encoder can reconstruct the samples and reduce the missing information during the learning procedure, which is naturally proper for unsupervised learning. To extract the content information in the data, we first train a deep convolutional network based auto-encoder module, which is named as Content Auto-encoder Module (CAE).
We represent the input of the -th layer as , then its output can be obtained by,
| (3) | ||||
where the activation function of the -th layer, , can be chosen according to the practical applications, such as ReLU or Sigmoid. and denote the weight and bias of the -th layer of CAE, respectively. In addition, the input in the first layer of CAE is the raw data , i.e., . The output in the final layer reconstructs the raw data, i.e., , and the final loss function of CAE can be defined as,
| (4) |
where denotes the Frobenius norm.
III-C Cross-Attention Fusion Module
As shown in Figure 1, CAE extracts the content information in the data, and GAE exploits the corresponding relationship between the data. How to fuse these two kinds of information for clustering tasks is a key problem.
Cross-attention fusion mechanism has the global learning ability and good parallelism, which can further highlight the critical information in the fusion representations while suppressing the useless noise. Therefore, we use the cross-attention fusion mechanism to integrate the content information learned by CAE and the data relationship learned by GAE in a multi-level adaptive manner, which is the so-called Cross-Attention Fusion Module.
We define the cross-attention fusion mechanism as,
| (5) |
where the query , the key and the value . The raw fusion representation is the input of the cross-attention fusion module, which is defined as,
| (6) |
where is the output of -th layer in CAE and is the output of corresponding layer in GAE. is a trade-off parameter, which is set to in our experiments.
To discover the latent relationship between data and generalize the cross-attention fusion mechanism (5), we firstly calculate the similarity between the fusion query and the fusion key ,
| (7) |
where and denote the -th and -th vectors in and , respectively.
Then, we execute the softmax normalization on above to obtain the relevance weight as follows,
| (8) |
Finally, the output of the cross-attention fusion mechanism , i.e., the fusion representation of the data content information and the relationship between data, can be written as,
| (9) |
To further perceive different aspects of the data, multi-head mechanism is also introduced, which contains multiple parallel cross-attention fusion modules. Specifically, we repeatedly project the query , key and value to obtain parallel cross-attention modules. Each cross-attention fusion module is regarded as one head, and each head has the different weight matrices , , to linearly transform the fusion features , , where is the dimensionality of the -th layer. The -th head is,
| (10) |
We concatenate the outputs of all heads, and multiply the weight matrix to get the final cross-attention fusion representation,
| (11) |
where denotes the matrix concatenate operation. This is the so-called multi-head mechanism and cross-attention fusion module.
III-D Graph Convolutional Auto-Encoder Module (GAE)
As we mentioned before, the relationship between the data can effectively improve the clustering performance. Most deep clustering methods only consider the content information of data, while ignoring the important data relationship [2]. Fortunately, Graph Convolutional Network (GCN) [19] is able to handle such relationships and the content information of data collaboratively. To exploit GCN in unsupervised clustering tasks, we propose a GCN based Auto-Encoder module (GAE), which creatively reconstructs both graph and content information.
The previous cross-attention mechanism module combines the content representation from CAE with the relationship representation from GAE to output a fusion representation in different layers. Then, the GAE executes the spectral graph convolution on such to learn the high-order discriminative information based on the adjacency matrix . Finally, the middle layer is used for clustering.
The convolution operation in each GAE layer can be expressed as follow,
| (12) |
where is the approximated graph convolutional filter and is the degree matrix of , where . With the identity matrix and the adjacency matrix , we use to ensure the self-loop in each node. Additionally, denotes the weight of the -th layer, and is the output of the -th GAE layer.
It should be noted that the input of the first layer in GAE is slightly different. The first layer just uses the raw data instead of as input,
| (13) |
After this multi-layer learning, the GAE encoder encodes both the raw relationship and the content into a useful representation . In order to preserve more information, we set the graph reconstruction and content reconstruction errors as the loss functions of GAE.
i) Graph Reconstruction Loss. We choose a simple inner product operation to reconstruct the relationship between samples as [22],
| (14) |
where is the output of the last GAE layer, and is the reconstructed adjacency matrix. The loss of graph reconstruction can be defined as,
| (15) |
By minimizing the error between and , the GAE module may preserve more data relationship in the latent representation to improve the clustering performance.
ii) Content Reconstruction Loss. Except for the relationship between the data, we also constrain the GAE module to preserve enough content information, which has much difference with formula (4); so, we creatively define its loss function as,
| (16) |
where is the output of the last layer in GAE, which has the same size with the raw data . In this way, the GAE encodes both the relationship and the content of samples into a discriminative representation for clustering.
III-E Self-Supervised Module
It is difficult to judge whether the learned representation is optimally for clustering during the optimization procedure. We need to give an optimization target about clustering.
To solve this problem, we firstly get a set of initial cluster centers by performing K-means on , where is the number of clusters. These cluster centers guide approximately the optimization direction for , which is the so-called Self-Supervised Module.
We use the Student’s -distribution [37] to calculate the similarity between the middle layer representation and the cluster centers as follow,
| (17) |
where is the -th sample representation of . And measures the probability that the -th sample is assigned to the -th cluster, so is the overall soft assignment distribution.
Furthermore, the choice of target distribution directly determines the clustering quality. We believe that the high-confidence assignments in is reliable and can be used as the target distribution. We raise to highlight the role of high-confidence distribution,
| (18) |
where is the soft cluster frequency. The distribution of and should be close to each other as follow,
| (19) |
Similarly, it is easy to construct a soft assignment distribution for the representation , then we can use the target distribution to supervise the distribution as,
| (20) |
Now, the optimization goals of GAE and CAE are unified into a distribution , which makes the learned representation more suitable for clustering tasks.
III-F Overall Loss Function
The overall objective loss function of Cross-Attention Fusion based Enhanced Graph Convolutional Network (CaEGCN) can be summarized as,
| (21) | ||||
There are five items in the above objective function, including three reconstruction losses and two self-supervision losses, which optimizes the data representations for clustering tasks from different perspectives.
After optimizing the above objective function, the local optimal representation is obtained. Then, we perform the softmax operation on to get the final clustering results, i.e., .
IV Experimental
In this section, CaEGAN is evaluated on various type of public datasets, including natural language, human behavior and image datasets. We present the experimental settings and analysis below.
| Dataset | Metric | K-means | AE | IEDC | VGAE | ARGA | DAEGC | SDCN | CaEGCN | ||||||||||||||||||||||||||||||||||||
|---|---|---|---|---|---|---|---|---|---|---|---|---|---|---|---|---|---|---|---|---|---|---|---|---|---|---|---|---|---|---|---|---|---|---|---|---|---|---|---|---|---|---|---|---|---|
| ACM |
|
|
|
|
|
|
|
|
|
||||||||||||||||||||||||||||||||||||
| DBLP |
|
|
|
|
|
|
|
|
|
||||||||||||||||||||||||||||||||||||
| Citeseer |
|
|
|
|
|
|
|
|
|
||||||||||||||||||||||||||||||||||||
| HHAR |
|
|
|
|
|
|
|
|
|
||||||||||||||||||||||||||||||||||||
| USPS |
|
|
|
|
|
|
|
|
|
IV-A Datesets
-
•
ACM [26] contains papers of major categories (i.e., database, wireless communication and data mining). The keywords of each paper are chosen as its feature. Different papers of the same author should have the relative strong correlation, so we can construct the structure graph for GCN.
-
•
DBLP [38] is an author network dataset collected from the DBLP website, which includes authors of categories. The research fields of each author are treated as the feature.
-
•
Citeseer111https://csxstatic.ist.psu.edu/downloads/data is a citation network dataset which is composed of paper features and citation connections between papers. This dataset has papers of categories.
-
•
HHAR [39] consists of sensor records collected from smart phones and smart watches, which is divided into categories, including biking, sitting, standing, walking, stair up and stair down.
-
•
USPS [40] contains gray images of hand-written digits, and the size of each images is .
IV-B Compared Methods
To verify the effectiveness of CaEGCN, we compare it with several state-of-the-art clustering methods, including,
-
•
K-means [40] is a basic clustering algorithm based on the content of data only.
-
•
Auto-Encoder (AE) [1] performs K-means on the low-dimensional representations learned from the deep auto-encoder network.
-
•
Improved deep embedded clustering (IEDC) [4] adds the clustering oriented loss and the reconstruction loss to the deep auto-encoder network, which realizes the one-step clustering of low-dimensional representations.
-
•
Variational Graph Auto-Encoders (VGAE) [22] is a variational graph auto-encoder with both topology and content information, which introduces the GCN architecture and the graph reconstruction loss to build a graph convolutional auto-encoder network.
-
•
Adversarially Regularized Graph Auto-encoder (ARGA) [23] is a GAN architecture deep clustering model. They firstly construct a graph convolutional auto-encoder network, then the adversarial training principle is applied to enforce the latent codes to match a prior Gaussian or uniform distribution.
-
•
Deep Attentional Embedded Graph Clustering (DAEGC) [24] uses the graph attention network to build the encoder and trains the internal product decoder to reconstruct the graph structure. In addition, soft labels are generated according to the graph embedding to monitor the self-training graph clustering process.
-
•
Structural Deep Clustering Network (SDCN) [26] uses the structure information learned by the GCN module to strengthen the data representation learned by the auto-encoder. Furthermore, it constructs a dual self-supervised loss to combine two networks and supervise clustering, which is an important baseline.
The parameter settings of compared methods are listed below. For K-means, we repeatly run K-means times and report the best result. For AE and IEDC, following the work in [26], the network dimension of each dataset is set as . VGAE is a two-layer network, so we set network dimension of its encoder as , [22]. For ARGA, following the work in [23], we set the dimension of the encoder as , in addition, the discriminator’s dimension is set as . For DAEGC, the dimension of the graph attention encoder is set as , [24]. For SDCN, we set the dimensions of the encoder and GCN module for , [26].
To evaluate all methods from multiple aspects, we choose four popular clustering evaluation metrics, including Accuracy (ACC), Normalized Mutual Information (NMI), Average Rand Index (ARI) and macro F1-score (F1). For all metrics, a higher score indicates a better clustering quality.
IV-C Parameter Settings
When a dataset does not come with graph information, to construct the initial graph of data, we select the popular K-Nearest-Neighbor algorithm (KNN), and the value of is positively correlated with the number of samples and categories. Following the strategy in SDCN [26], we tune different in the range {} to get the best performance. Generally, USPS and HHAR employ and to construct the corresponding graphs, respectively. As for ACM, DBLP, and Citeseer, we directly exploit the existing graphs in the datasets.
In the proposed CaEGCN, we set the dimensions of both CAE and GAE modules as , where and denote the dimension of the raw data, and represents the number of cluster categories. The purpose of the last layer in the decoder is to reconstruct the raw data, so the dimension of the last layer equals to the first layer, i.e., .
In the cross-attention fusion module, we set the number of heads as . In the self-supervised module, the iteration number of K-means is set as to initialize the cluster centers. At last, we employ the Xavier method to initialize our model parameters [41], and the initial learning rate is set as .
IV-D Experiment Results Analysis
Table I exhibits the whole experimental results compared with other clustering methods. Obviously, the proposed CaEGCN model achieves the best performance in most cases.
We can see that the content information based deep clustering methods (such as AE and IEDC) work better than the graph convolutional auto-encoder method VGAE. The reason is that VGAE exists the over-smoothing problem. In other words, the information received by the nodes has a low signal-to-noise ratio. SDCN and the proposed CaEGCN supplement the content information into the GCN module in each layer, which effectively relieves the over-smoothing problem, so SDCN and CaEGCN receive the satisfactory performance.
The experimental results show that SDCN and the CaEGCN are superior to other methods on the whole datasets. Compared with directly using GCN, supplementing the content information into the structure representation layer by layer can help the clustering work better, and it also illustrates the significance of the interaction between the heterogeneous information. In addition, the proposed CaEGCN performs better than SDCN in most cases, which proves that the cross-attention fusion module in CaEGCN can promote the learned data representation containing more prominent information for clustering tasks.
| Dataset | Metric | CaEGCN |
|
|
|
||||||||||||||||||||
|---|---|---|---|---|---|---|---|---|---|---|---|---|---|---|---|---|---|---|---|---|---|---|---|---|---|
| ACM |
|
|
|
|
|
||||||||||||||||||||
| DBLP |
|
|
|
|
|
||||||||||||||||||||
| Citeseer |
|
|
|
|
|
||||||||||||||||||||
| HHAR |
|
|
|
|
|
||||||||||||||||||||
| USPS |
|
|
|
|
|
For the academic papers datasets, various factors interfere the clustering or recognition tasks, such as the cross-domain applications of popular algorithms, different research topics in the same field and different research fields of the same author, and so on. As for the ACM dataset, the CaEGCN achieves the significant improvements in all four evaluation metrics. The accuracy of CaEGCN increases by from compared with SDCN to compared with K-means; The NMI of CaEGCN increases from compared with SDCN to compared with K-means; The ARI of CaEGCN increases by from compared with SDCN to compared with K-means; The F1 score of CaEGCN increases by from compared with SDCN to compared with K-means.
We also note that VGAE has achieved good clustering results, which simultaneously considers the graph topology information and node content of the graph. ARGA uses the adversarial training to optimize the method based on graph convolution, and achieves some improvements. DAEDC uses the graph attention module, and also achieves the better experimental results. The huge gap between the CaEGCN and SDCN (and others) further proves the superiority of the CaEGCN. Similar to the ACM dataset, DBLP and Citeseer are datasets related to academic papers, and their experimental results show the same pattern and trend.
Large scale dataset is an important challenge for clustering methods. When the scale of samples increases, the performance of many state-of-the-art clustering methods drops dramatically. The scale of HHAR and USPS datasets are times larger than the previous datasets.
For the HHAR dataset, it is difficult to distinguish some human daily behaviors, e.g., walking and biking. This imposes a challenge for clustering tasks. Compared with VGAE which integrates the structural features into the content information, the accuracy of the CaEGCN increases by ; compared with ARGA, the accuracy increases by ; and compared with DAEGC, the accuracy increases by . It is our belief that the poor performance of these methods is due to the over-smoothing problem of GCN. The experimental results prove the effectiveness of our cross-attention module. Compared with the best baseline SDCN, the accuracy of CaEGCN still increases by .
For the USPS dataset, its background is simple, so we regard it as a baseline data to test the robustness of the CaEGCN. The experimental results of the CaEGCN, SDCN, and IDEC are similar. This may be caused by the fact that the content information of the some handwritten digit images is difficult to distinct. We emphasize here that each node in the initial graph we constructed can only connect closest nodes when considering efficiency, so the initial graph fails to contain enough valuable relationship between the data. Such a limited graph restricts the learning ability of the convolutional network.
In summary, these performance improvements of the CaEGCN can be attributed to two aspects: first, the cross-attention fusion mechanism integrates the content information and the data relationship, and highlights the critical information in the fusion representations; second, the self-supervised module further optimizes the distributions of the middle layer representations to strengthen the performance of deep clustering.
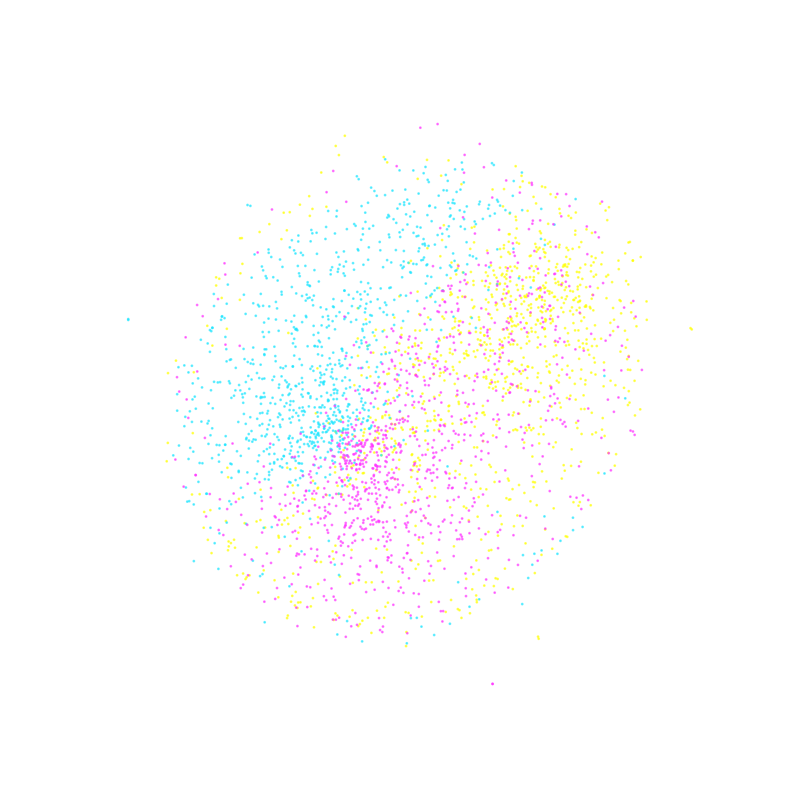
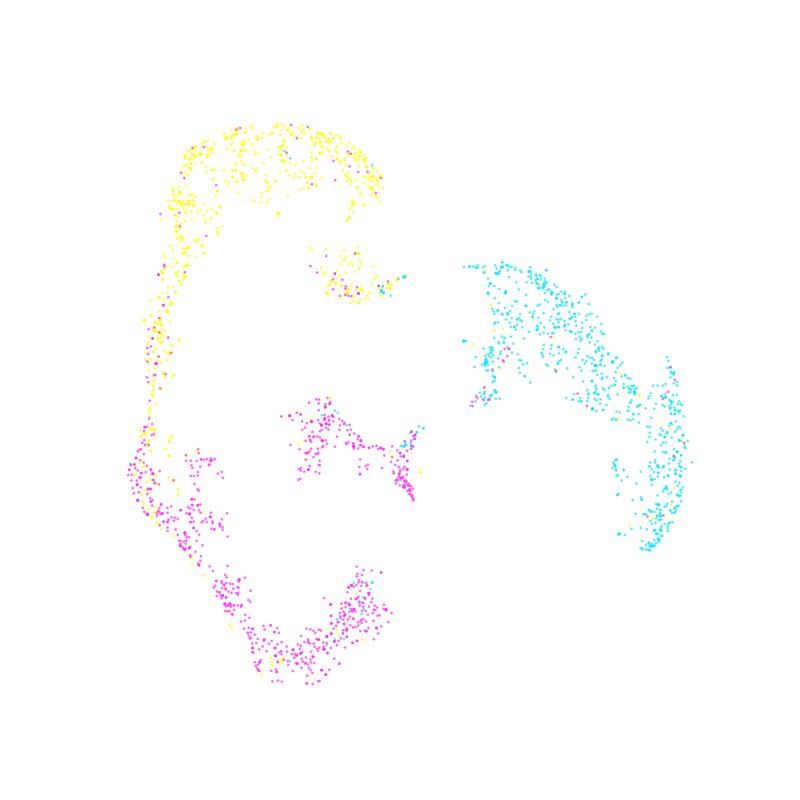
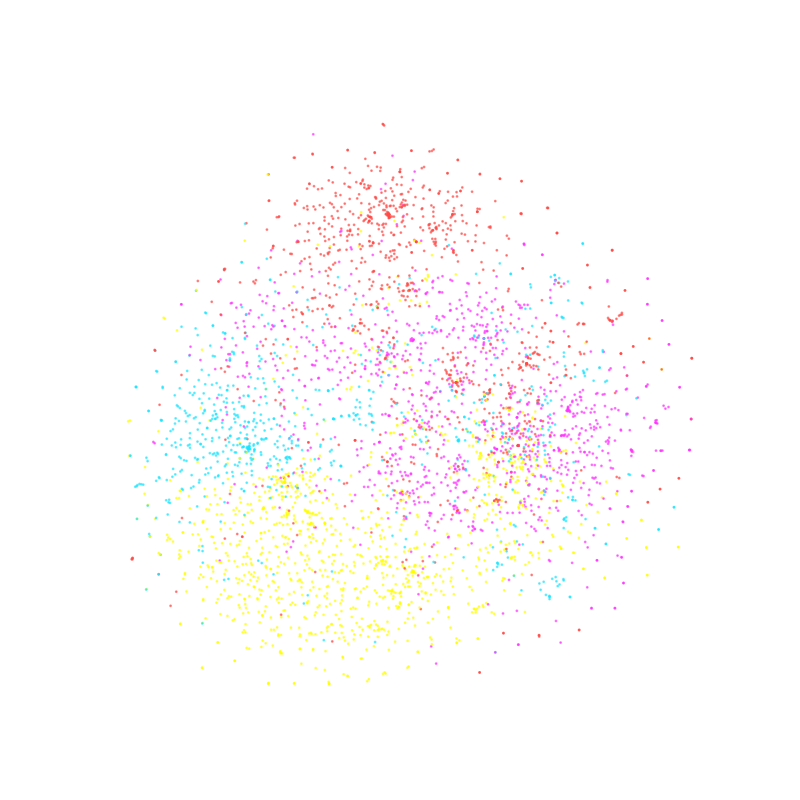
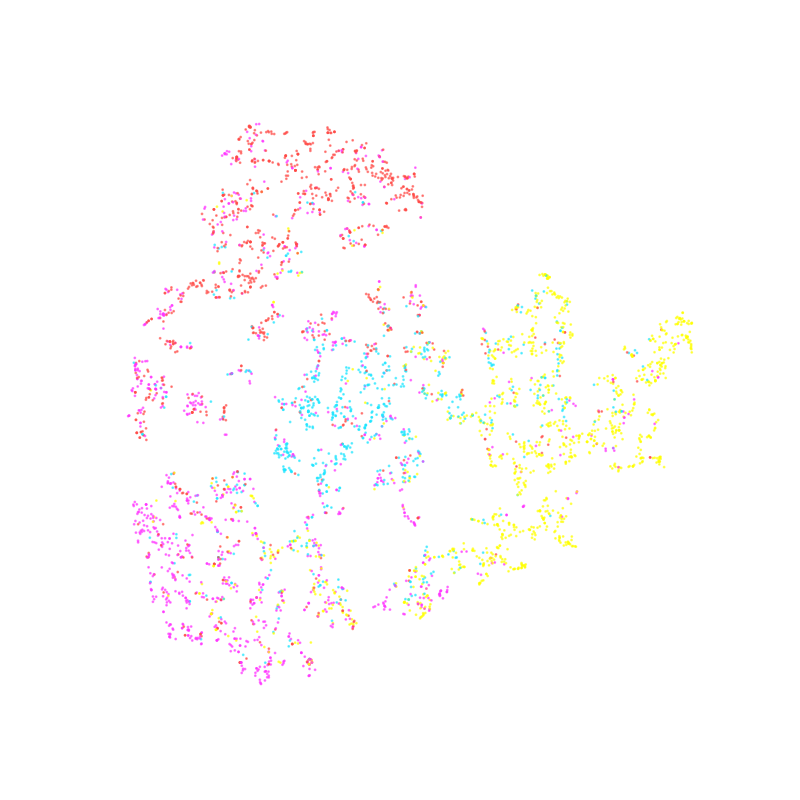
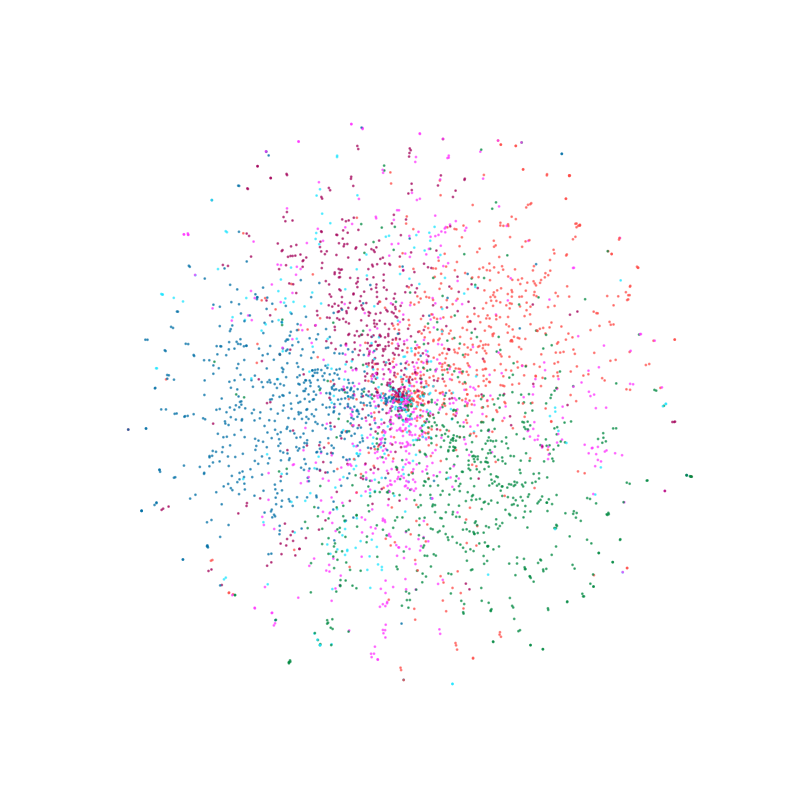
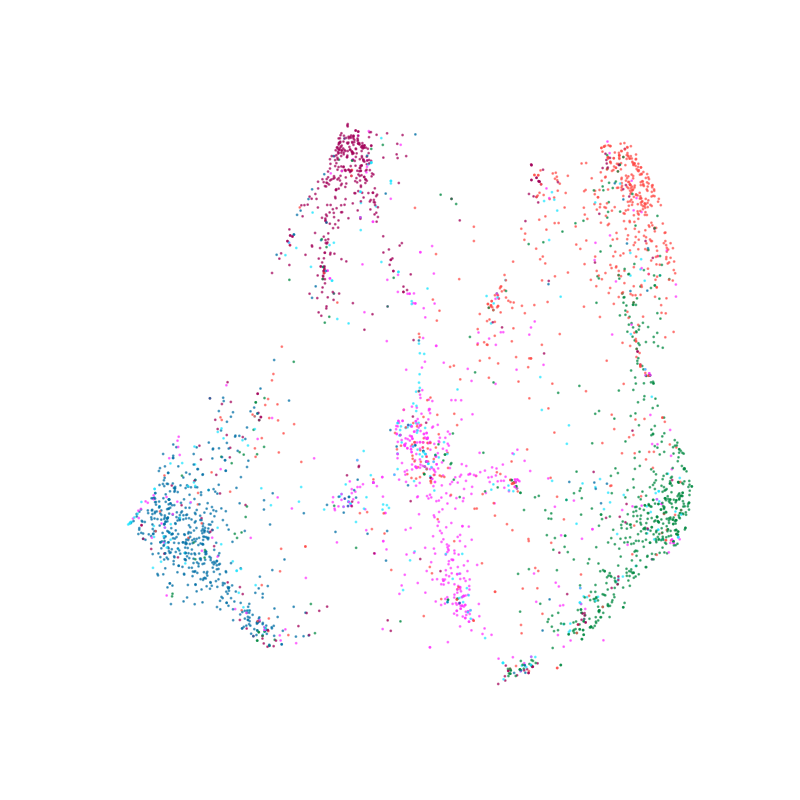
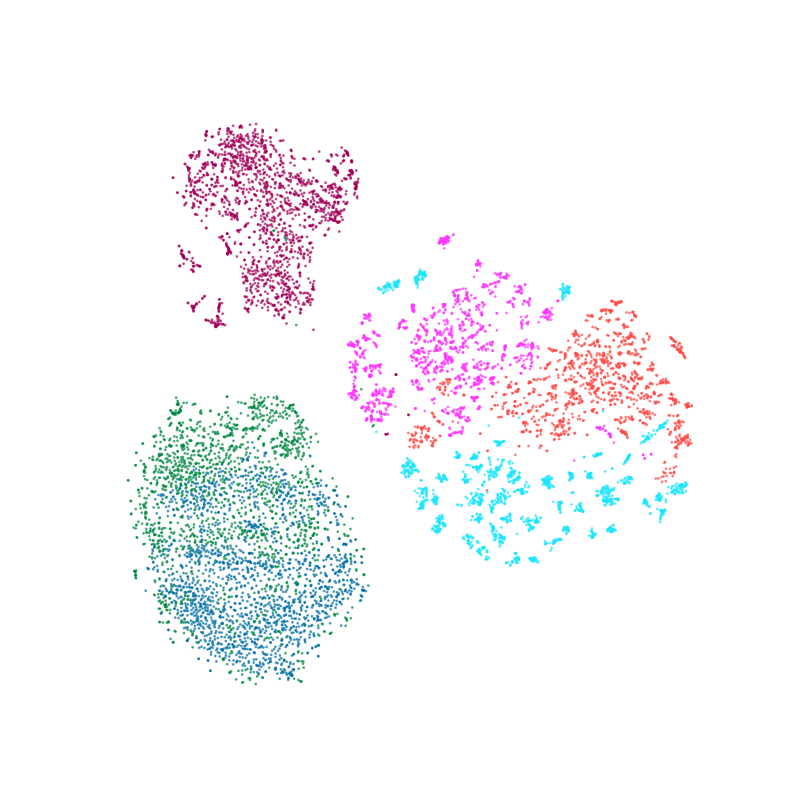
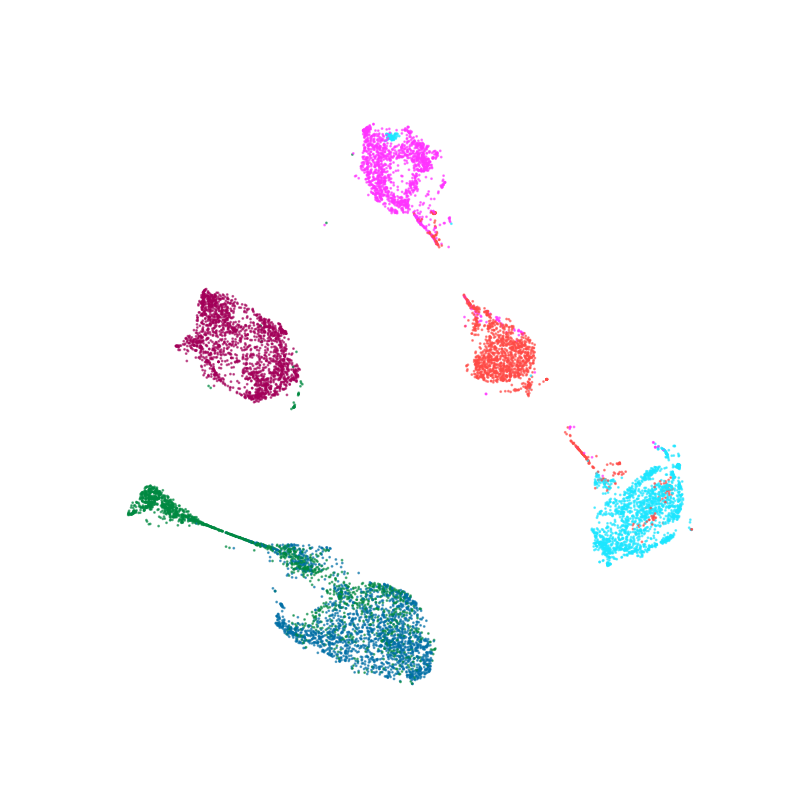
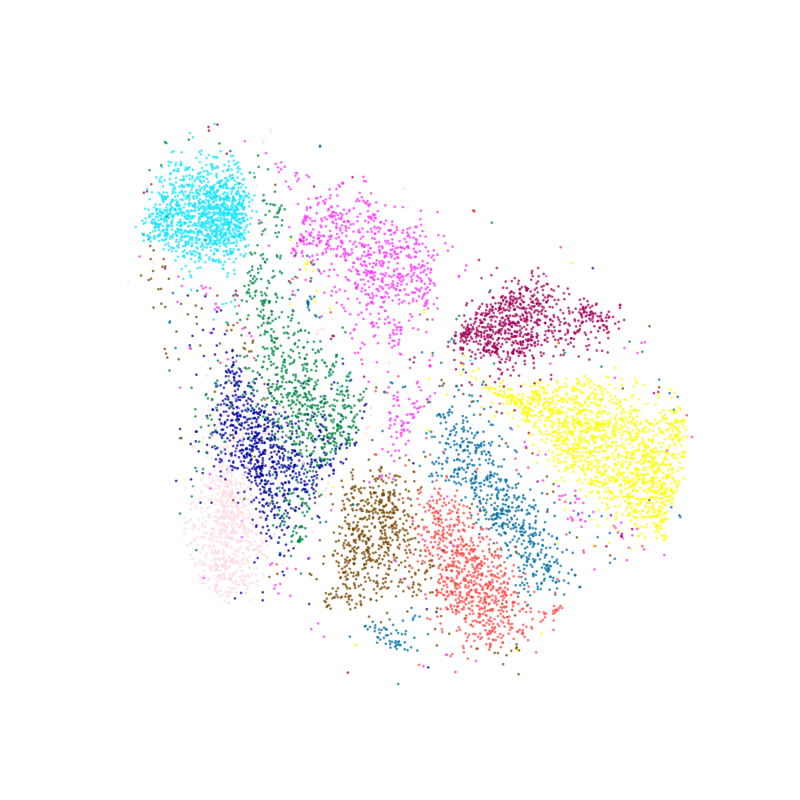
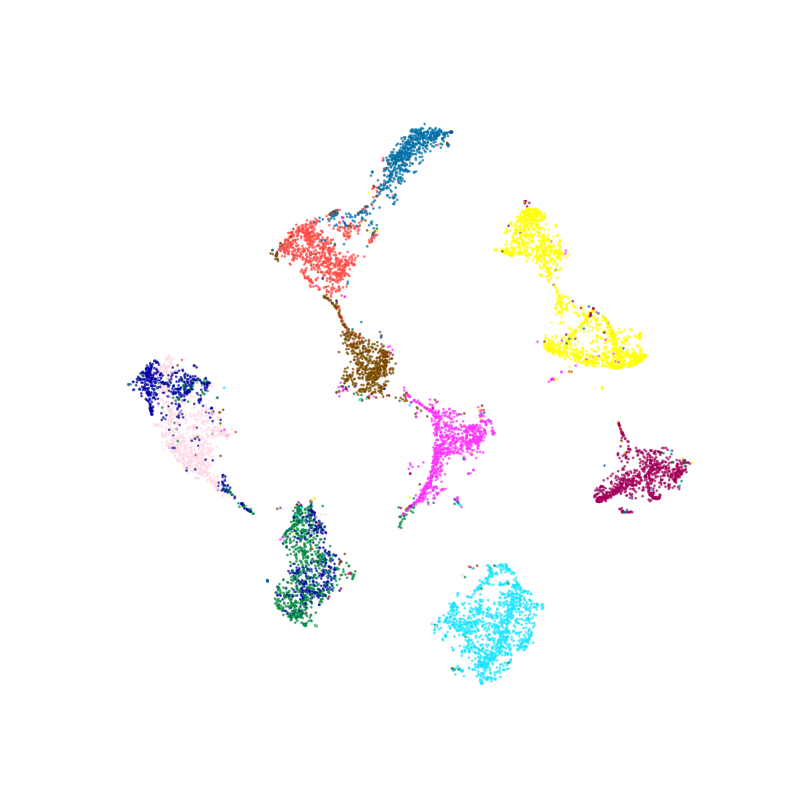
IV-E Clustering Result Visualization
We visualize the clustering results of five datasets in a two-dimensional space with the t-SNE algorithm [37]. The location distribution of the raw data is overlapping, while the CaeGCN can obviously drive the raw data into different groups.
IV-F Ablation Experiment Analysis
To prove the effectiveness of each critical module in our model, we designed a set of ablation experiments. Specifically, we repeatedly remove one module from the CaEGCN model and test the clustering performance of these incomplete models on five datasets. The designed incomplete models are displayed as follow,
-
•
CaEGCN w/o attention: The proposed CaEGCN without the cross-attention fusion module.
-
•
CaEGCN w/o graph: The proposed CaEGCN without the graph reconstruction loss in the GAE module,
(22) -
•
CaEGCN w/o content: The proposed CaEGCN without the content reconstruction loss in the GAE module,
(23)
From Table II, we observe that the CaEGCN still achieves the best results on all datasets. The clustering results of the above three incomplete models decline, which verifies the importance of each critical module.
Among them, the experimental results of CaEGCN w/o attention drop sharply, which proves that the lack of the content and data relationship fusion can decrease the learning ability of the GAE module.
Without the graph reconstruction loss , the clustering performance of CaEGCN w/o graph still decrease obviously. This reconstruction loss ensures the learned middle layer representations have abundant structure information, which improves the clustering performance. Meanwhile, the experimental results of the CaEGCN w/o graph on the datasets using the original graph (e.g., ACM, DBLP) significantly decrese, which reflects that the graph reconstruction loss can effectively improve the quality of data representations with the accurate graph structure.
As for CaEGCN w/o content, its experimental results are not bad. Compared with other two modules, the impact of content reconstruction loss is relatively small. However, we believe that content reconstruction loss is also indispensable. The CAE module likes a residual network to supplement the high-quality content information to the GAE module layer-by-layer. Then, the content reconstruction loss ensures the middle layer representation learned by the GAE module contains more content information of the raw data.
Throughout these three ablation experiments, it turns out that each module improves the clustering performance from different aspects and is meaningful.
V Conclusion
We propose a cross-attention fusion based enhanced graph convolutional network for subspace clustering (CaEGCN), which connects the CAE and GAE modules layer-by-layer through the cross-attention fusion module, and strengthens the essential information. The fusion representation is used as the input of the GAE module. The novel graph reconstruction loss and content reconstruction loss in the GAE module further ensure the middle layer representation more appropriate for clustering. Finally, we build the self-supervised module to train the entire end-to-end model. The excellent experimental results on various datasets prove the superiority of the proposed methods.
Acknowledgements
The research project is partially supported by National Natural Science Foundation of China under Grant No. U19B2039, 61906011, 61632006, 61772048, 61672071, U1811463, 61806014, Beijing Natural Science Foundation No. 4204086, Beijing Municipal Science and Technology Project No. KM202010005014, KM201910005028, Beijing Talents Project (2017A24), Beijing Outstanding Young Scientists Projects (BJJWZYJH01201910005018).
References
- [1] G. Hinton and R. Salakhutdinov, “Reducing the dimensionality of data with neural networks,” Science, vol. 313, no. 5786, pp. 504–507, 2006.
- [2] J. Xie, R. Girshick, and A. Farhadi, “Unsupervised deep embedding for clustering analysis,” in International Conference on Machine Learning, 2016.
- [3] P. Ji, T. Zhang, H. Li, M. Salzmann, and I. D. Reid, “Deep subspace clustering networks,” in Neural Information Processing Systems, 2017.
- [4] X. Guo, L. Gao, X. Liu, and J. Yin, “Improved deep embedded clustering with local structure preservation,” in International Joint Conference on Artificial Intelligence, 2017.
- [5] J. B. Macqueen, “Some methods for classification and analysis of multivariate observations,” Fifth Berkeley Symposium on Mathematical Statistics and Probability, pp. 281–297, 1967.
- [6] S. S. Tabatabaei, M. Coates, and M. Rabbat, “GANC: Greedy agglomerative normalized cut for graph clustering,” Pattern Recognition, vol. 45, no. 2, pp. 831–843, 2012.
- [7] M. Girvan and M. E. J. Newman, “Community structure in social and biological networks,” Proceedings of the National Academy of Sciences, vol. 99, no. 12, pp. 7821–7826, 2002.
- [8] P. Veličković, G. Cucurull, A. Casanova, A. Romero, P. Liò, and Y. Bengio, “Graph attention networks,” in International Conference on Learning Representations, 2018.
- [9] J. Zhang, F. Chen, Y. Guo, and X. Li, “Multi-graph convolutional network for short-term passenger flow forecasting in urban rail transit,” IET Intelligent Transport Systems, vol. 14, no. 10, pp. 1210 – 1217, 2020.
- [10] B. Perozzi, R. Al-Rfou, and S. Skiena, “Deepwalk: online learning of social representations,” in ACM SIGKDD International Conference on Knowledge Discovery and Data Mining, 2014, pp. 701–710.
- [11] A. Grover and J. Leskovec, “Node2vec: Scalable feature learning for networks,” in ACM SIGKDD International Conference on Knowledge Discovery and Data Mining, vol. 2016, 2016, pp. 855–864.
- [12] J. Tang, M. Qu, M. Wang, M. Zhang, J. Yan, and Q. Mei, “LINE: Large-scale information network embedding,” in International Conference on World Wide Web, 2015, pp. 1067–1077.
- [13] M. Defferrard, X. Bresson, and P. Vandergheynst, “Convolutional neural networks on graphs with fast localized spectral filtering,” in Neural Information Processing Systems, 2016.
- [14] J. Bruna, W. Zaremba, A. Szlam, and Y. LeCun, “Spectral networks and locally connected networks on graphs,” in International Conference on Learning Representations, 2014.
- [15] T. Kipf and M. Welling, “Semi-supervised classification with graph convolutional networks,” in International Conference on Learning Representations, 2017.
- [16] L. Zhao, Y. Song, C. Zhang, Y. Liu, P. Wang, T. Lin, M. Deng, and H. Li, “T-GCN: A temporal graph convolutional network for traffic prediction,” IEEE Transactions on Intelligent Transportation Systems, vol. 21, no. 9, pp. 3848–3858, 2020.
- [17] S. Yan, Y. Xiong, and D. Lin, “Spatial temporal graph convolutional networks for skeleton-based action recognition.” in AAAI Conference on Artificial Intelligence, 2018, pp. 7444–7452.
- [18] S. Sanyal, I. Anishchenko, A. Dagar, D. Baker, and P. Talukdar, “ProteinGCN: Protein model quality assessment using graph convolutional networks,” bioRxiv, 2020.
- [19] W. L. Hamilton, R. Ying, and J. Leskovec, “Inductive representation learning on large graphs,” in Neural Information Processing Systems, 2017.
- [20] H. Wang, J. Wang, J. Wang, M. Zhao, W. Zhang, F. Zhang, X. Xing, and M. Guo, “GraphGAN: Graph representation learning with generative adversarial nets,” in AAAI Conference on Artificial Intelligence, 2018.
- [21] Z. Wu, S. Pan, F. Chen, G. Long, C. Zhang, and P. S. Yu, “A comprehensive survey on graph neural networks,” IEEE Transactions on Neural Networks and Learning System, 2020.
- [22] T. Kipf and M. Welling, “Variational graph auto-encoders,” NIPS Workshop on Bayesian Deep Learning, 2016.
- [23] S. Pan, R. Hu, S.-F. Fung, G. Long, J. Jiang, and C. Zhang, “Learning graph embedding with adversarial training methods,” IEEE Transactions on Systems, Man, and Cybernetics, vol. 50, no. 6, pp. 2475–2487, 2020.
- [24] C. Wang, S. Pan, R. Hu, G. Long, J. Jiang, and C. Zhang, “Attributed graph clustering: a deep attentional embedding approach,” in International Joint Conference on Artificial Intelligence, 2019, pp. 3670–3676.
- [25] X. Li, H. Zhang, and R. Zhang, “Embedding graph auto-encoder with joint clustering via adjacency sharing.” arXiv:2002.08643, 2020.
- [26] D. Bo, X. Wang, C. Shi, M. Zhu, E. Lu, and P. Cui, “Structural deep clustering network,” in The Web Conference, 2020.
- [27] A. Vaswani, N. Shazeer, N. Parmar, J. Uszkoreit, L. Jones, A. N. Gomez, L. Kaiser, and I. Polosukhin, “Attention is all you need,” in Neural Information Processing Systems, 2017.
- [28] G. Tang, M. Müller, A. R. Gonzales, and R. Sennrich, “Why self-attention? a targeted evaluation of neural machine translation architectures,” in Empirical Methods in Natural Language Processing, 2018.
- [29] J. Fu, J. Liu, H. Tian, Y. Li, Y. Bao, Z. Fang, and H. Lu, “Dual attention network for scene segmentation,” in International Conference on Computer Vision and Pattern Recognition, 2019.
- [30] K. Xu, J. Ba, R. Kiros, K. Cho, A. Courville, R. Salakhudinov, R. Zemel, and Y. Bengio, “Show, attend and tell: Neural image caption generation with visual attention,” in International Conference on Machine Learning, 2015.
- [31] J. Cheng, L. Dong, and M. Lapata, “Long short-term memory-networks for machine reading,” in Conference on Empirical Methods in Natural Language Processing, 2016.
- [32] H. Zhang, I. Goodfellow, D. Metaxas, and A. Odena, “Self-attention generative adversarial networks,” in International Conference on Machine Learning, 2019.
- [33] X. Wang, Z. Tu, L. Wang, and S. Shi, “Self-attention with structural position representations,” in Conference on Empirical Methods in Natural Language Processing, 2019.
- [34] A. Yu, D. Dohan, M. Luong, R. Zhao, K. Chen, M. Norouzi, and Q. Le, “QANet: Combining local convolution with global self-attention for reading comprehension,” in International Conference on Learning Representations, 2018.
- [35] H. Xue, C. Liu, F. Wan, J. Jiao, X. Ji, and Q. Ye, “DANet: Divergent activation for weakly supervised object localization,” in International Conference on Computer Vision, 2019.
- [36] A. Grigor’yan, Heat Kernel and Analysis on Manifolds. American Mathematical Society / International Press, 2012.
- [37] L. van der Maaten and G. Hinton, “Visualizing data using t-SNE,” Journal of Machine Learning Research, vol. 9, no. 86, pp. 2579–2605, 2008.
- [38] M. Ley, “DBLP: some lessons learned,” Proceedings of the VLDB Endowment, vol. 2, no. 2, pp. 1493–1500, 2009.
- [39] A. Stisen, H. Blunck, S. Bhattacharya, T. Prentow, M. Kjærgaard, A. Dey, T. Sonne, and M. Jensen, “Smart devices are different: Assessing and mitigatingmobile sensing heterogeneities for activity recognition,” in ACM Conference on Embedded Networked Sensor Systems, 2015.
- [40] Y. LeCun, Y. Bengio, and G. Hinton, “Deep learning,” Nature, vol. 521, no. 7553, pp. 436–444, 2015.
- [41] X. Glorot and Y. Bengio, “Understanding the difficulty of training deep feedforward neural networks,” in International Conference on Artificial Intelligence and Statistics, 2010.
![[Uncaptioned image]](/html/2101.06883/assets/x1.png) |
Guangyu Huo received the B.Sc. degree in IoT Engineering and the M.S. degree in Computer Science from Beijing University of Technology, China in 2016 and 2019, where he is currently working toward the PhD. degree in Control Science and Engineering. His current research interests include intelligent transportation, computer vision, pattern recognition and deep learning. |
![[Uncaptioned image]](/html/2101.06883/assets/x2.png) |
Yong Zhang (M’12) received the Ph.D. degree in computer science from the BJUT, in 2010. He is currently an Associate Professor in computer science in BJUT. His research interests include intelligent transportation system, big data analysis and visualization, computer graphics. |
![[Uncaptioned image]](/html/2101.06883/assets/x3.png) |
Junbin Gao graduated from Huazhong University of Science and Technology (HUST), China in 1982 with a BSc in Computational Mathematics and obtained his PhD from Dalian University of Technology, China in 1991. He is Professor of Big Data Analytics in the University of Sydney Business School at the University of Sydney and was a Professor in Computer Science in the School of Computing and Mathematics at Charles Sturt University, Australia. He was a senior lecturer, a lecturer in Computer Science from 2001 to 2005 at the University of New England, Australia. From 1982 to 2001 he was an associate lecturer, lecturer, associate professor, and professor in Department of Mathematics at HUST. His main research interests include machine learning, data analytics, Bayesian learning and inference, and image analysis. |
![[Uncaptioned image]](/html/2101.06883/assets/x4.png) |
Boyue Wang received the B.Sc. degree in Computer Science from Hebei University of Technology, China in 2012 and obtained PhD from Beijing University of Technology, China in 2018. He is a postdoctor in the Beijing Municipal Key Laboratory of Multimedia and Intelligent Software Technology, Beijing University of Technology, Beijing. His current research interests include computer vision, pattern recognition, manifold learning and kernel methods. |
![[Uncaptioned image]](/html/2101.06883/assets/x5.png) |
Yongli Hu received his Ph.D. degree from Beijing University of Technology in 2005. He is a professor in the Faculty of Information Technology at Beijing University of Technology. He is a researcher at the Beijing Municipal Key Laboratory of Multimedia and Intelligent Software Technology. His research interests include computer graphics, pattern recognition and multimedia technology. |
![[Uncaptioned image]](/html/2101.06883/assets/x6.png) |
Baocai Yin received his Ph.D. degree from Dalian University of Technology in 1993. He is a professor in the Faculty of Information Technology at Beijing University of Technology. He is a researcher at the Beijing Municipal Key Laboratory of Multimedia and Intelligent Software Technology. He is a member of China Computer Federation. His research interests cover multimedia, multifunctional perception, virtual reality and computer graphics. |