Anisotropic dielectric functions, band-to-band transitions, and critical points in -Ga2O3
Abstract
We use a combined generalized spectroscopic ellipsometry and density functional theory approach to determine and analyze the anisotropic dielectric functions of an -Ga2O3 thin film. The sample is grown epitaxially by plasma-assisted molecular beam epitaxy on -plane sapphire. Generalized spectroscopic ellipsometry data from multiple sample azimuths in the spectral range from 0.73 eV to 8.75 eV are simultaneously analyzed. Density functional theory is used to calculate the valence and conduction band structure. We identify, for the indirect-bandgap material, two direct band-to-band transitions with -type van Hove singularities for polarization perpendicular to the axis, eV and eV, and one direct band-to-band transition with -type van Hove singularity for polarization parallel with eV. We further identify excitonic contributions with small binding energy of 7 meV associated with the lowest ordinary transition, and a hyperbolic exciton at the -type critical point with large binding energy of 178 meV.
Ga2O3 has received recent research interest as an ultra-wide bandgap semiconductor due to a predicted breakdown electric field more than double of SiC and GaN.Higashiwaki and Jessen (2018) Of the five polymorphs of Ga2O3 (, , , , and )Roy, Hill, and Osborn (1952), the metastable form of -Ga2O3 has been of recent interest because it can be formed and stabilized using heteroepitaxial growth on sapphire (-Al2O3) substrates at low-temperatures.Shinohara and Fujita (2008) -Ga2O3 is thus of interest because it can be grown on widely available substrates, such as synthetic sapphire. Furthermore, it has a more favorable symmetry (rhombohedral, , space group 167) than the thermodynamically stable version -Ga2O3 (monoclinic) which may result in simpler device design and more reliable performance characteristics. Knowledge of band structure properties and band-to-band transitions is of fundamental importance for potential application in semiconductor devices. Optical investigations permit access to direct fundamental bandgap and higher-energy transitions, including their polarization characteristics, in optically uniaxial semiconductors for electric field directions parallel (, extraordinary direction) and perpendicular (, ordinary direction) to the lattice axis. Multiple studies have been performed to identify the bandgap energies and parameters for optical transitions in -Ga2O3 and consistent answers have not yet emerged. Sinha et al. studied -Ga2O3 nanocrystalline thin films obtained with the sol-gel technique and estimated an isotropically polarization averaged bandgap of 4.98 eV using transmission measurements.G. Sinha (2005) Shinohara et al. estimated a bandgap energy of 5.3 eV from transmission measurements of heteroepitaxially grown -Ga2O3 thin films using ultrasonic mist chemical vapor deposition.Shinohara and Fujita (2008) Roberts et al. reported an optical bandgap between 5.15 5.2 eV from transmission measurements for -Ga2O3 thin films grown using low temperature plasma-enhanced atomic layer deposition.Roberts et al. (2019) Segura et al. reported near-bandgap spectral range transmission intensity and reflection-type spectroscopic ellipsometry measurements on -plane -Ga2O3 thin films deposited by ultrasonic mist chemical vapor phase epitaxy.Segura et al. (2017) Two prominent absorption peaks were identified for the ordinary direction and ascribed to allowed direct transitions from crystal-field split valence bands to the same conduction band. Excitonic effects with large Gaussian broadening were modelled using the Elliott-Toyozawa approach,Elliott (1957); Toyozawa (1958) but due to large broadening the available data was too limited in spectral range ( 6.5 eV) to make decisive conclusions about the nature of the band-to-band transitions in -Ga2O3. A large exciton binding energy of 110 meV was suggested and band-to-band transitions of =5.61 eV and =6.44 eV were reported. Kracht et al. investigated -plane oriented -Ga2O3 thin films grown by plasma-assisted molecular beam epitaxy (PAMBE).Kracht et al. (2018) In this crystallographic orientation, the lattice direction is not parallel to the thin film normal and sensitivity to and can be obtained by aligning the sample once with the axis and once with the direction parallel to the plane of incidence, respectively. An ad-hoc lineshape analysis approach suggested band-to-band transition energies of =5.62 eV and =5.58 eV. could only be guessed within 6.18 6.52 eV. Exciton binding energies were found to be 38 meV for both directions. The high frequency dielectric constants were extrapolated to =3.75 and =3.64. Feneberg et al. performed an ultra wide range spectroscopic ellipsometry study from the infrared (40 meV) to the vacuum ultra violet (20 eV) on -plane oriented -Ga2O3 thin films.Feneberg et al. (2018) This work found =5.8 eV, and was not observed. A higher energy transition was observed at =11.1 eV. Feneberg et al. measured and in the infrared spectral regions on -plane -Ga2O3 thin films grown by mist chemical vapor epitaxy. The authors performed phonon mode analysis and reported 5 out of 6 infrared active modes. Using the approach described in Ref. Kasic et al., 2000 the authors determined the conduction band effective mass parameters of = (0.2970.010) and = (0.3160.007).Feneberg et al. (2019) A first-principles density functional theory (DFT) all-electron basis calculation was reported by He et al. presenting dielectric function, reflectance, and energy-loss function up to 50 eV, and an electron effective mass parameter (=0.276).He et al. (2006) Litimein et al. employed full-potential linearized augmented plane-wave method and reported density of states and anisotropic dielectric function of -Ga2O3.Litimein et al. (2009) Furthmüller and Bechstedt used a DFT approach and Bethe-Salpeter equation calculations and presented band structure, density of states and anisotropic dielectric functions, and reported a bandgap of 5.63 eV.Furthmüller and Bechstedt (2016) Bechstedt and Furthmüller calculated the effective mass anisotropy and predicted an isotropically averaged exciton binding energy of 184 meV.Bechstedt and Furthmüller (2019)
Direct band-to-band transitions cause critical point (CP) structures in the dielectric functions, , which possess unique frequency characteristics depending on the type of the associated singularity in the combined density of states (van Hove singularity).Yu and Cardona (1999) Crucial for accurate lineshape analysis of is detailed knowledge of band structure properties. Furthermore, band-to-band transitions are accompanied by excitonic contributions, which also depend on the behavior of the participating bands.Yu and Cardona (1999) A lineshape analysis using CP structures and comparison with band structure calculations has not previously been performed for -Ga2O3 and is reported here using results of a combined generalized spectroscopic ellipsometry (GSE) and DFT analysis approach. In our sample the axis is parallel to the surface and permits accurate measurements of and from simultaneous analysis of data measured at multiple sample azimuths in the spectral range from 0.73 eV to 8.75 eV. We perform DFT calculations and obtain the valence and conduction band structure in -Ga2O3, which indicate an indirect-bandgap material. We further identify the origins of the singularities in the combined density of states, which lead to -type CP structures at the band-to-band transitions in , and to one -type CP structure in . We identify excitons with small binding energy associated with the -type transitions, and hyperbolic excitonsShinada and Sugano (1966); Yu and Cardona (1999) with large exciton binding energy for the -type transition. We compare and discuss our findings with previous observations. We provide complete parameter sets for which will become useful for ellipsometric model analysis of heterostructures containing -Ga2O3 thin films.
DFT calculations were performed using the plane-wave code Quantum ESPRESSO[QuantumESPRESSOisavailablefromhttp://www.quantum-espresso.org.Seealso:]GiannozziJPCM2009QE with a combination of generalized-gradient-approximation (GGA) density functional of Perdew, Burke and ErnzerhofPerdew, Burke, and Ernzerhof (1996) and norm-conserving Troullier-Martins pseudopotentials originally generated using FHI98PPFuchs and Scheffler (1999); Troullier and Martins (1991) available in the Quantum ESPRESSO pseudopotentials library. The pseudopotential for gallium did not include the semicore states in the valence configuration. All calculations were performed with a high electronic wavefunction cutoff of 400 Ry. As the starting point we used structural parameters from the Materials Project.Jain et al. (2013); ost The calculations were performed in a rhombohedral cell:
where and are parameters of the hexagonal cell. The initial structure was first relaxed to force levels less than 10-6 Ry Bohr-1. A dense shifted Monkhorst-PackMonkhorst and Pack (1976) grid was used for sampling of the Brillouin zone and a convergence threshold of Ry was used to reach self-consistency. The lattice parameters for the fully relaxed structure were Å and Å, similar to the values reported in the literature at the DFT/GGA level.Furthmüller and Bechstedt (2016) In order to improve the quality of the DFT pseudo-wavefunction and bring the value of the bandgap closer to the experimentally measured one, we performed additional calculations using the hybrid Gau-PBESong, Yamashita, and Hirao (2011); Song et al. (2013) density functional. All the hybrid calculations were performed at the PBE equilibrium geometry using a regular non-shifted Monkhorst-Pack grid for the Brillouin zone sampling and grid for sampling of the Fock operator. The convergence threshold for self-consistency in hybrid functional calculations was Ry.
In order to study the band structure we used the band interpolation method based on the maximally localized Wannier functionsMarzari and Vanderbilt (1997); Souza, Marzari, and Vanderbilt (2001) as implemented in the software package WANNIER90Mostofi et al. (2008). The initial projectors for the Wannier functions were automatically generated using the selected columns of the density matrix (SCDM)Vitale et al. (2020) method. For -Ga2O3 the lowest four conduction bands are not entangled with higher conduction bands allowing us to treat the valence band and the four lowest conduction bands together as an isolated system. As a result of the wannierisation procedure, with the convergence threshold set at Å2, we obtained a set of 28 maximally localized Wannier functions with an average spread of 1.03 Å2. These were then used to obtain a high resolution interpolated band structure. Finally, the allowed optical transitions at the Brillouin zone center were obtained by extracting matrix elements of the momentum operator between the valence and conduction bands, . All non-trivial values of the matrix elements in the energy range below 10 eV are listed in Table LABEL:Tab:DFT.
Heteroepitaxial -Ga2O3 films were grown on polished -plane -Al2O3 substrates at thermocouple substrate temperature () of 650 ∘C using PAMBE. Substrates received an oxygen plasma treatment prior to growth in the chamber at = 800 ∘C for 10 min. During deposition, an oxygen flow rate of 0.5 sccm was introduced to create active oxygen species using a radio frequency plasma source (RFpower = 250 W). Pressure was maintained during the growth process at 10-5 Torr. The epitaxial layer thickness was determined to be 51.8 nm from x-ray reflectivity measurements. Atomic force microscopy indicated a small root mean square roughness of 0.96 nm. The -Ga2O3 film was determined to be completely lattice-relaxed by asymmetrical reciprocal space map analysis. Growth and structural characterization are discussed in further detail by Jinno et al.Jinno et al. (2020)
Measurements of GSE data were performed at ambient temperature for the spectral range of 0.73 to 8.75 eV. A dual-rotating compensator ellipsometer (RC2, J. A. Woollam Co., Inc.) was used to acquire data in the spectral range of 0.73 eV to 6.42 eV at three angles of incidence ( = 50∘, 60∘, 70∘) for a full azimuthal rotation in steps of 15∘. A rotating-analyzer ellipsometer with an automated compensator function (VUV-VASE, J.A. Woollam Co., Inc.) to measure data in the vacuum-ultra-violet (VUV) spectral region. The VUV-VASE measured data for the 5 eV to 8.75 eV spectral region with a spectral resolution equal to 0.04 eV. Data was acquired at three angles of incidence ( = 50∘, 60∘, 70∘), and at azimuthal rotations in steps of 45∘.
We model the optical properties of -Ga2O3 using a uniaxial dielectric tensor with two major dielectric functions, , and . To account for nanoscale thin film surface roughness, an effective medium approximation is applied with an ultra thin optical layer above -Ga2O3. An isotropic average of and is weighted with 50 void (=1).Fujiwara (2007) Then a Cauchy dispersion equation is used to approximate and in the below-bandgap region to determine the thickness of the roughness overlayer, the -Ga2O3 thickness, and the Euler angles for the sample which determine the orientation of , common to both thin film and substrate, during each experiment. These values are then fixed for the remainder of the analysis. The Cauchy equation is applied in the transparent region ( 4.5 eV) where negligible absorption does not affect the GSE data. Then, a point-by-point (PBP) regression analysis is performed for the full data set to determine simultaneously and . Initially, -plane sapphire is analyzed to provide accurate optical constants of -Al2O3 for our subsequent analysis of -Ga2O3. Harman et al. determined the anisotropic optical constants of sapphire using spectroscopic ellipsometry in the spectral range of 0 to 30 eV. They found a fundamental absorption edge at 9 eV and determined = 3.064 and = 3.038.Harman, Ninomiya, and Adachi (1994) This is in excellent agreement with our experimental results of = 3.068 and = 3.042.
A CP model dielectric function (MDF) approach is used to analyze and . As will be discussed below, we find that the two lowest transitions found in each require a -type CP structureYu and Cardona (1999); Schubert et al. (1999); tom (2012)
| (1) |
| (2) |
where , , and , respectively, denote CP amplitude, transition energy, and broadening parameter, and is the photon energy. For the lowest transition in , a -type CP structure is neededStrössner, Ves, and Cardona (1985); tom (2012)
| (3) |
This CP structure represents a van Hove singularity where the joint density of states reflects a saddle point with one of the combined effective mass parameters negative, or approaching zero.Strössner, Ves, and Cardona (1985) For the two lowest transitions in both and , we observe strong excitonic contributions. We describe these with an anharmonically broadened Lorentz oscillator
| (4) |
where denotes the anharmonic broadening parameter.Mock et al. (2019a),111A detailed discussion of the presentation of the anharmonically broadened oscillator form suggested by Gervais and Piriou in Ref. Gervais and Piriou, 1974 and the form suggested by Mock et al. in Ref. Mock et al., 2019a has yet to appear in the literature. Briefly, simple mathematical transformations proof that both forms are identical. The advantage of the latter form, Eq. 4 in this paper, is that it can be added to a sum of model contributions to the dielectric function, while the former must be brought into a product form considerably complicating the regression calculations. We note that excitonic contributions to the -CP are interpreted as due to ground state contributions from three-dimensional effective hydrogen atom-like excitons, while excitonic contributions to the -CP are interpreted as two-dimensional effective hydrogen atom-like (a.k.a. hyperbolic) excitons.Shinada and Sugano (1966); Yu and Cardona (1999) The Tanguy-Elliott model,Elliott (1957); Tanguy (1995) which also includes exciton continuum states, did not suffice to provide a good match to our experimental data and was therefore not used. CP contributions from transitions at higher energies often contain contributions from multiple, neighboring energy transitions within the Brillouin zone which thus appear broadened and difficult to differentiate. We use a Gaussian broadened oscillator here for the imaginary () part
| (5) |
| (6) |
| (7) |
| Label | (eV) | (/Bohr)2 | ||
| + | 5.250 | 0.24110 | 1 | 1,2 |
| + | 6.052 | 0.22577 | 1 | 8,9 |
| + | 8.953 | 0.00412 | 1 | 11,12 |
| + | 9.064 | 0.01284 | 2 | 4,5 |
| + | 9.309 | 0.06575 | 2 | 6,7 |
| + | 9.468 | 0.45691 | 3 | 4,5 |
| + | 9.713 | 0.00276 | 3 | 6,7 |
| 5.266 | 0.20734 | 1 | 3 | |
| 9.067 | 0.00718 | 1 | 13 |
| Band index | |||
|---|---|---|---|
| 0.28 | 0.29 | 0.28 | |
| 0.70 | 5.6 | 0.51 | |
| 2.4 | 5.6 | >10 | |
| 3.2 | -0.27 | 1.4 | |
| -5.7 | -0.18 | -0.90 | |
| -0.23 | -0.18 | -0.38 |
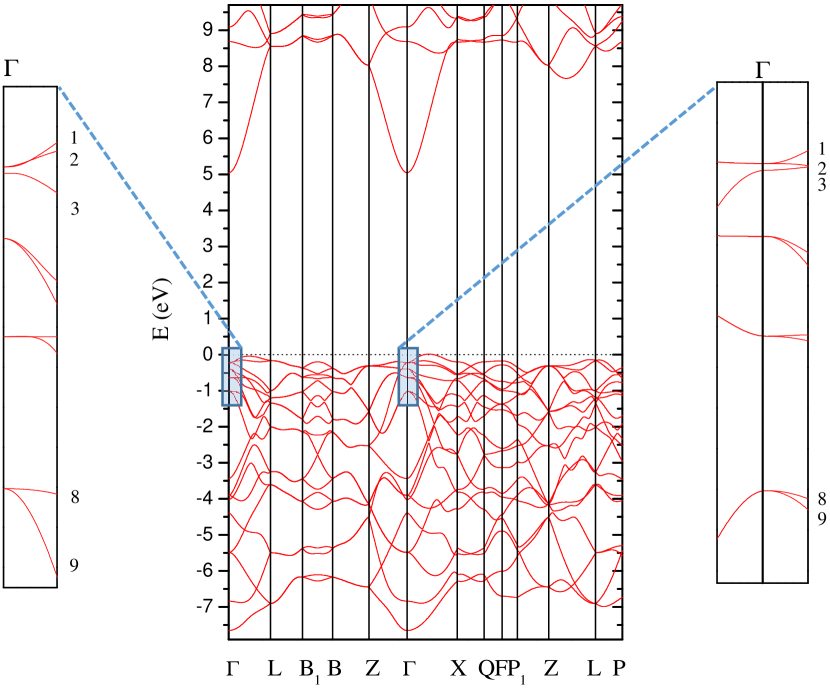
Figure 1 depicts the band structure of -Ga2O3 obtained from our DFT calculations using the hybrid density functional described above. -Ga2O3 is indirect, with valence band maximum outside of the zone center. Table LABEL:Tab:DFT lists Gau-PBE hybrid functional obtained band-to-band transitions in the lowest energy region along with the transition matrix elements and bands involved. Two transitions nearly equal in amplitude are found for polarization perpendicular to the axis at 5.25 eV and 6.052 eV, and one for polarization parallel at 5.266 eV. The two lowest transitions involve different valence bands. A pronounced group of transitions is noted at approximately 9 eV for , and a rather weak transition in this range for . In Table LABEL:tab:mass we list the direction dependent effective mass parameters for all conduction and valence bands involved in the lowest three transitions. The effective mass parameters were obtained by fitting a second degree polynomial to the respective bands in the range of 0.01 Å-1 from the -point. We note that our conduction band parameters (=0.28, =0.29) are in good agreement with data reported by Feneberg et al.Feneberg et al. (2019) When calculating the reduced mass parameters for the lowest transitions, one can observe that transitions perpendicular axis correspond to -type singularities, while the transition parallel is of -type due to the negative and smaller hole effective mass value than its electron counterpart in direction . Hence, we conclude that transitions labeled and should be modelled as -type CPs, and transition labelled will be modelled as -type CP.
| CP | Eq. No. | (eV) | (eV) | (eV) | ||
| CP(0x) | 4 | 0.82(8) | 5.45(6) | 0.46(1) | 0.21(2) | |
| CP(0) | 1,2 | 50(4) | 5.46(6) | 0.28(3) | - | |
| CP(1) | 1,2 | 44(3) | 6.041(5) | 0.09(1) | - | |
| CP(2) | 5-7 | 175.63(1) | 10.2(8) | 2.54(1) | - | |
| CP(0x) | 4 | 0.48(7) | 5.44(2) | 0.728(7) | 0.67(1) | |
| CP(0) | 2,3 | 0.68(1) | 5.62(2) | 0.86(2) | - | |
| CP(1) | 5-7 | 2.64(6) | 9.2(8) | 0.78(2) | - | |
| CP(2) | 5-7 | 4.09(5) | 11.2(3) | 5.41(6) | - | |
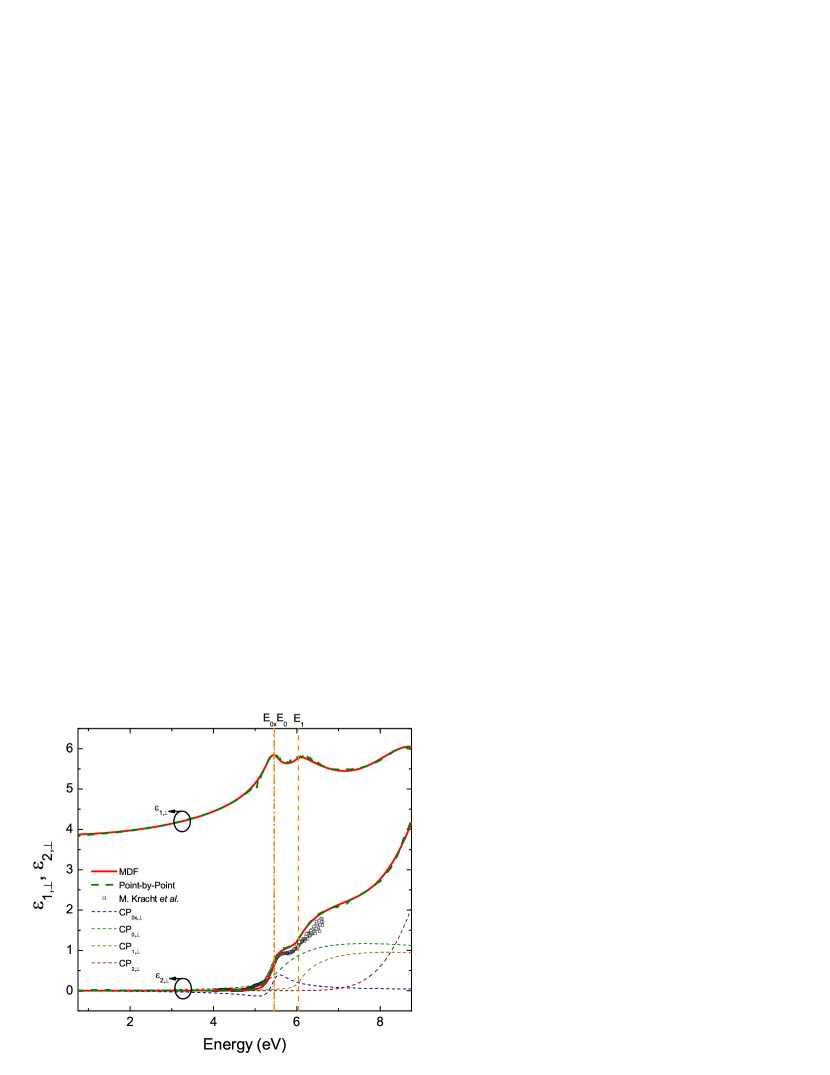
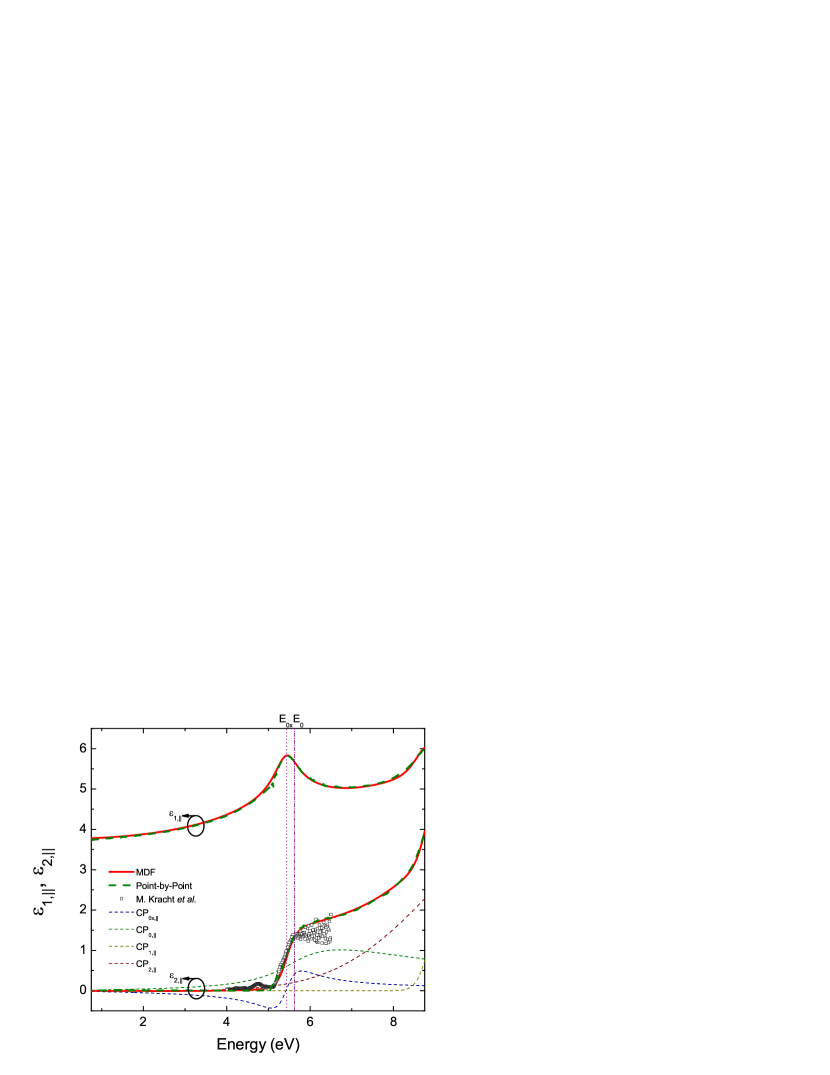
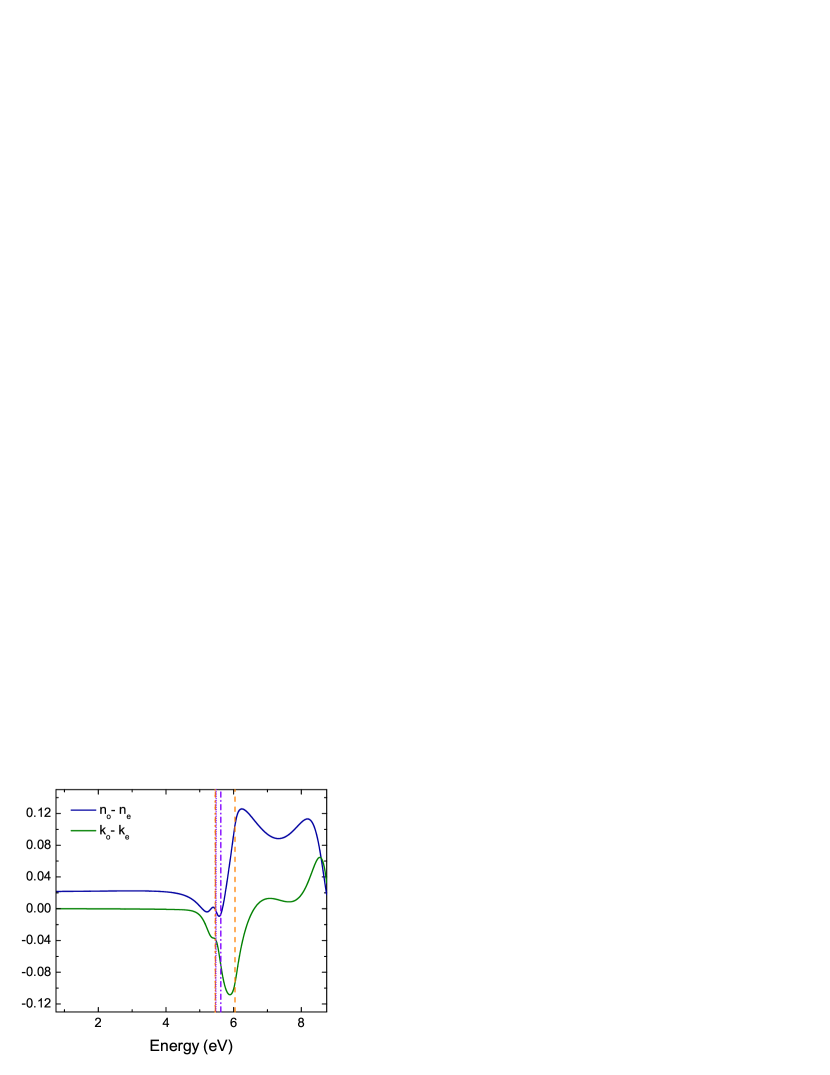
Figures 2 and 3 depict the best-match model calculated PBP (dashed lines) and MDF (solid lines) derived spectra for and , respectively. Both figures reveal the anisotropic ultra-wide bandgaps of -Ga2O3. Two distinct features can be identified in in the near-bandgap region, where only one is seen in . Also overlaid are data reported previously by Kracht et al. measured on different samples, which cover only parts of the second CP structure in .Kracht et al. (2018) In both and , features are broadened, similar to features within dielectric functions of other single crystalline ultra-wide bandgap metal oxides such as -Ga2O3,Sturm et al. (2016); Mock et al. (2017) ThO2, or UO2,Mock et al. (2019b) for example. We note that individual negative imaginary parts are due to the effect of anharmonic coupling. Separating a dielectric response into contributions from individual CP line shapes can result in limited spectral regions with some individual model functions revealing negative imaginary parts. This observation is a consequence of coupling between individual processes, such as between band-to-band transitions and exciton formation. Such observations are often made in line shape model approaches for the infrared optical properties in materials with coupled phonon modes.Gervais and Piriou (1974) Energy conservation is valid for the sum of all present physical processes only. Table LABEL:Tab:parms list all best-match model parameters, which together with equations given above suffice to near-perfect match the experimental data. By extrapolation of MDF values for eV we obtain = 3.86 and = 3.76, which agree well with recent results obtained from infrared measurements (=3.75 and =3.64).Feneberg et al. (2019) We find the lowest band-to-band transitions for -Ga2O3 at =5.46(6) eV and =5.62(2) eV, with . We find the binding energy parameter for the exciton contribution for the -type transition, = 7 meV, which is much less than = 178 meV. Such small binding energy can be explained with the traditional exciton formation in a three dimensional effective hydrogen model. In this model, the ground state excitation equals the exciton binding energy ( = 13.6 eV), is the reduced mass of the combined density of states at the -point, and is the static dielectric constant. Using an estimate for =10,Segura et al. (2017) and reduced mass parameters listed in the caption of Table LABEL:tab:mass we obtain = 25 meV, in good agreement with our MDF result (7 meV). For the -type CP, the exciton is hyperbolic and two-dimensional, and its ground state energy is four times smaller than that of a -type exciton.Shinada and Sugano (1966); Yu and Cardona (1999) For large energy, short radius excitons phonon-exciton interaction is considered small.Bechstedt (2015) Therefore, may be estimated using screening by instead of . With our values for and mass parameters in Table LABEL:tab:mass, we obtain = 540 meV. This estimate is still in good qualitative agreement with our MDF result (178 meV). Our finding of such different excitons at the band edge of -Ga2O3 is not surprising given the highly anisotropic nature of both the real-space dielectric response as well as the reciprocal space band structure in the vicinity of the -point. We note that Bechstedt and Furthmüller recently estimated an exciton energy of 184 meV ignoring valence band contributions and anisotropy.Bechstedt and Furthmüller (2019) We also note that the exciton broadening parameters are much larger than their binding energies. The influence of the correlated electron-hole pairs to the optical properties of semiconductors in the vicinity of the absorption threshold for the case of large broadening was discussed by Tanguy et al.Tanguy (1999) It was shown analytically that a strong modification of the dielectric function in the near-band-to-band transition region is still present in such overdamped situations, even when room temperature thermal energy is larger than the exciton binding energy as observed here for the ordinary exciton. We further note that a similar CP analysis for monoclinic -Ga2O3 resulted in exciton energy parameters of 120 meV, 230 meV, and 178 meV for the three fundamental band-to-band transitions polarized nearly along axes , , and , respectively.Mock et al. (2017) A similar observation was made by Sturm et al. who assumed equal energies for all transitions of 270 meV.Sturm et al. (2016) Additional research on the excitonic contributions to critical points, especially in complex low-symmetry materials such as transition metal oxides, will improve our understanding of their optical properties. A higher energy transition is identified at =10.2(8), which is obtained by extrapolation, i.e., through modeling of a Gaussian tail into the measured spectral range. This energy agrees well with a transition at 11.1 eV observed in synchrotron experiments.Feneberg et al. (2018) Two higher energy transitions are suggested in at 9.2(8) eV and 11.2(3) eV. Finally, Fig. 4 depicts differences between the ordinary and extraordinary indices of refraction and extinction coefficients, where it is seen that -Ga2O3 is uniaxial negative below the bandgap with very small and nearly wavelength independent birefringence (0.02), and with small dichroism across the onset of absorption because both major directions absorb at about the same photon energy.
In summary, we have performed a combined ellipsometry and density functional theory study to determine the properties of the fundamental band-to-band transitions in -Ga2O3. We have identified and accurately modelled the contributions of three transitions at the onset of absorption, which (a) belong to two distinct three-dimensional van Hove singularities at maxima for transitions polarized perpendicular to the axis, and (b) to one -type saddle point singularity for the transition polarized parallel to axis. Accordingly, we observe excitonic contributions with 7 meV binding energy for the lowest -type transition, and with 178 meV binding energy for the -type transition.
This work was supported in part by the National Science Foundation under award DMR 1808715, by Air Force Office of Scientific Research under award FA9550-18-1-0360, by the Nebraska Materials Research Science and Engineering Center under award DMR 1420645, by the Swedish Knut and Alice Wallenbergs Foundation supported grant ’Wide-bandgap semi-conductors for next generation quantum components’, and by the American Chemical Society/Petrol Research Fund. M. S. acknowledges the University of Nebraska Foundation and the J. A. Woollam Foundation for financial support. DFT calculations were in part performed at the Holland Computing Center of the University of Nebraska, which receives support from the Nebraska Research Initiative.
The data that support the findings of this study are available from the corresponding author upon reasonable request.
I References
References
- Higashiwaki and Jessen (2018) M. Higashiwaki and G. H. Jessen, Appl. Phys. Lett. 112, 060401 (2018).
- Roy, Hill, and Osborn (1952) R. Roy, V. G. Hill, and E. F. Osborn, J. Am. Chem. Soc. 74, 719 (1952).
- Shinohara and Fujita (2008) D. Shinohara and S. Fujita, Jpn. J. Appl. Phys. 47, 7311 (2008).
- G. Sinha (2005) S. C. G. Sinha, K. Adhikary, J. Cryst. Growth 276, 204 (2005).
- Roberts et al. (2019) J. Roberts, P. Chalker, B. Ding, R. Oliver, J. Gibbon, L. Jones, V. Dhanak, L. Phillips, J. Major, and F.-P. Massabuau, J. Cryst. Growth 528, 125254 (2019).
- Segura et al. (2017) A. Segura, L. Artús, R. Cuscó, R. Goldhahn, and M. Feneberg, Phys. Rev. Materials 1, 024604 (2017).
- Elliott (1957) R. J. Elliott, Phys. Rev. 108, 1384 (1957).
- Toyozawa (1958) Y. Toyozawa, Progress of Theoretical Physics 20, 53 (1958).
- Kracht et al. (2018) M. Kracht, A. Karg, M. Feneberg, J. Bläsing, J. Schörmann, R. Goldhahn, and M. Eickhoff, Phys. Rev. Appl. 10, 024047 (2018).
- Feneberg et al. (2018) M. Feneberg, J. Nixdorf, M. D. Neumann, N. Esser, L. Artús, R. Cuscó, T. Yamaguchi, and R. Goldhahn, Phys. Rev. Materials 2, 044601 (2018).
- Kasic et al. (2000) A. Kasic, M. Schubert, S. Einfeldt, D. Hommel, and T. E. Tiwald, Phys. Rev. B 62, 7365 (2000).
- Feneberg et al. (2019) M. Feneberg, J. Bläsing, T. Sekiyama, K. Ota, K. Akaiwa, K. Ichino, and R. Goldhahn, Appl. Phys. Lett. 114, 142102 (2019).
- He et al. (2006) H. He, R. Orlando, M. A. Blanco, R. Pandey, E. Amzallag, I. Baraille, and M. Rérat, Phys. Rev. B 74, 195123 (2006).
- Litimein et al. (2009) F. Litimein, D. Rached, R. Khenata, and H. Baltache, Journal of Alloys and Compounds 488, 148 (2009).
- Furthmüller and Bechstedt (2016) J. Furthmüller and F. Bechstedt, Phys. Rev. B 93, 115204 (2016).
- Bechstedt and Furthmüller (2019) F. Bechstedt and J. Furthmüller, Appl. Phys. Lett. 114, 122101 (2019).
- Yu and Cardona (1999) P. Yu and M. Cardona, Fundamentals of Semiconductors (Springer, Berlin, 1999).
- Shinada and Sugano (1966) M. Shinada and S. Sugano, J. Phys. Soc. Jpn. 21, 1936 (1966).
- Giannozzi et al. (2009) P. Giannozzi, S. Baroni, N. Bonini, M. Calandra, R. Car, C. Cavazzoni, D. Ceresoli, G. L. Chiarotti, M. Cococcioni, I. Dabo, A. D. Corso, S. de Gironcoli, S. Fabris, G. Fratesi, R. Gebauer, U. Gerstmann, C. Gougoussis, A. Kokalj, M. Lazzeri, L. Martin-Samos, N. Marzari, F. Mauri, R. Mazzarello, S. Paolini, A. Pasquarello, L. Paulatto, C. Sbraccia, S. Scandolo, G. Sclauzero, A. P. Seitsonen, A. Smogunov, P. Umari, and R. M. Wentzcovitch, J. Phys.: Cond. Mat. 21, 395502 (2009).
- Perdew, Burke, and Ernzerhof (1996) J. P. Perdew, K. Burke, and M. Ernzerhof, Phys. Rev. Lett. 77, 3865 (1996).
- Fuchs and Scheffler (1999) M. Fuchs and M. Scheffler, Comput. Phys. Commun. 119, 67 (1999).
- Troullier and Martins (1991) N. Troullier and J. L. Martins, Phys. Rev. B 43, 1993 (1991).
- Jain et al. (2013) A. Jain, S. P. Ong, G. Hautier, W. Chen, W. D. Richards, S. Dacek, S. Cholia, D. Gunter, D. Skinner, G. Ceder, and K. A. Persson, APL Mat. 1, 011002 (2013).
- (24) Materials Data on Ga2O3 by Materials Project, DOI: 10.17188/1188790.
- Monkhorst and Pack (1976) H. J. Monkhorst and J. D. Pack, Phys. Rev. B 13, 5188 (1976).
- Song, Yamashita, and Hirao (2011) J.-W. Song, K. Yamashita, and K. Hirao, J. Chem. Phys. 135, 071103 (2011).
- Song et al. (2013) J.-W. Song, G. Giorgi, K. Yamashita, and K. Hirao, J. Chem. Phys. 138, 241101 (2013).
- Marzari and Vanderbilt (1997) N. Marzari and D. Vanderbilt, Phys. Rev. B 56, 12847 (1997).
- Souza, Marzari, and Vanderbilt (2001) I. Souza, N. Marzari, and D. Vanderbilt, Phys. Rev. B 65, 035109 (2001).
- Mostofi et al. (2008) A. A. Mostofi, J. R. Yates, Y.-S. Lee, I. Souza, D. Vanderbilt, and N. Marzari, Comput. Phys. Commun. 178, 685 (2008).
- Vitale et al. (2020) V. Vitale, G. Pizzi, A. Marrazzo, J. R. Yates, N. Marzari, and A. A. Mostofi, Comput. Materials 6, 66 (2020).
- Jinno et al. (2020) R. Jinno, C. S. Chang, T. Onuma, Y. Cho, S.-T. Ho, M. C. Cao, K. Lee, V. Protasenko, D. G. Schlom, D. A. Muller, H. G. Xing, and D. Jena, “Crystal orientation dictated epitaxy of ultrawide bandgap 5.4-8.6 ev -(alga)2o3 on m-plane sapphire,” (2020), arXiv:2007.03415 [physics.app-ph] .
- Fujiwara (2007) H. Fujiwara, Spectroscopic Ellipsometry (John Wiley & Sons, New York, 2007).
- Harman, Ninomiya, and Adachi (1994) A. K. Harman, S. Ninomiya, and S. Adachi, J. Appl. Phys. 76, 8032 (1994).
- Schubert et al. (1999) M. Schubert, T. Hofmann, B. Rheinländer, I. Pietzonka, T. Sass, V. Gottschalch, and J. A. Woollam, Phys. Rev. B 60, 16618 (1999).
- tom (2012) Guide to Using WVASE® Spectroscopic Ellipsometry Data Acquisition and Analysis Software (J. A. Woollam Co., Inc., Lincoln NE, 2012).
- Strössner, Ves, and Cardona (1985) K. Strössner, S. Ves, and M. Cardona, Phys. Rev. B 32, 6614 (1985).
- Mock et al. (2019a) A. Mock, R. Korlacki, S. Knight, M. Stokey, A. Fritz, V. Darakchieva, and M. Schubert, Phys. Rev. B 99, 184302 (2019a).
- Note (1) A detailed discussion of the presentation of the anharmonically broadened oscillator form suggested by Gervais and Piriou in Ref. \rev@citealpnumGervais_1974 and the form suggested by Mock et al. in Ref. \rev@citealpnumPhysRevB.99.184302 has yet to appear in the literature. Briefly, simple mathematical transformations proof that both forms are identical. The advantage of the latter form, Eq. 4 in this paper, is that it can be added to a sum of model contributions to the dielectric function, while the former must be brought into a product form considerably complicating the regression calculations.
- Tanguy (1995) C. Tanguy, Phys. Rev. Lett. 75, 4090 (1995).
- Setyawan and Curtarolo (2010) W. Setyawan and S. Curtarolo, Comput. Mat. Sci. 49, 299 (2010).
- Sturm et al. (2016) C. Sturm, R. Schmidt-Grund, C. Kranert, J. Furthmüller, F. Bechstedt, and M. Grundmann, Phys. Rev. B 94, 035148 (2016).
- Mock et al. (2017) A. Mock, R. Korlacki, C. Briley, V. Darakchieva, B. Monemar, Y. Kumagai, K. Goto, M. Higashiwaki, and M. Schubert, Phys. Rev. B 96, 245205 (2017).
- Mock et al. (2019b) A. Mock, C. Dugan, S. Knight, R. Korlacki, J. M. Mann, M. M. Kimani, J. C. Petrosky, P. A. Dowben, and M. Schubert, Appl. Phys. Lett. 114, 211901 (2019b).
- Gervais and Piriou (1974) F. Gervais and B. Piriou, Journal of Physics C: Solid State Physics 7, 2374 (1974).
- Bechstedt (2015) F. Bechstedt, Many-Body Approach to Electronic Excitations (Springer, 2015).
- Tanguy (1999) C. Tanguy, Phys. Rev. B 60, 10660 (1999).