Data Engagement Reconsidered: A Study of Automatic Stress Tracking Technology in Use
Abstract.
In today’s fast-paced world, stress has become a growing health concern. While more automatic stress tracking technologies have recently become available on wearable or mobile devices, there is still a limited understanding of how they are actually used in everyday life. This paper presents an empirical study of automatic stress-tracking technologies in use in China, based on semi-structured interviews with 17 users. The study highlights three challenges of stress-tracking data engagement that prevent effective technology usage: the lack of immediate awareness, the lack of pre-required knowledge, and the lack of corresponding communal support. Drawing on the stress-tracking practices uncovered in the study, we bring these issues to the fore, and unpack assumptions embedded in related works on self-tracking and how data engagement is approached. We end by calling for a reconsideration of data engagement as part of self-tracking practices with technologies rather than simply looking at the user interface.
1. Introduction
In today’s fast-paced and hectic world, stress is a growing health concern. It is not just that too much stress can reduce study and work efficiency, but that stress has been closely linked to psychological illness. Previous research has found a strong association between stress and depression (Hammen, 2005), and long term exposure to high levels of stress can negatively impact our well being (Rosengren et al., 2004; Matthews and Gump, 2002; Chandola et al., 2006), leading to various physical diseases, such as hypertension (Pickering, 2001), cardiovascular disease (Pickering, 2001), infectious illnesses (Steptoe, 1991) and even cancer (Cohen et al., 2007). Therefore, the awareness and effective management of stress is of significant importance to the management of health.
In recent years, stress-tracking technologies that can automatically detect and collect stress data during the day have become commercially available. More and more wearable products have automatic stress tracking features embedded, such as smart bracelets and watches made by Huawei (Inc, [n.d.]d), Garmin (Inc, [n.d.]b), and Samsung (Inc, [n.d.]e). There are also products that are dedicated to stress-tracking, such as Healbe Gobe2 (Inc, [n.d.]c), Wellbe (Inc, [n.d.]g), Bellabeat Leaf Urban (Inc, [n.d.]a), and Spire Stone (Inc, [n.d.]f). These products, by automatically detecting an individual’s stress level, often combined with features to help with relaxation, offer the potential to help with an awareness and an effective management of stress on a daily basis.
With more mature stress-tracking technologies on the market, however, it is still unclear how these technologies actually work in practice. In HCI and related fields, there have been many studies on stress, but they’ve primarily focused on innovative approaches to automatic stress tracking (Hovsepian et al., 2015; Bogomolov et al., 2014; Li et al., 2018; Lu et al., 2012) or designs that can help stress relief (Cochrane, 2019; Paredes and Chan, 2011; Yu et al., 2017); little attention has been paid to how people use the automatic stress-tracking technologies. In addition, although there has been extensive work on the use of self-tracking technologies, also known as Personal Informatics (PI) (Li et al., 2010), or quantified self (Choe et al., 2014), that are designed to track various aspects of our lives, such as steps, mood, sleep, and heart rate (Lin et al., 2006; Caldeira et al., 2017; Ravichandran et al., 2017; Harrison et al., 2015; Lee and Hong, 2018), research on the use of stress-tracking technologies in everyday lives in particular has been rare. Yet, stress-tracking has distinct characteristics that deserve their own attention. Stress as a measurement is not as straightforward as steps (Bassett et al., 2017), or heart rate that can be directly quantified with counting, and is less objective and more complex. Furthermore, stress involves not only psychological and emotional responses (such as anxiety, anger, sadness (Lazarus and Lazarus, 1991), fear, and frustration (Butler, 1993)), but also physiological and bodily reactions. As (Kelley et al., 2017) points out, self-tracking for daily stress has unique challenges because stress is highly subjective and involves social and environmental factors. Thus, the research question we would like to answer is this: how do people encounter and use the automatic stress-tracking technologies that have become available in more and more wearable devices in everyday life?
To answer it, we conducted a qualitative study to understand automatic stress-tracking technology in use. We recruited 17 participants in China who used automatic stress-tracking technologies and conducted semi-structured interviews with them. The study highlights a number of challenges associated with users’ stress-tracking data engagement, including the lack of immediate awareness of relevant data, the lack of pre-required knowledge, domain and technical, as well as the lack of corresponding communities of practice. Many of these challenges are associated with how the automatic stress-tracking technology is adopted and designed, how the stress data is encountered, and how our users are socially situated. This study unpacks some of the data engagement assumptions embedded in the related work on self-tracking technologies.
The contribution of this paper is an empirical study on the use of automatic stress tracking in practice, and a more nuanced understanding of data engagement with self-tracking technologies. In the paper below, we will first give background information on stress and stress-tracking technologies and review related works on stress and self-tracking data engagement. We will then present our study and the findings, and discuss how the focus of stress-tracking technologies brings to the fore some of the issues of data engagement with self-tracking technologies in general.
2. Background
2.1. What is stress?
While the term “stress” is pervasively used, there has never been a unified definition of it. Broadly speaking, stress has been mainly examined in two ways, psychologically and physiologically, with the former focusing on psychological feelings and the perception of stress and the latter referring to the bodily response to external events.
In psychology, stress refers to the feelings and perception of pressure. It holds that “stress occurs when a person perceives the demands of an environment stimuli to be greater than their ability to meet, mitigate, or alter those demands” (Lazarus et al., 1985). Stress is as such perceived as a subjective concept, and in psychology, self-reporting is usually used to detect it . While most associate stress with negative feelings, such as fear and anxiety, stress can also be positive and beneficial. Unlike negative stress or “distress”, with positive stress or “eustress” , people appraise a situation to be challenging and non- threatening (Folkman and Moskowitz, 2000) and have the confidence to solve it. One study found an inverted u-shaped relationship between stress and performance; in other words, stress is beneficial to performance until an optimal level, and then performance starts to decrease (Le Fevre et al., 2003).
In the medical field, the term “stress” is defined physiologically as “the non-specific responses of the body to any demand for change” (Selye, 1965). When people encounter threats or challenges, the body will have corresponding reactions, which are generated by the autonomic nervous system. The autonomic nervous system (ANS) is comprised of the sympathetic nervous system (SNS) and the parasympathetic nervous system (PNS). The SNS is responsible for mobilizing the body’s resources to deal with stressful events, in what is called the “fight-or-flight” response, and brings with it a series of physiological reactions, such as an increase in heart rate, and respiration and sweat gland activity (Sun et al., 2010). The PNS is mainly active during periods of relaxation and recovery.
When people talk about stress in everyday life, they are usually referring to psychological or subjective feelings, such as tension, anxiety, and fear, which they frequently associate with an external event, like an upcoming exam or deadline at work. While more people are starting to realize the impact of long-term stress on their health, the way the nervous system physiologically reacts to stress and the distinction between psychological and physiological stress, are not yet a part of most people’s everyday understanding.
2.2. Stress-Tracking Technology
Today, there are wearable commercial stress-tracking devices available on the market that can automatically detect stress including general products, such as smart bracelets and watches from Huawei (Inc, [n.d.]d), Garmin (Inc, [n.d.]b) and Samsung (Inc, [n.d.]e) with embedded stress -tracking features, as well as other products like Healbe Gobe2 (Inc, [n.d.]c), Wellbe (Inc, [n.d.]g), Bellabeat Leaf Urban (Inc, [n.d.]a), and Spire Stone (Inc, [n.d.]f) specializing in stress-tracking. The products by Huawei, Garmin, and Samsung detect stress based on an analysis of Heart Rate Variability (HRV) collected by an embedded optical heart rate sensor. Some devices, such as the Huawei (including Honor) watch, ask users to fill out a stress questionnaire when they first start using the stress-tracking function.
Heart Rate Variability (HRV), defined as the variation over time of the period between consecutive heartbeats (R-R intervals) (Acharya et al., 2006), has been proven to be a reliable indicator of ANS activity (Malik, 1996) and can be used as an objective assessment of stress (Kim et al., 2018). HRV is widely used for stress detection with both laboratory stressors ( arithmetic problems (Gandhi et al., 2015),the Stroop Color Word Test, highly paced video games (Castaldo et al., 2017)) and real life stressors (university examinations (Melillo et al., 2011), speeches (Aguiar et al., 2013), driving (Munla et al., 2015)). An accurate HRV is usually obtained from an Electrocardiogram (ECG) sensor, which needs to attached by electrodes or chest straps directly to the body. A less invasive and more comfortable alternative is Photoplethysmography (PPG), which can be embedded into a phone camera, ring, or smart wristband device. The Pulse rate variability (PRV) extracted from the PPG has also been proven to be an effective surrogate for HRV for stress detection (Lyu et al., 2015; Lin et al., 2014). In fact, in many wearable commercial products, PRV is directly referred to as HRV. In this paper, we will not distinguish between HRV and PRV , as we will mainly be studying wearable commercial stress-tracking products.
These products also commonly provide visualizations to help users engage with the quantified stress data. For example, on Huawei’s stress-tracking products, stress value, in range of 1-99, is displayed every 30 minutes, and is divided into four levels (1-29 as relaxed, 30-59 as normal, 60-79 as medium, 80-99 as high), which are shown in bars with different corresponding colours (sky blue, light blue, yellow and orange), as shown in Fig. 2. Unlike Huawei, Garmin shows stress values in real-time. It divides the stress value, in the range of 0-100, into four levels (0-25 as resting, 26-50 as low stress, 51-75 as medium stress, 76-100 as high stress); however, except for resting which is represented as blue, all other levels are represented as yellow, and are not further distinguished with different colors, as shown in Fig. 2. After synchronization, users of both Huawei and Garmin’s products can see more stress details with the corresponding mobile applications (Huawei Health, Garmin Connect), including all-day stress data, long-term stress data, the proportion of stress level among other information. These products also provide functions to help users relieve stress, such as deep breathing, biofeedback games, and mindfulness.
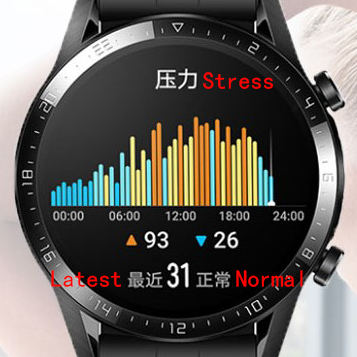
The stress interface on Watch GT, with four different colours represent four different stress levels.
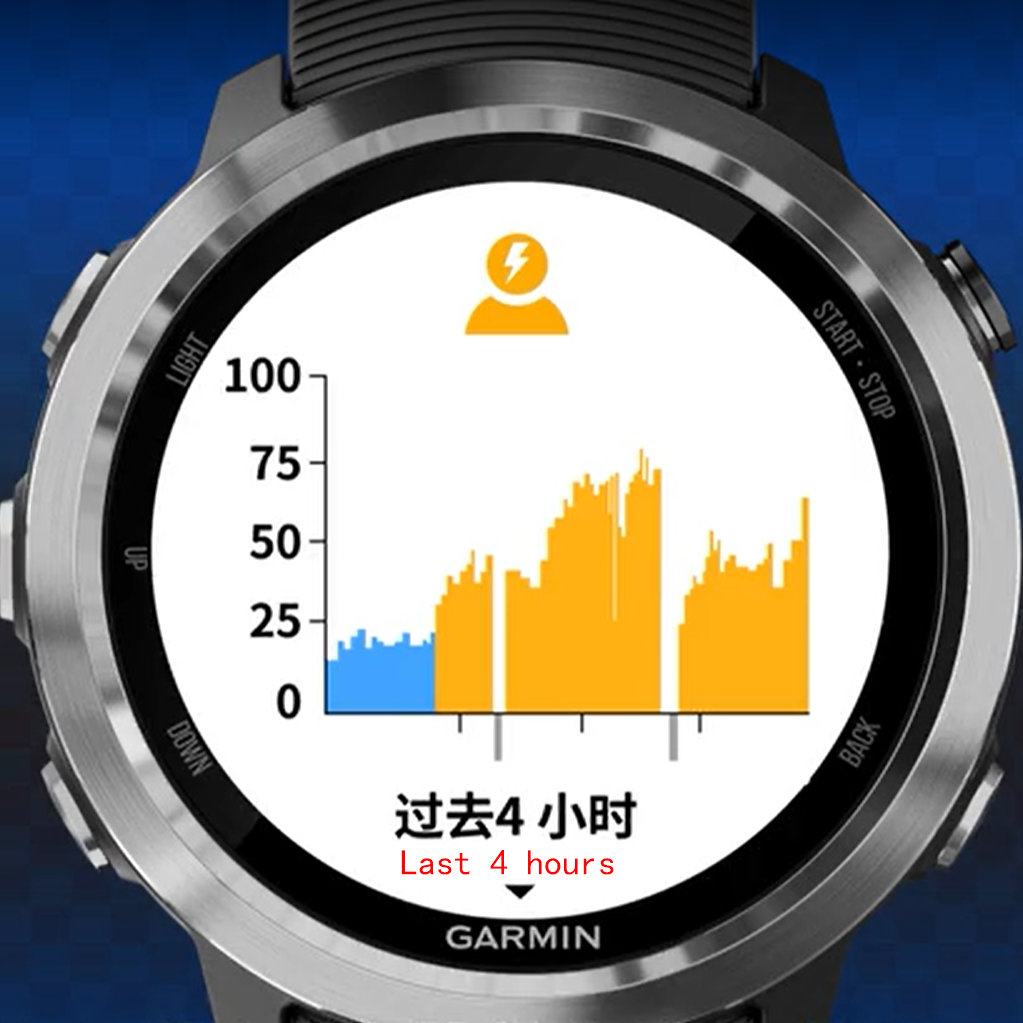
The stress interface on Garmin, with blue and yellow represent resting and stress respectively.
3. Related Work
3.1. Stress Sensing and Management
In HCI, there are many works on innovative approaches to automatic stress-sensing. For instance, office devices such as a mouse and keyboard are explored to detect stress, but this approach is limited to the work environment and cannot be used in other scenarios of daily life (Hernandez et al., 2014; Vizer, 2009). In addition, smartphones embedded with various sensors are commonly studied to detect stress, e.g. based on human voices (Lu et al., 2012), smartphone usage data (Vildjiounaite et al., 2018), behavioral metrics of mobile phone activity combined with contextual data (Bogomolov et al., 2014), and so on. However, they are either too constrained by environmental factors (e.g. can’t be too quiet or too noisy)(Lu et al., 2012) or too limited in accuracy (Vildjiounaite et al., 2018) to be used for daily stress detection.
In contrast, wearable devices embedded with sensors are advantageous for daily stress detection because they can collect objective physiological data and provide relatively timely feedback. For example, electrocardiograph (ECG) and respiration data obtained from a chest belt (Hovsepian et al., 2015), and pulse rate variability features collected from a watch can all been used to detect stress with a satisfactory accuracy rate in the field, and the wrist device is even more portable and less invasive to be used on daily basis.
In addition, much of the work is on biofeedback and intervention technologies to help people relieve stress. Some explore real-time feedback on interventions (such as taking a deep breath) to reflect on their behavior patterns (Sanches et al., 2010). Others compare the relief effects of different types of interventions including haptic feedback, games, and social networks (Paredes and Chan, 2011). Visualizations of stress data with contexts (such as activity and location) are also explored to inform the content and just-in-time interventions (Sharmin et al., 2015). However, it is found that the methods of stress feedback need to be carefully designed, otherwise they potentially become stressors (MacLean et al., 2013).
Although not specifically focused on stress, in work on mental wellness, stress management is an important theme. One focus is on improving mental wellness or peacefulness of mind as a way to deal with stress, e.g through mindfulness (Praissman, 2008), or methods to maintain users’ attention (Knight and Rickard, 2001; Clark and Hirschman, 1990; Paredes and Chan, 2011). Some of these studies were at the intersection of mental health and stress tracking, and some were design studies, using focus groups (Kelley et al., 2017), or workshops (Lee and Hong, 2018), and exploring design opportunities for self-tracking.
Overall, the work on stress has mainly focused on innovative approaches to automatic stress-sensing and design that can help relieve stress. Although many stress-tracking products have become commercially available, there have been few studies on the use of these technologies in real life. Adams et al. conducted a study comparing three stress tracking approaches in the real-world environment (self-report, EDA, and voice-based), and while the study found that these three approaches are about equally effective in different contexts (Adams et al., 2014), the study didn’t evaluate automatic stress tracking. In another instance a feature analysis of 26 stress management apps investigated how the apps support reflection and action (Ptakauskaite et al., 2018); this study also left automatic stress-tracking out from its analysis. As such, there is still a lack of empirical study and understanding of automatic stress-tracking in everyday life.
3.2. Data Engagement with Self-tracking Technology
While little has been done on stress-tracking technology in use in particular, there has been extensive research on the use of other automatic self-tracking technologies, exploring issues of adoption/abandonment (Rapp and Cena, 2016; Epstein et al., 2016; Clawson et al., 2015; Rooksby et al., 2014), use in particular domains such as sports (Patel and O’Kane, 2015) and diabetes management (Mamykina et al., 2006), and design for particular tracking (Matthews et al., 2015; Epstein et al., 2017). Here we review the self-tracking work that is related to data engagement.
Studies of self-tracking technologies in use reveal various challenges to data engagement. These challenges are often explored as barriers to adoption, especially for non-experienced users. For example, Rapp and Cena focused on how novice users perceive and use self-tracking tools in everyday life (Rapp and Cena, 2016), revealing a number of data engagement issues that prevented effective integration, including perceived inaccuracy and untrustworthiness based on the users’ memories of their behavior, emotional disconnection from abstract visualization, and not knowing what to do with the data due to a lack of suggestions. Similarly, Lazar et al. found that participants abandoned their devices because they did not think the data provided anything informative (e.g. when they went to sleep and when they got up), or they did not know what to do with the data (e.g. what to do with the heart rate data) (Lazar et al., 2015). Ravichandran et al. ’s(Ravichandran et al., 2017) study of sleep tracking technology found that users’ misunderstanding of what constitutes good sleep restricted them from taking meaningful action. In general, it has been found that, except for quantified selfers who are keen on tracking and numbers (Choe et al., 2014), most people find it difficult to engage with tracked data (Rapp et al., 2018) for reasons that include incomplete tracking, having too much or too little data (Jones and Kelly, 2018), poor aesthetics, unsuitable visualizations, a lack of time, a lack of motivation, and a lack of related expertise (Harrison et al., 2015; Li et al., 2010; Lazar et al., 2015). As such, users face many challenges when leveraging the devices’ quantified data for effective use.
To support data engagement, visualization and integration have been commonly employed to help people gain insights from data, e.g. making the data more ready to use, integrating more contextual information, and correlating different sources of data. For example, Li et al. investigated incorporating contextual information to the self-tracked performance data, such as steps, to further promote self-awareness and help people find ways to integrate activity into their lives (Li, 2009). In the study of diabetes self-management practices (Mamykina et al., 2006), Mamykina et al. emphasized the importance of a correlation between daily activities (such as exercise, food intake) with the blood sugar levels to help users reflect and make appropriate lifestyle choices in the future. MONARCA (Frost et al., 2013) is a system designed for people with bipolar disorder to collect subjective (such as mood, sleep, medicine taken) and objective (such as calls, text messages, physical activity) data through a semi-automatic method that helps them identify factors that may affect their disease. Overall, these approaches primarily focus on supporting the mental cognitive processes of data engagement by making data more available, visible, and integrated.
In recent years, various novel approaches or designs to support data engagement have also been explored. To address users’ challenges, such as low graphical literacy and the inability to uncover subtle correlations between data sets, approaches beyond visualization, including the use of natural language summaries based on statistical analysis, have been explored to increase data engagement and understanding (Kay, 2014; Bentley et al., 2013). It has been suggested that some features, like dialogue, might influence the need for reflection (Halttu and Oinas-Kukkonen, 2017). Social approaches to reflection have also been investigated. For instance, Feustel et al. looked at the idea of aggregating cohort data into personal informatics systems to support meaningful reflection (Feustel et al., 2018), and Graham et al. conducted a study to understand shared reflection by asking people to reflect on each other’s data (Graham et al., 2016).
Since the issues surrounding the data engagement of self-tracking is often explored in terms of reflection (Li et al., 2010), the conceptual meaning of reflection has also systematically been reviewed and examined to support the design for reflection (Slovák et al., 2017; Baumer, 2015; Ploderer et al., 2014). For instance, drawing on Schon’s notion of reflective practum, Slovak et al. identified three components to scaffold for reflection, explicit (the link between experience and reflection), social and personal components (Slovák et al., 2017). Baumer reviewed conceptual and theoretical models of reflection, and identified three dimensions: breakdown, inquiry and transformation (Baumer, 2015). Ploderer et al. distinguished between reflection-in-action and reflection-on-action, with the former referring to the reflection of realtime feedback, and the latter to data exploration when convenient (Ploderer et al., 2014). However, while insightful, these meanings have evolved from general theories or empirical studies of reflection, and do not involve self-tracking technologies, and thus may miss the unique complexities and dynamics of reflection brought by the involvement of the self-tracking technologies themselves.
In this paper, we focus on a complex and relatively new and under-explored automatic tracking technology – stress tracking – in use, and hope to uncover new insights into users’ data engagement with self-tracking technologies in practice to contribute to this body of work and inform the related design of self-tracking technologies.
4. Methods
To gain a better understanding of the use of automatic stress-tracking technologies in practice, we adopted the qualitative research method to uncover the rich and detailed usage data, by interviewing those who had already used and experienced related technologies. For participant recruitment, we designed a flyer searching for those who had used wearable devices with stress-tracking features. On the flyer, we described our study motivation, study method, participant qualifications and compensation, and one of the authors’ WeChat contact information. In China, the two most popular brands of smart wearable devices with stress-tracking features are Huawei(including Honor) and Garmin (top, [n.d.]b, [n.d.]a), so we posted the recruitment flyers in the QQ and WeChat groups for Huawei and Garmin wearable device users, as well as some general wearable smart device communities, and our own WeChat circles to recruit more users. Finally, we recruited 17 participants in total, including 14 from the user groups or communities, and 3 from participants’ recommendations. Their profile information is shown in Table 1. Most of them are male, and include 16 males and 1 female, largely aligning with the male to female ratio of smart wearable device market (Tencent, 2018). In addition, most are young, ranging from 21 to 39 years old. Their occupations are diverse, and include those related to science and technology, such as IT manufacturing trainee, technical developer, programmer, wearable health worker, and exercise physiology worker, as well as those that are not IT related, including salesman, government worker, and customer service employee. As shown in the table, they were from many different cities in China, ranging from inland cities in the north, such as Beijing, Zhengzhou, Shenyang, and Xi’an, as well as coastal cities in the south, such as Dongguan, Shenzhen and Guangzhou. Most of the participants used Huawei’s Watch GT or Honor Watch Magic; P12 and P17 used Garmin’s Vívosmart 4 and Forerunner 645 Music, respectively. All had used the devices from between half a month to 12 months.
| ID | Gender | Age | Occupation | Device | Location |
|---|---|---|---|---|---|
| P1 | M | 21 | Exhibition Salesman | Watch GT | Shanghai |
| P2 | M | 31 | Government Worker | Honor Watch Magic | Tonghua* |
| P3 | M | 21 | IT Manufacturing Trainee | Honor Watch Magic, Watch GT | Dongguan** |
| P4 | M | 35 | Technical Developer | Huawei B5 bracelet | Beijing |
| P5 | M | 22 | Design and Operation Worker | Honor Watch Magic | Zhengzhou* |
| P6 | M | 28 | Programmer | Honor Watch Magic | Beijing |
| P7 | F | 26 | Wearable Health Worker | Watch GT | Shenzhen |
| P8 | M | 31 | Business Operator | Honor Watch Magic | Xuchang * |
| P9 | M | 39 | Government Worker | Watch GT | Shanghai |
| P10 | M | 26 | Programmer | Honor Watch Magic | Beijing |
| P11 | M | 28 | Unemployed | Watch GT | Shenyang* |
| P12 | M | 25 | Exercise physiology worker | Watch GT, Garmin vívosmart4 | Finland and China |
| P13 | M | 34 | Customer service | Watch GT | Shanghai |
| P14 | M | 32 | Unemployed | Honor Watch Magic | Shanghai |
| P15 | M | 28 | Programmer | Honor Watch Magic, Watch GT | Xi’an* |
| P16 | M | 24 | Advertising designer | Watch GT | Shanghai |
| P17 | M | 24 | Student | Garmin Forerunner 645 Music | Guangzhou |
-
*
inland cities in northern China
-
**
coastal cities in southern China
We then conducted semi-structured interviews with these participants. Since the participants lived in different cities, most interviews were through WeChat voice calls, except for P9, P13, and P14 with whom we did interviews face-to-face. The interviews usually lasted about 40 minutes. During the interviews, we asked participants for basic information including their age, occupation, location, and education, as well as questions of their general use of devices and how they experience and manage stress, such as what devices they had used, what applications in the devices they used most frequently, how they used these applications, their stress status, their perceived stress source(s), and how they deal with stress on a daily basis. We then asked about details of their use of stress-tracking technology, probing for concrete usage instances, e.g under what circumstances they checked the stress data and how, what they saw and how they experienced and understood it, what they did after seeing the data, etc. For some usage instances, we asked whether they could provide screen shots of their stress application interfaces for clarification, and some sent screen shots over WeChat to us. We followed up with some of the participants after the interviews, keeping in touch through WeChat to know more about their use of the devices, special events they found in their later use, and changes in their long-term stress status. We also collected these chats for later data analysis.
All interviews were conducted in Chinese Mandarin. With the consent of the participants, we audio-recorded the interview process and transcribed it into text for later data analysis. For privacy purposes, we anonymized their data in the transcript and in the paper.
We conducted thematic analysis inductively (Braun and Clarke, 2019) with the interview data. We first familiarized ourselves individually with the data and then extensively read, analyzed, and discussed it together. Each of us generated our own set of codes, and we compared our codes in meetings and discussed it further. We eventually identified the challenges of engaging and understanding data as the primary theme. We identified three sub-themes under this key theme, which we report in our findings. For privacy purposes, we anonymized our interview in the paper by using P# to represent the interview participants.
5. Findings
Almost all of our interview participants had already adopted and integrated their smart wearable devices into their everyday lives, so we do not have adoption issues as discussed in previous works (e.g.(Rapp and Cena, 2016)). Our participants wore their watch or bracelet all the time except for occasions when it was not feasible, such as when it was charging or they were taking a shower. All of our participants, except P2 and P10, had not bought the watch or bracelet for the primary purpose of stress-tracking, but for other reasons including sports, to not miss phone calls, or to replace a traditional watch. In fact, most were not aware of the existence of the stress-tracking feature at the time of purchase and only discovered it later while exploring the device. P17, who loved jogging, offered a typical explanation: “I didn’t even know there was a stress-tracking feature. I didn’t buy the Garmin watch for stress detection. I bought and used [the watch]. It was after I used it that I got to know this feature.” Although participants did not adopt the technology for the sake of tracking stress, they all quickly became aware of the feature as it is quite accessible, just a few clicks or swipes away.
We also found that, while participants could easily access the stress data, their understanding of it was quite varied. Only a few could meaningfully engage with it, some only had a limited understanding, while others were confused. At the same time, several participants reported that just the awareness of the existence of the stress tracking feature, not necessarily an understanding of the data, had some impact on their behavior, as similar to what is found in (Fritz et al., 2014). For P13, simply being aware that the watch constantly monitored his stress helped him to watch his temper: “So at that time when I did not have the watch, I would not deliberately control my mood or emotions, and I would just discharge. After wearing this watch, to some extent, I felt that I was monitored every day, so I couldn’t make myself too stressed, or lose my temper.” Similarly, to P10, the awareness of the feature had impact on his behavior subconsciously: “If you have [the stress tracking feature], you will subconsciously adjust yourself…” However, not being able to effectively engage with the stress data overall kept most of them from making more informed use of it. Below, we turn our focus to the challenges of stress-tracking data engagement we uncovered from the study.
5.1. Lack of Immediate Awareness
All of our participants were excited about the automatic stress-tracking feature when they began using their devices. They checked the data frequently. However, after one or two months, the novelty effect was gone, and the majority (except P12) stopped engaging with the data in a timely and frequent manner. P2’s situation is typical among our participants: “I paid close attention to the stress data when I just started wearing the watch. I checked the data at least ten times a day, but I checked it less and less frequently over time. It’s been 2 months since I started using it, and now I only check the data twice per day.”
The main reason for this was that our participants did not feel that the stress-tracking devices were helpful to raising their immediate awareness due to their natural responses to some stressful events and the limitations of the devices. First, when people encounter challenges, their mind is usually too occupied by distressing thoughts (Elkin, 2013) to break away from their minds and check the stress-tracking data. Participants (except P12) commonly reported that when they were facing challenging issues, they were overwhelmed and would intuitively focus on solving their issues rather than checking the stress data. For instance, P3 told of a time when he got assigned a challenging task at work that made him feel so stressed that instead of checking his stress level, he focused on the task first: “I was assigned with some tasks last time, when I just started my internship. wow, what the hell! I could not believe it. I then asked others a lot of questions and looked up information. I was very stressed … But when you are truly stressed, surely you don’t think of looking at the watch – you think of solving the current problem first.” Similarly, P5 noted: “When I am busy and stressed, to be honest, I don’t pay much attention to [the data]. I would probably just check the time on the watch at best.”
In rare cases, when participants were stressed to the point of physical discomfort, however, they might look at the data in that moment. As P2 reported: “When I felt that my heart was beating a bit fast, I would take a look at it. Or sometimes, when I was writing a lot of summaries or textual materials, and felt dizzy, I would take a look at it and pay more attention to stress.” However, in these cases, devices that don’t provide real-time updates made it difficult to gain an immediate awareness. For example, Huawei’s stress-tracking app only updates every half hour, and P12 reported how it caused confusion sometimes as the data was not consistent with what they felt in the moment, “You can feel your own heartbeat rising. You call a customer, or do an interview, and you feel your heartbeat rising, but when you look at your watch, the stress data has not risen.” Our participants complained how Huawei’s delay discouraged them from checking it in the moment they felt their emotions intensify. P3 said: “The problem is… I think it should update more frequently… If your stress rises again within half an hour, it can’t be monitored at all…” As such, this lack of timely feedback makes it even more difficult for people to develop an immediate awareness of their stress status.
Considering it is challenging for people to remember to use their stress-tracking devices and the importance of in-the-moment interpretation, it is critical that stress-tracking devices help raise immediate awareness. However, our participants reported that the devices failed to notify them when their stress levels were high or changed remarkably. This made our participants feel like the devices were not helpful. For example, P4 explained,
“I now feel this function is not so meaningful…since it doesn’t react or intervene in time. I often only realize that I was stressed out after my stress has gone…Such devices should help people manage real-time stress rather than just recording it, right?…Only recording it is not so helpful. I was interested in checking the data in the beginning because it seemed to be a novel function, but now, since it’s not so helpful, I don’t check it frequently anymore.”
Even P12, who was the most engaged user among all of our participants, said,
“Both devices (Huawei Watch Gt and Garmin watch) claimed they have something like a stress level reminder, but I have never been reminded…even when my stress level was as high as between 80% to 90% in Garmin…I wish they could provide an in-the-moment reminder and provide us effective, timely ways for stress management, such as providing relaxing music for stress relief…If they could remind us that our stress was high in the moment, we would have more interactions with the data and could manage our stress better…”
Users’ in-the-moment data engagement is critical for reflection (Slovák et al., 2017) and intervention. Failing to provide timely reminders hinders users from effectively managing their stress.
Most of the time, they noticed the stress data through a casual or random encounter with the technology. That is, they did not intentionally check the data; rather, they only noticed it when they were browsing other types of data (e.g., heart rates) on their devices, when casually playing with their devices when bored, or when just taking a glance at the devices while taking them off. During these casual encounters with the data, something would stand out and become noticeable, drawing their attention to it. Most commonly this was a sudden rise in stress level or a change of color. For instance, P10 once noticed an unexpected, sudden rise in his stress level after lunch after having a period of relative stability: “ I usually take a nap during the lunch break, and usually my stress is quite stable. However, there was one time, after having a nap, I saw a sudden rise of stress level when I was randomly playing with my watch. The stress was quite high.” P5’s stress data caught his attention due to its change of color: “ Yeah, on the 13th of this month, just two days ago…I saw the yellow color for the first time. The colors range from blue to green to yellow to red. Yellow means the stress is quite high. It was the first time for me to see such a high value.” As shown in these cases, the visual presentation of the data (e.g. the bright color over a dark background, the sudden change) against the participants’ personal experiences (the first time seeing it) led them notice it. As a result, while the automatic stress-tracking devices afford rich data, only a very small portion of it actually drew our participants’ attention and motivated them to interpret or reflect on it.
As these cases also illustrate, not all quantified numbers receive the same attention, or have equal importance – only some of the information stands out and matters. Data presentation or visual design plays a certain role here in filtering out this information and telling users where to draw their attention. However, the participants’ attention was usually only drawn to the data during casual encounters. Overall, our participants did not engage with the data frequently because the devices failed to raise their immediate awareness and provide effective in-the-moment interventions.
5.2. Lack of Pre-required Knowledge
When some of the data actually drew our participants’ attention and motivated them to interpret or reflect on it, most of our participants (except P12) found it challenging to make meaning out of it. This is primarily because our participants had adopted the psychological notion of stress, while the devices measured physiological stress. In other words, our participants perceived stress as a subjective concept that refers to the feeling and perception of pressure while the automatic stress-tracking devices measured stressed physiologically by analyzing bodily reactions generated by the autonomic nervous system. Unlike tracked activities, which are more straightforward for quantification and interpretation, such as steps and hours of sleep, measures such as stress are often more challenging for interpretation. The distinction between the psychological notion of stress that our participants adopted and the physiological notion of stress that the devices were based on led to barriers that prevented our participants from interpreting and making meaningful use of the tracked stress data.
Among our participants, only P12 understood that the devices were based on HRV and measured stress physiologically rather than psychologically. He managed to learn the related technical and domain knowledge early on by searching online and reading related scientific articles: “I read some articles on the Internet, and some popular science articles about what the autonomic nervous system is and the relationship between the heart rate variability and the autonomic nervous system.” So he had the basic understanding that the stress measured by the devices corresponded to how his body responded to external demands. However, our other participants were confused when interpreting the data, since it didn’t reflect their subjective feelings of stress, that is, their perceptions of pressure.
In everyday conversation, when people say “stress,” it usually means psychological stress. Asking to fill out a stress questionnaire to use this feature on some products such as Huawei’s further reinforced such a perception. Thus, our participants (except P12) felt that the device wasn’t helpful when they discovered that the measurements from the tracking technology did not match their feelings. When triggered by “feeling something”, our participants often expected to see that reflected on the tracking technology and became disappointed when it wasn’t. P11 explained: “I had just bought it, and at that period of time I was under great pressure; however, it did not show it when I felt stressed several times. I can’t remember what happened exactly. I just remember that I specifically looked at it when I’d just bought it and felt stressed but it didn’t change as much as I’d imagine.” P13 had a similar experience and thought that the stress-tracking application was inaccurate: “I found it was inaccurate when I began to use it. I was unhappy and lost my temper at that time, and I found (my measured stress was) just ’medium’ instead of ’high’.”
Moreover, some participants found that there was often a correlation between their physical activities, such as eating and exercises, and changes in their stress levels on the device, which baffled them. P1 noticed that his detected stress level rose after lunch: “I don’t think it’s accurate…Most time it is around noon, such as after eating, the stress is higher. I don’t understand why… ” Only after we explained that the device was based on HRV and that eating could put a physiological burden on the body because of digestion, did he think it made sense. Similarly, P6 thought that a lot of things in his life stressed him out and was puzzled why he did not see them being manifested in the application. He wondered what counted as stress:
“How could there be no stress in my life? I need to pay a mortgage monthly, which is definitely stressful. I’m quite worried every time I think about it. [Yet] This isn’t reflected [on the watch]. Doesn’t the situation count as stress? I don’t understand. It is not reflected anyway. If it could be reflected, I think the watch would show my stress level as yellow everyday.”
As such, the complexity of stress – e.g. involving both psychological and physiological, the external and the internal – makes interpreting its data more difficult than other tracked data, such as steps and calories, on the same device.
Oftentimes, the displayed stress range (e.g. “relax”, “normal”, “medium stress” or “high stress”) did not fall into our participants’ subjectively felt understanding. For example, P2, whose stress level had been high on the application, was doubtful as to its accuracy, as the application never displayed a “low” level, even when he was engaging in relaxing activities: “…for instance, when I go out to watch a movie, eat, or have fun, like sing karaoke with friends, of course I don’t have stress, but the watch still showed that my stress was high….” P2 even tried to recalibrate the measurement by retaking the stress questionnaire:
“I always doubted that whether that’s because my answers to the questionnaire were too pessimistic, and the watch thus set the baseline stress scale higher than how I truly felt. Thus, I unbonded it with my account…and retook the questionnaire. I intentionally answered the questions more positively than the first time. It turned out that the measured stress levels overall have indeed decreased a bit, but are still higher than how I feel. I’m confused. Why is it always high, whether I am relaxed or not?”
When evaluating whether the stress data was accurate or not, P2 was comparing the data against how he felt, i.e, his psychological stress level. The mismatch between the physiological type of stress that the device measured and the psychological stress that P2 perceived led to P2’s confusion. Similar to what is found in previous work (Epstein et al., 2016; Lazar et al., 2015), this kind of perceived inconsistency caused our participants to distrust the system and even led some to stop paying attention to it.
To make things worse, the underlying technological mechanism of the application was not so straightforward either. In our interview study, many expressed that they did not know how the stress was sensed by the devices. They had different kinds of speculations. For instance, P1 asked us, “Is it based on some kind of algorithms to calculate my stress level? Or is it monitoring my blood pressures or something through my skin?” Some assumed it corresponded to their real-time heart rate. P7’s interpretation was typical: “My understanding is that it mainly depends on your heart rate…For example, if your heart rate is relatively high, it will recognize that you may be a bit more stressed.” P3 also guessed that the measured stress level was determined by the heart rate, noting “If the stress is higher, the heartbeat will be faster.” However, this theory soon led to further confusion, as participants discovered it was not exactly right: “In the afternoon I went to other places and took a look. I had a lot of activities, but the stress was not high. I don’t think the stress is based on the heart rate.” P5 went through a similar process when he realized:“ My heart rate was high during exercise, [but] the stress value was normal.” Almost all our participants wanted to learn more about the underlying mechanism behind the stress-tracking. For instance, P17, when asked whether there was anything he did not understand, explicitly told us that he had agreed to be interviewed because he wanted to find out how the application detected stress: “How is it measured? It should be calculated by some algorithm, but I don’t know what specific algorithm it is… I’m definitely curious. That is why I accepted [your interview], because I’m curious.”
Additionally, the conditions for stress-tracking also caused more confusion, as the devices only sensed stress when one was still. P12 reported such confusion: “In the beginning, I didn’t know why my stress value was not shown at noon. It was weird. You see, the stress value usually disappeared from 11:00 to 12:00, and it came out again from 12:00 to 13:00. It was strange. Why did it usually disappear at 11 o’clock?” Only after we explained to him, did he realize it was because he was actively moving around noon that stress data was not detected. In a word, the not so intuitive mechanism for stress tracking led more confusions.
In summary, even when our participants paid attention to and tried to interpret the data, it was challenging for them to decipher it due to the mismatch between what the devices measured and what our participants considered to be stress, as well as the unclear underlying technological mechanisms of the automatic stress tracking.
5.3. Lack of Communal Support
Despite that our participants encountered challenges when trying to make sense of the stress data, they did not have easy access to related resources and communal support to help them tackle the challenges to achieve meaningful interpretations.
Alone among our participants, P12, who lives in both China and Finland, was primarily working in Finland at the time, represents a contrasting case. When working in Finland, he was situated in a social world which helped him develop a shared understanding. He described, “In our company, quite some employees are wearing sports bracelets. I feel 60 percent are wearing these, so it is also part of our topic, and we chat quite much about it…[stress tracking] is a function of our lives and is something we all use.” The socialization at P12’s company also helped him to understand the application better. He explained, “I had a cup of coffee when getting up in the morning and I felt relaxed, but my watch showed my stress was medium. So I asked my colleagues, ‘Is it because of the coffee?’ and my colleagues said it was…” Without understanding that stress is not simply a psychological concept but also a physiological one, it might not be so easy to see that drinking coffee can cause stress levels to rise; this would be even more difficult for someone to process if they actually felt relaxed after doing so. More studies have shown the importance of socialization or social processes for learning and forming shared background understanding for interpretation (e.g. (Lave et al., 1991)). P12’s experience is a case in point. Being part of such a community provides the social means to acquire related knowledge and collectively address matters of confusion.
Unfortunately, for the other participants who were all in China, corresponding stress-oriented communities of practice still have not yet formed to help develop the need for shared understanding. In China, while sports-related tracking technologies have become quite popular, and many social groups have formed, stress-tracking is still new and something of which people are rarely aware. However, P17 provides a nice example that illustrates how being part of a community of practice can make a difference. P17, who joined several sports-related groups and bought the watch for sports as most of members in the group did, reported how he could easily interpret and meaningfully read the tracked numbers for pace and heart rate:
“I just check to see if my pace matches my heart rate. If you know how to run, then (you will know), for example, if I run at a pace of 6, then my heart rate should be about 140. If I run at a pace of 6 one day but my heart rate suddenly reaches 150, I will know that my athletic ability has dropped; if my pace is 6, and my heart rate becomes lower, e.g. it was lower than the previous 140 and was 130, I will know that I have improved.”
By looking his pace and heart rate, he could easily tell whether his athletic ability had improved or not. On the other hand, as he explained, it was not easy for him to interpret the stress data: “For those who bought the watch just for running, they would not understand it at all. He may only understand that the Chinese words or number there shows something about stress, but he wouldn’t know what exactly the words or the number means. There is no way for me to know, and I believe most people wouldn’t know either. I only have a vague knowledge about it.” As such, while he could meaningfully read the running- related numbers, the stress numbers still puzzled him.
In other words, the broader social and cultural context shapes how people approach the tracked stress data and whether they understand it. P12 described the different accessibility of related learning resources about sports and about stress in China today: “For example, there are many books about running on the Internet in China, but there have not been books really about life stress…In China, I think there is still a lack of knowledge about stress management or life management.” P12’s observation was confirmed by our other participants’ experiences. P2, who adopted the watch to learn more about his stress, only knew that the watch confirmed that his stress level was generally high, but did not know how to deal with it. Some participants reported that they only wanted to know whether their stress level was normal or not, but they were usually unable to tell by just looking at the data. This is to say, due to the lack of support from the broader socio-cultural context in China, it is not easy for people to develop a meaningful reading of the data beyond whether or not their stress level is high or low.
6. Discussions and Implications
In the preceding sections, we presented a study on the use of the automatic stress tracking technology in practice, highlighting three challenges presented by its data engagement: a lack of immediate awareness preventing engagement with data in-the-moment, a lack of pre-required knowledge, domain and technical, and a lack of communal support. As shown here, these challenges are not merely associated with one’s capabilities, such as graphical literacy or quantitative analysis capabilities as pointed out in prior works (Rapp and Cena, 2016), but have to do with factors embedded in corresponding social practices of stress tracking with the technology, such as people too occupied to check the stress data in the moment when they were stressed, the technology failing to provide timely feedback and reminders, as well as the mismatch between the scientific notion of stress and the everyday use of stress. While previous works revealed similar challenges, such as a lack of the expertise needed to interpret the tracking data (Lazar et al., 2015), these challenges were mainly identified as reasons for adoption or abandonment. Data engagement itself, and its association with corresponding social practices, have not received sufficient attention. Drawing on our study of the use of the automatic stress tracking technology in particular – a relatively recent development and more complicated technology, we made data engagement our focal point, and unpacked the underlying reasons contributing to these challenges.
6.1. Casual Encounter Mode of Data
As shown in our study, one challenge of stress-tracking data engagement comes from how the data is encountered. Automatic tracking has been primarily explored to relieve the burden of manual tracking (Choe et al., 2017). However, just as Choe (Choe et al., 2014) and others (e.g. (Li et al., 2012)) have pointed out, automatic tracking can reduce engagement and awareness, which can also compromise its effects. More importantly, as revealed in our study, the users’ intention to track the data, that is often assumed in self-tracking work, is simply not there anymore for the stress tracking feature coming with the wearable device. But rather, they noticed their stress data while engaged in their daily non-stress-oriented practices. This is quite different from those who deliberately engage in an active management practice, with the tracking technology intentionally employed to facilitate a process, e.g. to help address their insomnia issues (Ravichandran et al., 2017) or manage a chronic illness such as diabetes (Mamykina et al., 2006). We can label this casual encounter mode to distinguish it from serious encounter mode in which users have the intention to track and engage with data.
When the users’ intention to track data can simply be assumed, we can reduce self-tracking data engagement to a mere analytic issue, as has often been the approach in prior work for data engagement (Li, 2009; Mamykina et al., 2006; Frost et al., 2013). In the casual encounter mode, however, users just encounter the data being collected and presented to them. Instead of pulling the data out for analysis themselves, users are pulled towards certain data that draws their attention. As a result, only a small amount of data will become “present” to them, and what data becomes present is highly dependent on how it is presented and the interactive practices users use to engage with the devices. That is, these two different modes, casual encounter and serious encounter, are totally different in terms how and what data will come to the users’ conscious attention for engagement. With more and more automatic self-tracking technologies embedded in everyday objects such as smart watches, we believe the non-intentional and casual encounter will become increasingly more commonplace. To address the data engagement issues in casual mode then, we should go beyond simply user interface revisions which would not make these devices work, and consider the practice as a whole. Below we discuss implications based on the casual encounter mode and the challenges we identified from the study.
6.2. Supporting Situated Interpretation
To support casual users engaging with the automatically collected data, there needs to be not simply new ways of data presentation or integration, but new interactive designs to help engage users in the right moment. For example, in addition to increasing tracking frequency, we, like many of our participants, think it would be valuable to provide reminder functions at appropriate times, e.g. when there is a big jump or drop in stress level, or when the stress level exceeds a certain threshold, in order to fully support the situated interpretation process. The reminder functions could help users capture, engage with, and interpret the notable data in the moment within the situated context, not from hindsight. Of course, the reminder should be provided in a peripheral and non-intrusive way, such as a vibration. Design studies should be conducted to identify what moments will be good for sending alerts and how. Also, users should be allowed to customize whether to turn on the alert and under what circumstances need the alert. What we would like to emphasize here is that this is different from integrating contextual information into the data presentation as is often approached, but is an approach that supports situated data engagement and “reflection-in-action” (Slovák et al., 2017) through which one’s experience could be directly drawn on for data interpretation and correlations.
6.3. Making Pre-required Knowledge More Available
Another challenge comes from the kind of expertise needed for data engagement. As shown in the study, the meaningful interpretation of the stress data requires necessary knowledge, including the domain knowledge of stress and the technical knowledge of the mechanism of stress monitoring. Intentional tracking and an active management practice often mean that users already have acquired the requisite knowledge needed for the use of the self-tracking technology, e.g. knowing what glucose or blood sugar level means and how they should be managed. However, with more data being automatically tracked and readily available with the wearable devices, as in our case, this prerequisite can no longer be assumed. Those who sought out the relevant resources to gain related expertise on the Internet, such as popular science articles on stress or videos related to how to use the Garmin watch, were able to overcome some of the challenges. However, for most users, despite their interest and curiosity, there was no easy access to learning resources.
Besides automatic tracking, this challenge also becomes more salient with the nature of stress itself, a physiological state that is more complex and less straightforward than other measures, such as steps. A close examination of our data suggests that sometimes the users’ perceived inaccuracy was often due to a mismatch between their subjective experiences and the qualitative presentation of the stress data. For example, when they experienced stress, users expected to see their tracked stress presentation to be “high” and match their subjective feelings, rather than “medium” or “low,” which made them perceive the technology as inaccurate; although the trend of the change in quantitative terms, the rising or dropping of the curve, actually corresponded well with their change of feelings. As such, dealing with health or physiological states similar to stress, things that can only be experienced subjectively, could cause more trust issues and add more challenges to data engagement. A meaningful reading of this kind of health data, such as stress, heart rate and sleep, thus requires more specialized knowledge and can pose more challenges for lay people. However, as the majority of the work of automatic self-tracking technologies thus far has focused on relatively more straightforward data, these challenges have not been sufficiently emphasized.
Our study also revealed that different layers of understanding can be achieved through different levels of acquired knowledge; while some simply got a clearer idea of their stress level, others, such as P12, developed a more meaningful understanding of how stress correlated to different aspects of their lives. We can call the former “direct understanding” and the latter “deepened understanding”. The difference between the two is similar to the difference between a lay person and an experienced doctor who can read a lab test result. While the lay person can only tell whether the results are normal or not (i.e., within normative range), the doctor can tell whether the patient’s condition has improved and whether the immune system has become stronger. To achieve a “deepened understanding”, a deliberate effort to acquire related knowledge and expertise is needed.
Therefore, for the automatically tracked health data, it is crucial to make the requisite knowledge more available and present it in a meaningful way to help users interpret the data. In the case of stress-tracking, it means making it more possible for users to learn more knowledge about stress, more about what stress means in the device, and more about what the mechanism for tracking is, among other things. For a more meaningful engagement and deepened understanding, design that helps people acquire related expertise becomes even more important; we could consider integrating learning materials, in terms of short texts, pictures, or videos, into the products to make them more accessible and to present them in a more compelling way. More work is needed here to specifically understand how knowledge could be presented for users to interpret their data more effectively, e.g. integrating relevant knowledge through visualization, leveraging intelligent conversation agents to support user inquiry about the data, etc.
6.4. Supporting Knowing with Communities of Practice
For meaningful data engagement, it is also important to support the social processes of ”knowing.” What we have seen in the study is that the concept of stress in science still has not been merged with the concept of stress in everyday life (Tudge, 1992), and methods for stress-tracking and stress management have still not become part of popular culture, adding to the difficulty of interpreting tracked stress data. P7’s case is the telling one. While he could easily interpret the sports data and gained a corresponding understanding from the sports community of practice, the stress data was still puzzling to him. Contemporary anthropological and sociological theorizing has already illustrated that participation in the social world is a fundamental form of human learning/knowing (Lave et al., 1991). Lave and Wenger, for instance, focus on social engagement and participation as the context in which learning occurs (Lave et al., 1991), and call the broader context, or the social world, “communities of practice”. It is through communities of practice that resources are shared, information spreads, and shared understanding is achieved. Where self-tracking technologies are concerned, we believe participation in corresponding communities of practice is the key to go from simple tracking to ”knowing.”
Recognizing the social nature of learning/knowing provides a different perspective for design, e.g. facilitating the forming of corresponding communities of practice is as important as making learning resources easily accessible. Think about the recent development of open science (Vicente-Sáez and Martínez-Fuentes, 2018) or citizen participation in the scientific inquiry processes; this provides a valuable model not simply for scientific discovery, but also for scientific education (Bonney et al., 2016), or the merging of scientific and everyday knowing. This is different from social discussions for data analysis (Feustel et al., 2018; Graham et al., 2016), and is more of a community that helps members learn through their participation and social interactions. Supporting the formation of communities of practices and user participation, could be an effective approach to the support of learning and ”knowing” of self-tracking technologies.
7. Limitations and future work
We note that although the gender ratio of our participants largely aligns with the gender ratio of smart wearable device users in China (Tencent, 2018), there is only one female participant in our study, which might have introduced gender bias. For future work, with automatic stress-tracking features becoming more available in wearable devices, it would be helpful to have more studies of this kind look into detailed usage across different sites and diverse populations. Our study also suggests promising directions for future design explorations, mainly to address the data engagement challenges identified in this work, e.g. mechanisms to support in-situ data interpretation, effective ways to integrate corresponding expertise knowledge with the data, and ways to develop communal support to help users form a shared understanding.
8. Conclusions
In this paper, we present a study of the use of a relatively recent and less straightforward stress-tracking technology-in-practice, highlighting the three primary challenges of data engagement with automatically-tracked stress data: a lack of immediate awareness, a lack of prerequisite expertise, and a lack of corresponding communities of practice. In particular, by focusing on a relatively “unfamiliar” stress-tracking technology, the study reveals that many assumptions that have been taken for granted about self-tracking technologies no longer hold true in the rapidly changing world. Reflecting on the challenges uncovered from our study as well as related works, it is clear that some elements of the technically-mediated tracking practices make a difference as far as data engagement is concerned. These include how the data is tracked /encountered – intentionally or unintentionally; who the users are – novice or expert; what is track – activity or health states; and where the users are situated – in a community of practice of corresponding tracking or not.
With the development of self-tracking technologies, and with increasingly more automatically-collected health data made easily available in our lives, it does not simply help to reduce the labor needed for tracking (Choe et al., 2014), but rather more fundamentally, to change the very mode of data engagement in practice. What we highlight through the study is that the meaning of self-tracking is not simply a matter of having the data, nor analyzing the data, but a matter of situated practices of data engagement. As shown in the study, far from being simply an interaction between users and their data, data engagement is embedded in a web of an individual’s intention for tracking, domain knowledge, technical properties, other users, and learning resources. As Kuutti put it: “Practices are wholes, whose existence is dependent on the temporal interconnection of all these elements, and cannot be reduced to, or explained by, any one single element” (Kuutti and Bannon, 2014). We argue that to understand the data engagement issues of self-tracking technologies, we should approach them as part of the whole tracking practice, a notion that assembles all these elements into a holistic unit, and does not reduce them to a mere cognitive analysis.
9. Acknowledgments
We would like to thank our participants for sharing their experiences. This work is supported by the National Key Research and Development Plan of China award number(s): 2016YFB1001200, the National Natural Science Foundation of China (NSFC) award number(s): 61672167, 61932007.
References
- (1)
- top ([n.d.]a) [n.d.]a. Share of Chinese smart bracelet brands. http://top.zol.com.cn/compositor/trend_829.html
- top ([n.d.]b) [n.d.]b. Share of Chinese smartwatch brands. http://top.zol.com.cn/compositor/trend_827.html
- Acharya et al. (2006) U Rajendra Acharya, K Paul Joseph, Natarajan Kannathal, Choo Min Lim, and Jasjit S Suri. 2006. Heart rate variability: a review. Medical and biological engineering and computing 44, 12 (2006), 1031–1051.
- Adams et al. (2014) Phil Adams, Mashfiqui Rabbi, Tauhidur Rahman, Mark Matthews, Amy Voida, Geri Gay, Tanzeem Choudhury, and Stephen Voida. 2014. Towards personal stress informatics: comparing minimally invasive techniques for measuring daily stress in the wild. In Proceedings of the 8th International Conference on Pervasive Computing Technologies for Healthcare. ICST (Institute for Computer Sciences, Social-Informatics and …, 72–79.
- Aguiar et al. (2013) Ana C Aguiar, Mariana Kaiseler, Hugo Meinedo, Traian E Abrudan, and Pedro R Almeida. 2013. Speech stress assessment using physiological and psychological measures. In Proceedings of the 2013 ACM conference on Pervasive and ubiquitous computing adjunct publication. ACM, 921–930.
- Bassett et al. (2017) David R Bassett, Lindsay P Toth, Samuel R LaMunion, and Scott E Crouter. 2017. Step counting: a review of measurement considerations and health-related applications. Sports Medicine 47, 7 (2017), 1303–1315.
- Baumer (2015) Eric PS Baumer. 2015. Reflective informatics: conceptual dimensions for designing technologies of reflection. In Proceedings of the 33rd Annual ACM Conference on Human Factors in Computing Systems. 585–594.
- Bentley et al. (2013) Frank Bentley, Konrad Tollmar, Peter Stephenson, Laura Levy, Brian Jones, Scott Robertson, Ed Price, Richard Catrambone, and Jeff Wilson. 2013. Health Mashups: Presenting statistical patterns between wellbeing data and context in natural language to promote behavior change. ACM Transactions on Computer-Human Interaction (TOCHI) 20, 5 (2013), 30.
- Bogomolov et al. (2014) Andrey Bogomolov, Bruno Lepri, Michela Ferron, Fabio Pianesi, and Alex Sandy Pentland. 2014. Daily stress recognition from mobile phone data, weather conditions and individual traits. In Proceedings of the 22nd ACM international conference on Multimedia. ACM, 477–486.
- Bonney et al. (2016) Rick Bonney, Tina B Phillips, Heidi L Ballard, and Jody W Enck. 2016. Can citizen science enhance public understanding of science? Public Understanding of Science 25, 1 (2016), 2–16.
- Braun and Clarke (2019) Virginia Braun and Victoria Clarke. 2019. Reflecting on reflexive thematic analysis. Qualitative Research in Sport, Exercise and Health 11, 4 (2019), 589–597.
- Butler (1993) Gillian Butler. 1993. Definitions of stress. Occasional paper (Royal College of General Practitioners) 61 (1993), 1.
- Caldeira et al. (2017) Clara Caldeira, Yu Chen, Lesley Chan, Vivian Pham, Yunan Chen, and Kai Zheng. 2017. Mobile apps for mood tracking: an analysis of features and user reviews. In AMIA Annual Symposium Proceedings, Vol. 2017. American Medical Informatics Association, 495.
- Castaldo et al. (2017) Rossana Castaldo, Luis Montesinos, Paolo Melillo, Sebastiano Massaro, and Leandro Pecchia. 2017. To What Extent Can We Shorten HRV Analysis in Wearable Sensing? A Case Study on Mental Stress Detection. In EMBEC & NBC 2017. Springer, 643–646.
- Chandola et al. (2006) Tarani Chandola, Eric Brunner, and Michael Marmot. 2006. Chronic stress at work and the metabolic syndrome: prospective study. Bmj 332, 7540 (2006), 521–525.
- Choe et al. (2017) Eun Kyoung Choe, Saeed Abdullah, Mashfiqui Rabbi, Edison Thomaz, Daniel A Epstein, Felicia Cordeiro, Matthew Kay, Gregory D Abowd, Tanzeem Choudhury, James Fogarty, et al. 2017. Semi-automated tracking: a balanced approach for self-monitoring applications. IEEE Pervasive Computing 16, 1 (2017), 74–84.
- Choe et al. (2014) Eun Kyoung Choe, Nicole B Lee, Bongshin Lee, Wanda Pratt, and Julie A Kientz. 2014. Understanding quantified-selfers’ practices in collecting and exploring personal data. In Proceedings of the SIGCHI Conference on Human Factors in Computing Systems. ACM, 1143–1152.
- Clark and Hirschman (1990) Michael E Clark and Richard Hirschman. 1990. Effects of paced respiration on anxiety reduction in a clinical population. Biofeedback and Self-regulation 15, 3 (1990), 273–284.
- Clawson et al. (2015) James Clawson, Jessica A Pater, Andrew D Miller, Elizabeth D Mynatt, and Lena Mamykina. 2015. No longer wearing: investigating the abandonment of personal health-tracking technologies on craigslist. In Proceedings of the 2015 ACM International Joint Conference on Pervasive and Ubiquitous Computing. ACM, 647–658.
- Cochrane (2019) Karen Anne Cochrane. 2019. Reconnecting the Body and the Mind: Technology to Support Mindfulness for Stress. In Extended Abstracts of the 2019 CHI Conference on Human Factors in Computing Systems. ACM, DC05.
- Cohen et al. (2007) Sheldon Cohen, Denise Janicki-Deverts, and Gregory E Miller. 2007. Psychological stress and disease. Jama 298, 14 (2007), 1685–1687.
- Elkin (2013) Allen Elkin. 2013. Stress management for dummies. John Wiley & Sons.
- Epstein et al. (2016) Daniel A Epstein, Monica Caraway, Chuck Johnston, An Ping, James Fogarty, and Sean A Munson. 2016. Beyond abandonment to next steps: understanding and designing for life after personal informatics tool use. In Proceedings of the 2016 CHI Conference on Human Factors in Computing Systems. ACM, 1109–1113.
- Epstein et al. (2017) Daniel A Epstein, Nicole B Lee, Jennifer H Kang, Elena Agapie, Jessica Schroeder, Laura R Pina, James Fogarty, Julie A Kientz, and Sean Munson. 2017. Examining menstrual tracking to inform the design of personal informatics tools. In Proceedings of the 2017 CHI Conference on Human Factors in Computing Systems. 6876–6888.
- Feustel et al. (2018) Clayton Feustel, Shyamak Aggarwal, Bongshin Lee, and Lauren Wilcox. 2018. People Like Me: Designing for Reflection on Aggregate Cohort Data in Personal Informatics Systems. Proceedings of the ACM on Interactive, Mobile, Wearable and Ubiquitous Technologies 2, 3 (2018), 1–21.
- Folkman and Moskowitz (2000) Susan Folkman and Judith Tedlie Moskowitz. 2000. Stress, positive emotion, and coping. Current directions in psychological science 9, 4 (2000), 115–118.
- Fritz et al. (2014) Thomas Fritz, Elaine M Huang, Gail C Murphy, and Thomas Zimmermann. 2014. Persuasive technology in the real world: a study of long-term use of activity sensing devices for fitness. In Proceedings of the SIGCHI conference on human factors in computing systems. ACM, 487–496.
- Frost et al. (2013) Mads Frost, Afsaneh Doryab, Maria Faurholt-Jepsen, Lars Vedel Kessing, and Jakob E Bardram. 2013. Supporting disease insight through data analysis: refinements of the monarca self-assessment system. In Proceedings of the 2013 ACM international joint conference on Pervasive and ubiquitous computing. ACM, 133–142.
- Gandhi et al. (2015) Shreyans Gandhi, Maryam Shojaei Baghini, and Soumyo Mukherji. 2015. Mental stress assessment-a comparison between HRV based and respiration based techniques. In 2015 Computing in Cardiology Conference (CinC). IEEE, 1029–1032.
- Graham et al. (2016) Lisa Graham, Anthony Tang, and Carman Neustaedter. 2016. Help me help you: Shared reflection for personal data. In Proceedings of the 19th International Conference on Supporting Group Work. 99–109.
- Halttu and Oinas-Kukkonen (2017) Kirsi Halttu and Harri Oinas-Kukkonen. 2017. Persuading to reflect: role of reflection and insight in persuasive systems design for physical health. Human–Computer Interaction 32, 5-6 (2017), 381–412.
- Hammen (2005) Constance Hammen. 2005. Stress and depression. Annu. Rev. Clin. Psychol. 1 (2005), 293–319.
- Harrison et al. (2015) Daniel Harrison, Paul Marshall, Nadia Bianchi-Berthouze, and Jon Bird. 2015. Activity tracking: barriers, workarounds and customisation. In Proceedings of the 2015 ACM International Joint Conference on Pervasive and Ubiquitous Computing. ACM, 617–621.
- Hernandez et al. (2014) Javier Hernandez, Pablo Paredes, Asta Roseway, and Mary Czerwinski. 2014. Under pressure: sensing stress of computer users. In Proceedings of the SIGCHI conference on Human factors in computing systems. ACM, 51–60.
- Hovsepian et al. (2015) Karen Hovsepian, Mustafa al’Absi, Emre Ertin, Thomas Kamarck, Motohiro Nakajima, and Santosh Kumar. 2015. cStress: towards a gold standard for continuous stress assessment in the mobile environment. In Proceedings of the 2015 ACM international joint conference on pervasive and ubiquitous computing. ACM, 493–504.
- Inc ([n.d.]a) Bellabeat Inc. [n.d.]a. Bellabeat Leaf. https://www.bellabeat.com/pages/leaf-urban-features
- Inc ([n.d.]b) Garmin Inc. [n.d.]b. Garmin. https://www.garmin.com
- Inc ([n.d.]c) Healbe Inc. [n.d.]c. Healbe GoBe2 smart band. https://healbe.com/
- Inc ([n.d.]d) Huawei Inc. [n.d.]d. Huawei. https://consumer.huawei.com/en/wearables/
- Inc ([n.d.]e) Samsung Inc. [n.d.]e. Samsung Galaxy Watch. https://www.samsung.com/global/galaxy/galaxy-watch/
- Inc ([n.d.]f) Spire Health Inc. [n.d.]f. Spire Stone. https://spirehealth.com/pages/stone
- Inc ([n.d.]g) Wellbe Inc. [n.d.]g. The WellBe Bracelet. https://thewellbe.com/products/the-wellbe-bracelet?variant=17684417799
- Jones and Kelly (2018) Simon L Jones and Ryan Kelly. 2018. Dealing with information overload in multifaceted personal informatics systems. Human–Computer Interaction 33, 1 (2018), 1–48.
- Kay (2014) Matthew Kay. 2014. Challenges in personal health tracking: the data isn’t enough. XRDS: Crossroads, The ACM Magazine for Students 21, 2 (2014), 32–37.
- Kelley et al. (2017) Christina Kelley, Bongshin Lee, and Lauren Wilcox. 2017. Self-tracking for mental wellness: understanding expert perspectives and student experiences. In Proceedings of the 2017 CHI Conference on Human Factors in Computing Systems. ACM, 629–641.
- Kim et al. (2018) Hye-Geum Kim, Eun-Jin Cheon, Dai-Seg Bai, Young Hwan Lee, and Bon-Hoon Koo. 2018. Stress and heart rate variability: A meta-analysis and review of the literature. Psychiatry investigation 15, 3 (2018), 235.
- Knight and Rickard (2001) Wendy EJ Knight and Nikki S Rickard. 2001. Relaxing music prevents stress-induced increases in subjective anxiety, systolic blood pressure, and heart rate in healthy males and females. Journal of music therapy 38, 4 (2001), 254–272.
- Kuutti and Bannon (2014) Kari Kuutti and Liam J Bannon. 2014. The turn to practice in HCI: towards a research agenda. In Proceedings of the SIGCHI Conference on Human Factors in Computing Systems. 3543–3552.
- Lave et al. (1991) Jean Lave, Etienne Wenger, et al. 1991. Situated learning: Legitimate peripheral participation. Cambridge university press.
- Lazar et al. (2015) Amanda Lazar, Christian Koehler, Joshua Tanenbaum, and David H Nguyen. 2015. Why we use and abandon smart devices. In Proceedings of the 2015 ACM International Joint Conference on Pervasive and Ubiquitous Computing. ACM, 635–646.
- Lazarus et al. (1985) Richard S Lazarus, Anita DeLongis, Susan Folkman, and Rand Gruen. 1985. Stress and adaptational outcomes: The problem of confounded measures. (1985).
- Lazarus and Lazarus (1991) Richard S Lazarus and Richard S Lazarus. 1991. Emotion and adaptation. Oxford University Press on Demand.
- Le Fevre et al. (2003) Mark Le Fevre, Jonathan Matheny, and Gregory S Kolt. 2003. Eustress, distress, and interpretation in occupational stress. Journal of managerial psychology 18, 7 (2003), 726–744.
- Lee and Hong (2018) Kwangyoung Lee and Hwajung Hong. 2018. MindNavigator: Exploring the Stress and Self-Interventions for Mental Wellness. In Proceedings of the 2018 CHI Conference on Human Factors in Computing Systems. ACM, 572.
- Li et al. (2018) Fenghua Li, Peida Xu, Shichun Zheng, Wenfeng Chen, Yang Yan, Suo Lu, and Zhengkui Liu. 2018. Photoplethysmography based psychological stress detection with pulse rate variability feature differences and elastic net. International Journal of Distributed Sensor Networks 14, 9 (2018), 1550147718803298.
- Li (2009) Ian Li. 2009. Beyond counting steps: Using context to improve monitoring of physical activity. (2009).
- Li et al. (2010) Ian Li, Anind Dey, and Jodi Forlizzi. 2010. A stage-based model of personal informatics systems. In Proceedings of the SIGCHI conference on human factors in computing systems. ACM, 557–566.
- Li et al. (2012) Ian Li, Anind K Dey, and Jodi Forlizzi. 2012. Using context to reveal factors that affect physical activity. ACM Transactions on Computer-Human Interaction (TOCHI) 19, 1 (2012), 1–21.
- Lin et al. (2006) James J Lin, Lena Mamykina, Silvia Lindtner, Gregory Delajoux, and Henry B Strub. 2006. Fish’n’Steps: Encouraging physical activity with an interactive computer game. In International conference on ubiquitous computing. Springer, 261–278.
- Lin et al. (2014) Wan-Hua Lin, Dan Wu, Chunyue Li, Heye Zhang, and Yuan-Ting Zhang. 2014. Comparison of heart rate variability from PPG with that from ECG. In The International Conference on Health Informatics. Springer, 213–215.
- Lu et al. (2012) Hong Lu, Denise Frauendorfer, Mashfiqui Rabbi, Marianne Schmid Mast, Gokul T Chittaranjan, Andrew T Campbell, Daniel Gatica-Perez, and Tanzeem Choudhury. 2012. Stresssense: Detecting stress in unconstrained acoustic environments using smartphones. In Proceedings of the 2012 ACM Conference on Ubiquitous Computing. ACM, 351–360.
- Lyu et al. (2015) Yongqiang Lyu, Xiaomin Luo, Jun Zhou, Chun Yu, Congcong Miao, Tong Wang, Yuanchun Shi, and Ken-ichi Kameyama. 2015. Measuring photoplethysmogram-based stress-induced vascular response index to assess cognitive load and stress. In Proceedings of the 33rd Annual ACM Conference on Human Factors in Computing Systems. ACM, 857–866.
- MacLean et al. (2013) Diana MacLean, Asta Roseway, and Mary Czerwinski. 2013. MoodWings: a wearable biofeedback device for real-time stress intervention. In Proceedings of the 6th international conference on PErvasive Technologies Related to Assistive Environments. ACM, 66.
- Malik (1996) Marek Malik. 1996. Heart rate variability: Standards of measurement, physiological interpretation, and clinical use: Task force of the European Society of Cardiology and the North American Society for Pacing and Electrophysiology. Annals of Noninvasive Electrocardiology 1, 2 (1996), 151–181.
- Mamykina et al. (2006) Lena Mamykina, Elizabeth D Mynatt, and David R Kaufman. 2006. Investigating health management practices of individuals with diabetes. In Proceedings of the SIGCHI conference on Human Factors in computing systems. ACM, 927–936.
- Matthews and Gump (2002) Karen A Matthews and Brooks B Gump. 2002. Chronic work stress and marital dissolution increase risk of posttrial mortality in men from the Multiple Risk Factor Intervention Trial. Archives of Internal Medicine 162, 3 (2002), 309–315.
- Matthews et al. (2015) Mark Matthews, Stephen Voida, Saeed Abdullah, Gavin Doherty, Tanzeem Choudhury, Sangha Im, and Geri Gay. 2015. In situ design for mental illness: Considering the pathology of bipolar disorder in mhealth design. In Proceedings of the 17th International Conference on Human-Computer Interaction with Mobile Devices and Services. 86–97.
- Melillo et al. (2011) Paolo Melillo, Marcello Bracale, and Leandro Pecchia. 2011. Nonlinear Heart Rate Variability features for real-life stress detection. Case study: students under stress due to university examination. Biomedical engineering online 10, 1 (2011), 96.
- Munla et al. (2015) Nermine Munla, Mohamad Khalil, Ahmad Shahin, and Azzam Mourad. 2015. Driver stress level detection using HRV analysis. In 2015 International Conference on Advances in Biomedical Engineering (ICABME). IEEE, 61–64.
- Paredes and Chan (2011) Pablo Paredes and Matthew Chan. 2011. CalmMeNow: exploratory research and design of stress mitigating mobile interventions. In CHI’11 Extended Abstracts on Human Factors in Computing Systems. ACM, 1699–1704.
- Patel and O’Kane (2015) Misha Patel and Aisling Ann O’Kane. 2015. Contextual influences on the use and non-use of digital technology while exercising at the gym. In Proceedings of the 33rd Annual ACM Conference on Human Factors in Computing Systems. 2923–2932.
- Pickering (2001) Thomas G. Pickering. 2001. Mental stress as a causal factor in the development of hypertension and cardiovascular disease. Current Hypertension Reports 3, 3 (2001), 249–54.
- Ploderer et al. (2014) Bernd Ploderer, Wolfgang Reitberger, Harri Oinas-Kukkonen, and Julia van Gemert-Pijnen. 2014. Social interaction and reflection for behaviour change.
- Praissman (2008) Sharon Praissman. 2008. Mindfulness-based stress reduction: A literature review and clinician’s guide. Journal of the American Academy of Nurse Practitioners 20, 4 (2008), 212–216.
- Ptakauskaite et al. (2018) Nora Ptakauskaite, Anna L Cox, and Nadia Berthouze. 2018. Knowing what you’re doing or knowing what to do: how stress management apps support reflection and behaviour change. In Extended Abstracts of the 2018 CHI Conference on Human Factors in Computing Systems. ACM, LBW599.
- Rapp and Cena (2016) Amon Rapp and Federica Cena. 2016. Personal informatics for everyday life: How users without prior self-tracking experience engage with personal data. International Journal of Human-Computer Studies 94 (2016), 1–17.
- Rapp et al. (2018) Amon Rapp, Alessandro Marcengo, Luca Buriano, Giancarlo Ruffo, Mirko Lai, and Federica Cena. 2018. Designing a personal informatics system for users without experience in self-tracking: a case study. Behaviour & Information Technology 37, 4 (2018), 335–366.
- Ravichandran et al. (2017) Ruth Ravichandran, Sang-Wha Sien, Shwetak N Patel, Julie A Kientz, and Laura R Pina. 2017. Making sense of sleep sensors: How sleep sensing technologies support and undermine sleep health. In Proceedings of the 2017 CHI Conference on Human Factors in Computing Systems. ACM, 6864–6875.
- Rooksby et al. (2014) John Rooksby, Mattias Rost, Alistair Morrison, and Matthew Chalmers. 2014. Personal tracking as lived informatics. In Proceedings of the SIGCHI conference on human factors in computing systems. ACM, 1163–1172.
- Rosengren et al. (2004) Annika Rosengren, Steven Hawken, Stephanie Ôunpuu, Karen Sliwa, Mohammad Zubaid, Wael A Almahmeed, Kathleen Ngu Blackett, Chitr Sitthi-amorn, Hiroshi Sato, Salim Yusuf, et al. 2004. Association of psychosocial risk factors with risk of acute myocardial infarction in 11119 cases and 13648 controls from 52 countries (the INTERHEART study): case-control study. The Lancet 364, 9438 (2004), 953–962.
- Sanches et al. (2010) Pedro Sanches, Kristina Höök, Elsa Vaara, Claus Weymann, Markus Bylund, Pedro Ferreira, Nathalie Peira, and Marie Sjölinder. 2010. Mind the body!: designing a mobile stress management application encouraging personal reflection. In Proceedings of the 8th ACM conference on designing interactive systems. ACM, 47–56.
- Selye (1965) Hans Selye. 1965. The stress syndrome. The American Journal of Nursing (1965), 97–99.
- Sharmin et al. (2015) Moushumi Sharmin, Andrew Raij, David Epstien, Inbal Nahum-Shani, J Gayle Beck, Sudip Vhaduri, Kenzie Preston, and Santosh Kumar. 2015. Visualization of time-series sensor data to inform the design of just-in-time adaptive stress interventions. In Proceedings of the 2015 ACM International Joint Conference on Pervasive and Ubiquitous Computing. ACM, 505–516.
- Slovák et al. (2017) Petr Slovák, Christopher Frauenberger, and Geraldine Fitzpatrick. 2017. Reflective practicum: A framework of sensitising concepts to design for transformative reflection. In Proceedings of the 2017 CHI Conference on Human Factors in Computing Systems. 2696–2707.
- Steptoe (1991) Andrew Steptoe. 1991. Invited review: The links between stress and illness. Journal of psychosomatic research 35, 6 (1991), 633–644.
- Sun et al. (2010) Feng-Tso Sun, Cynthia Kuo, Heng-Tze Cheng, Senaka Buthpitiya, Patricia Collins, and Martin Griss. 2010. Activity-aware mental stress detection using physiological sensors. In International conference on Mobile computing, applications, and services. Springer, 282–301.
- Tencent (2018) Tencent. 2018. 2015 Smart Wearable Devices Market White Paper. https://cloud.tencent.com/developer/article/1154297
- Tudge (1992) Jonathan Tudge. 1992. Vygotsky, the zone of proximal development, and peer collaboration: Implications for classroom practice. (1992).
- Vicente-Sáez and Martínez-Fuentes (2018) Rubén Vicente-Sáez and Clara Martínez-Fuentes. 2018. Open Science now: A systematic literature review for an integrated definition. Journal of business research 88 (2018), 428–436.
- Vildjiounaite et al. (2018) Elena Vildjiounaite, Johanna Kallio, Vesa Kyllönen, Mikko Nieminen, Ilmari Määttänen, Mikko Lindholm, Jani Mäntyjärvi, and Georgy Gimel’farb. 2018. Unobtrusive stress detection on the basis of smartphone usage data. Personal and Ubiquitous Computing 22, 4 (2018), 671–688.
- Vizer (2009) Lisa M Vizer. 2009. Detecting cognitive and physical stress through typing behavior. In CHI’09 Extended Abstracts on Human Factors in Computing Systems. ACM, 3113–3116.
- Yu et al. (2017) Bin Yu, Mathias Funk, Jun Hu, and Loe Feijs. 2017. StressTree: a metaphorical visualization for biofeedback-assisted stress management. In Proceedings of the 2017 conference on designing interactive systems. 333–337.