The Evolution of the Luminosity Function for Luminous Compact Blue Galaxies to z=1
Summary of Observations
Abstract
Luminous Compact Blue Galaxies (LCBGs) are compact, star-forming galaxies that are rarely observed in the local universe but abundant at z=1. This increase in LCBG number density over cosmic lookback time roughly follows the increase in the star formation rate density of the universe over the same period. We use publicly available data in the COSMOS field to study the evolution of the largest homogeneous sample of LCBGs to date by deriving their luminosity function in four redshift bins over the range . We find that over this redshift range, the characteristic luminosity (M∗) increases by 0.2 mag, and the number density increases by a factor of four. While LCBGs make up only about of galaxies more luminous than M18.5 at , they constitute roughly at z0.9. The strong evolution in number density indicates that LCBGs are an important population of galaxies to study in order to better understand the decrease in the star formation rate density of the universe since .
1 Introduction
The 4-meter telescope at the Kitt Peak National Observatory identified a number of point sources whose optical emission lines did not match that of stars or QSOs (Koo & Kron, 1988). These compact objects were resolved in early Hubble Space Telescope observations using the Wide Field Planetary Camera (Koo et al., 1994), identifying compact, narrow emission line galaxies (CNELGs). Photometric and spectroscopic studies (Phillips et al., 1997; Guzmán et al., 1997) of these CNELGs in the flanking fields of the Hubble Deep Field found they evolve rapidly and contribute significantly to the star formation rate density of the universe near z=1. Werk et al. (2004) showed that the number density of these objects out to z=0.045 is roughly an order of magnitude lower than their number density at z=0.85 (Phillips et al., 1997), making them one of the most rapidly evolving galaxy types in the universe (Rawat et al., 2007). LCBGs’ contribution to star formation rate density at z=1 (Guzmán et al., 1997), combined with the correlation between their change in number density and the evolution in the star formation rate density of the universe from the local universe to z=1 means understanding of the nature and evolution of these galaxies provides important insight to galaxy evolution as a whole.
Compact narrow emission line galaxies (Koo et al., 1994, 1995; Guzmán et al., 1996, 1998, CNELGs), faint compact galaxies (Phillips et al., 1997; Guzmán et al., 1997), and blue nucleated galaxies (Schade et al., 1995, 1996) are three classes of galaxies that have similar star formation rates, sizes and colors. While heterogeneous in terms of detailed morphology, these samples are similar in color and surface brightness, and for convenience were relabeled Luminous Compact Blue Galaxies (LCBGs). LCBGs are defined by having rest-frame M mag, B-V0.6 mag , and SBe(B) mag arcsec-2 (Werk et al., 2004) so that most galaxies in the original three samples are included, and future LCBG studies can target sources with the same selection criteria at all redshifts.
Other galaxy types that overlap with LCBGs in luminosity, color and surface brightness, have previously been described in the literature. Cardamone et al. (2009) showed that "Green Pea" galaxies, detected by the Galaxy Zoo project, overlap with LCBGs in blue luminosity, morphology, stellar mass, and metallicity. Higher mass LCBGs also overlap with Ultraviolet Luminous Galaxies (UVLGs), which were identified by Heckman et al. (2005) as being local counterparts to Lyman Break Galaxies. Guzman et al. (2003) and Hoyos et al. (2004) have both suggested that LCBGs could be low mass, lower redshift counterparts to the high redshift Lyman Break Galaxies. Phillips et al. (1997) and Guzmán et al. (1997) noted that 40% of their sample resemble local, vigorously star-forming HII galaxies. LCBGs also seem to be similar to Extreme Emission Line Galaxies (Atek et al., 2014), a class of low-mass star burst galaxies observed between 1.0<z<2.0 that contribute up to 34% of the total star formation of emission line selected galaxies. Finally, we note that LCBGs are more massive (Guzmán et al., 1997; Garland, 2004; Tollerud et al., 2010), luminous (Garland, 2004), and higher in metallicity (Tollerud et al., 2010) than Blue Compact Dwarf galaxies (BCDs), and are therefore a distinct population.
Previous studies of LCBGs have concentrated on small snapshots in time, often being limited to low or intermediate redshift. Intermediate redshift (z0.5) studies have looked at LCBG morphology (Noeske et al., 2006) and spectral properties (Tollerud et al., 2010), environment (Crawford et al., 2005, 2014, 2016; Randriamampandry et al., 2017), and number density (Phillips et al., 1997; Guzmán et al., 1997). LCBGs make up about 50% of the so-called Butcher-Oemler population of blue galaxies in clusters between redshift, 0.55<z<1 (Crawford et al., 2005), and are likely on their initial descent into a cluster (Crawford et al., 2014). Cluster and field populations of LCBGs show no significant difference in size, mass, luminosity, star formation rate, or metallicity (Crawford et al., 2016). Randriamampandry et al. (2017) found cluster LCBGs have a lower dynamical to stellar mass ratio than field LCBGs at intermediate redshift, indicating the mass of field LCBGs is more highly dominated by dark matter. Guzmán et al. (1997) and Phillips et al. (1997) found that LCBGs are similar to local HII star-forming galaxies, they constitute 45% of the star formation rate density and 20% of the galaxy population at z=0.6, and show no evolution in specific star formation rate. Tollerud et al. (2010) found LCBGs have a wide range of metallicities and show no correlation between size and stellar mass (M∗).
Studies of local LCBGs have looked at number density (Werk et al., 2004), neutral gas content (Guzmán et al., 1997; Rabidoux et al., 2018), kinematics from three-dimensional optical spectroscopy (Pérez-Gallego et al., 2011), and morphology and environment (Garland et al., 2015). They have shown that LCBGs are locally rare (Werk et al., 2004), are rotationally supported (Rabidoux et al., 2018; Pérez-Gallego et al., 2011), and their increase in star formation is not exclusively due to galaxy mergers (Rabidoux et al., 2018; Garland et al., 2015; Pérez-Gallego et al., 2011). Garland et al. (2015) report that local LCBGs fit into roughly three categories: 20% have star formation that is likely triggered by strong interactions, 40% are clumpy spiral galaxies whose star formation is triggered by smoothly accreted gas from tidally disrupted companions or the intracluster medium, and 40% are non-clumpy, non-spiral field galaxies with centrally concentrated morphologies, smaller effective radii, and smaller stellar masses.
All previous studies of LCBGs show they are rapidly evolving, star-forming, compact galaxies. They are present in both dense and open environments out to at least a redshift of z=1. But previous studies of LCBGs have been limited in volume, concentrating either on small areas of the sky or small redshift ranges. LCBG studies using much larger samples provide robust statistics of the physical properties of these objects (e.g. average star formation rates, stellar masses, environment etc.) and can determine how comparable local LCBGs are to LCBGs at z=1.
We seek a comprehensive picture of the evolution of the number of LCBGs out to z=1 to supplement past and future studies. This study accomplishes that by using a large homogeneous sample of galaxies to create a catalog of LCBGs that is more than an order of magnitude larger than any previous LCBG catalog, and determines the evolution of their number density by deriving the luminosity function in four redshift bins between . In Section 2 we describe the data set we used, and how we selected LCBGs from it. In Section 3 we describe the 1/VMax method which we used to generate the luminosity function. In Section 4 we discuss how our calculation of the luminosity function for the total galaxy population compares to previous work. In Section 5 we discuss the results from the LCBG luminosity function and compare them to other star-forming galaxy populations. Finally, in Section 6 we summarize our results. Throughout this paper we adopt H0=70 km s-1 Mpc-1, , and we use the Vega magnitude system.
2 Data
We use data obtained as part of the Cosmic Evolution Survey (COSMOS, Scoville et al., 2007) with photometry rederived by the Galaxy and Mass Assembly (GAMA111GAMA is a joint European-Australasian project based around a spectroscopic campaign using the Anglo-Australian Telescope. The GAMA input catalogue is based on data taken from the Sloan Digital Sky Survey and the UKIRT Infrared Deep Sky Survey. Complementary imaging of the GAMA regions is being obtained by a number of independent survey programmes including GALEX MIS, VST KiDS, VISTA VIKING, WISE, Herschel-ATLAS, GMRT and ASKAP providing UV to radio coverage. GAMA is funded by the STFC (UK), the ARC (Australia), the AAO, and the participating institutions. The GAMA website is http://www.gama-survey.org/ .) survey team. COSMOS is an HST Treasury Project (Scoville et al., 2007) that used 590 orbits on the Hubble Space Telescope (HST) Advanced Camera for Surveys to survey a two square degree equatorial field. One of the key features of the COSMOS field is its accessibility by most astronomical facilities. This has allowed for surveys across the electromagnetic spectrum from radio (Smolčić et al., 2017) to x-ray (Civano et al., 2016). The GAMA team are amassing large multi-wavelength photometric and spectroscopic datasets across numerous regions of the sky to study galaxy evolution. They have adopted the publicly available data from the COSMOS survey as their G10 region (Davies et al., 2015; Andrews et al., 2017), the GAMA region at 10 hours right ascension.
2.1 Photometric data
The photometric dataset obtained by the COSMOS team covers the central 1 degree2 of the 2 degree2 COSMOS field, and includes observations from UV (Zamojski et al., 2007), optical (Capak et al., 2007; Taniguchi et al., 2007, 2015), and infrared (McCracken et al., 2012; Sanders et al., 2007; Oliver et al., 2012) bands. The GAMA team used their Lambda-Adaptive Multi-Band Deblending Algorithm in R (LAMBDAR Wright et al., 2016) to calculate consistent total flux photometry for all sources across all images to make this rederivation consistent with the other GAMA fields. We use the CFHT u∗ and Subaru Bj, VJ, r+, i+, z+ photometry to calculate rest-frame magnitudes and colors, and the effective radii measurements were taken from HST F814W images (Tasca et al., 2009) and matched to sources within 0.1".
Our photometric sample includes galaxies with 15i22.5, roughly matching the photometric completeness limit for the original COSMOS observations (Capak et al., 2007). We adopt this photometric completeness limit in our study to avoid the need for a photometric incompleteness correction when deriving the luminosity function. The GAMA team developed a master star classification which adopts the COSMOS 2015 criteria for stellar classification (Laigle et al., 2016). This includes spectral energy distribution (SED) fitting, detection in infrared passbands, and proximity to the stellar sequence in BzK color space. They then apply a threshold in the size magnitude distribution to further discriminate between stars and galaxies. For more see section 3.5 of Andrews et al. (2017). Laigle et al. (2016) has a classification for bright x-ray sources which Andrews et al. (2017) also suggests excluding from the sample as they likely contain some level of AGN activity which could lead to erroneous photometry for the galaxy.
2.2 Spectroscopic Data
We used a compilation of spectroscopic redshifts gathered and reanalyzed by the GAMA team. The catalog uses redshift information from GAMA’s AUTOZ (Baldry et al., 2014), zCOSMOS-bright 20k (Lilly et al., 2009), PRIsm MUlti-object Survey (Coil et al., 2011; Cool et al., 2012), VIMOS VLT Deep Survey (Garilli et al., 2008), Sloan Digital Sky Survey (Ahn et al., 2014), and the 30 band photometric redshift catalog (Ilbert et al., 2009) to determine the best-fit redshift for each object. Full details of their reanalysis can be found in Davies et al. (2015). Objects were assigned quality flags of 1 to 4, 1 being robust, moderate resolution spectroscopic redshifts from VIMOS or SDSS, 2 being spectroscopic redshifts from the PRIMUS survey, 3 being uncertain spectroscopic redshifts, and 4 being photometric redshifts. We use the robust sample from Davies et al. (2015), which includes 16,130 objects with flags 1 & 2 . We make corrections for incompleteness for 5,938 objects without spectroscopic redshifts which we discuss further in Section 3.2.
2.3 Rest-frame properties
To identify LCBGs, we had to determine their rest-frame properties including the absolute magnitude, surface brightness, and color of all galaxies in the GAMA G10 catalog.
Absolute magnitudes were calculated using the equation:
| (1) |
In Equation 1 Mref is the reference band absolute magnitude, or the band in which we want to generate the luminosity function (in this case the Johnson B-band). mobs is the observed apparent magnitude of the object, selected to be closest to the rest frame B-band apparent magnitude for each object. DM is the distance modulus at redshift z defined as , where DL is the luminosity distance for our adopted cosmology. KC is the k-correction defined as:
| (2) |
where kref(z) is the k-correction for the reference band assuming the object is at redshift z, mobs(z) is the observed apparent magnitude, and mref(z) is the reference band apparent magnitude. The SED superscript indicates these values are taken from galaxy spectral template fits to observed galaxy fluxes using the standard kcorrect package222http://kcorrect.org/ (Blanton & Roweis, 2007). A detailed description of the spectral templates used and how they are used can be found in Blanton & Roweis (2007). This method for calculating rest-frame absolute magnitude roughly follows the procedure from Ilbert et al. (2005).
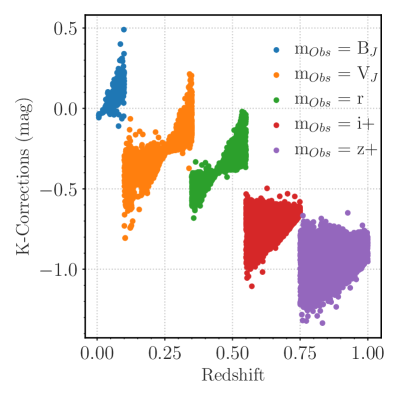
We calculated the absolute magnitude using the observed filter closest to the rest-frame B band to minimize the size of k-correction applied to the data. At higher redshifts, the k-correction becomes more dependent on the spectral model with an increased chance of error due to mismatched models. Figure 1 shows the range of k-corrections used at each redshift and how the distribution of the k-corrections narrows the closer the observed band is to the rest frame B-band
We also derived photometric offsets for the different filter responses between the G10 apparent magnitudes and the apparent magnitudes estimated by integrating the SED from the kcorrect code (Blanton & Roweis, 2007). Listed in Table 1, these corrections were applied to the observed apparent magnitudes.
We also use Equation 1 to calculate the rest-frame V-band absolute magnitude. We then used the rest-frame B-band and V-band absolute magnitudes to calculate the color ((B-V)0) for each source.
| filter | offset |
|---|---|
| Bj…….. | 0.02 |
| Vj…….. | 0.05 |
| r+…….. | 0.04 |
| i+…….. | 0.01 |
| z+…….. | None |
The effective surface brightness in mag arcsec-2 was calculated using the equation below:
| (3) |
where MB is the total absolute magnitude in the B band, and Re is the effective (or half-light) radius from Tasca et al. (2009) in units of kiloparsecs. This equation, taken from Graham & Driver (2005), was used to leverage our previous calculation of rest-frame absolute magnitudes, and takes into account the effects of surface brightness dimming.
2.4 Sample Selection
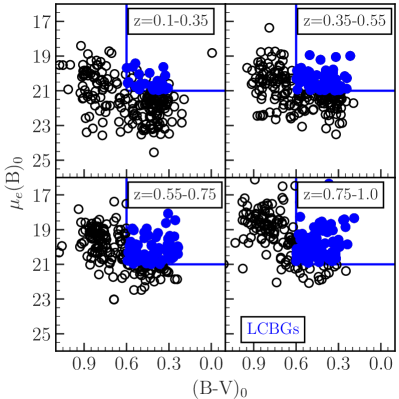
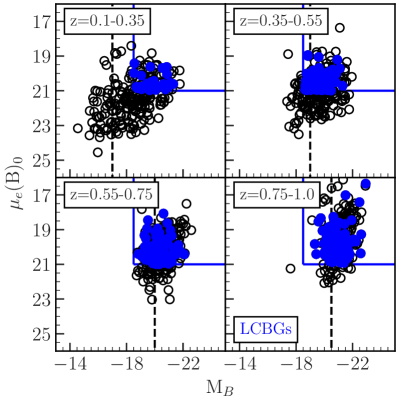
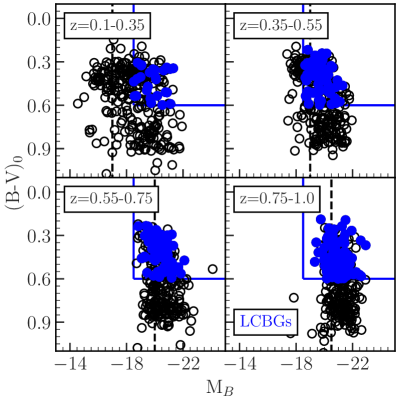
As stated previously, Werk et al. (2004) define LCBGS as galaxies with M18.5 mag, 21 mag arcsec-2, and (B-V)0.6 mag. This combination of parameters provides the best distinction between intermediate redshift LCBGs and low luminosity irregular galaxies, elliptical galaxies, and normal spiral galaxies (See Section 1 for more information). The selection criteria were based on source photometric properties to allow for selection at all redshift ranges and do not limit the sample in morphology or size.
Figures 2, 3, and 4 show where LCBGs fall in -Color, -MB and Color-MB space respectively. Werk et al. (2004) point out that LCBGs are not distinct galaxies in the luminosity-color-surface brightness parameter space, but exist at the extreme end of the continuum of galaxies in said space. It is clear from these figures that not all galaxies in the demarcated regions are LCBGs because they do not meet the third selection criteria that is not displayed in the given plot. The dashed line in Figures 3 and 4 also shows the absolute magnitude bias limit cutoff (Ilbert et al., 2004) discussed further in Section 4
3 Luminosity Function Estimate
3.1 Luminosity Function Estimator
The luminosity function is defined as the number of galaxies per comoving volume, per magnitude bin, and is most often characterized using the Schecter parameterization (Schechter, 1976). In magnitudes, the Schechter Function is defined as
| (4) | |||
where is the characteristic number density of galaxies per unit volume per unit magnitude, M∗ is the characteristic magnitude where the luminosity function transitions from an exponential into a power law, and is the characteristic slope of that power law describing the faint end of the luminosity function.
Several methods have been developed to estimate the luminosity function (Schmidt, 1968; Lynden-Bell, 1971; Turner, 1979; Choloniewski, 1986; Efstathiou et al., 1988) including the C+ method (Zucca et al., 1997), a non-parametric, cumulative estimator, and the Sandage-Tammann and Yahil (STY) method (Tammann et al., 1979), a maximum likelihood estimator. For our analysis we used the 1/VMax method (Schmidt, 1968) which counts galaxies within a known volume. We followed the method described by Willmer et al. (2006) and Ilbert et al. (2005), which is briefly summarized below. The integral luminosity function for a given absolute magnitude is defined as:
| (5) |
where is the weighting applied to correct for incompleteness (discussed in Section 3.2), NG is the number of galaxies in the absolute magnitude range MMbright and V is the maximum comoving volume within which a galaxy i with absolute magnitude can be detected in the survey, defined as:
| (6) |
Here again, z is redshift, and is the solid angle of the survey region. In a magnitude limited survey, zmin,i and zmax,i are defined by:
| (7) |
| (8) |
where zmin and zmax are the lower and upper limits of the redshift bin the object occupies, and and are the redshifts at which an object with absolute magnitude Mi would no longer fall in the apparent magnitude limits of the survey. We adopt Poissonian errors to describe the uncertainty in each of our luminosity function bins using:
| (9) |
3.2 Weighting
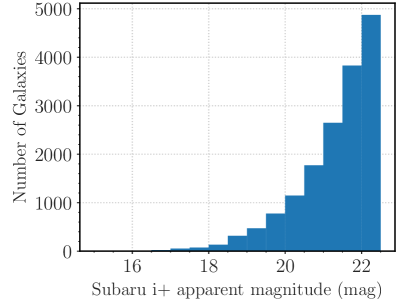
We must correct for galaxies in the survey volume that have not been directly counted due either to photometric incompleteness (missing faint objects) or spectroscopic incompleteness (objects without spectroscopic redshifts). These incompleteness corrections are applied to all galaxies, including LCBGs, and all incompleteness corrections are calculated in Subaru i+ band apparent magnitude bins of width 0.5 mag. The same weight is applied to all galaxies in an apparent magnitude bin and we have included Figure 5 to show how many sources are in each apparent magnitude bin.
We include additional incompleteness corrections for objects in the survey for which we cannot calculate the surface brightness (objects that do not have a radius measurement) or color (objects that do not have a B or V band magnitude listed either due to the object not being visible in a given band or failure in the software) which only effect LCBG selection and therefore only apply to LCBGs. We adopted a similar photometric selection criteria to zCOSMOS, namely 15 magi22.5 mag to maximize the number of sources with spectroscopic redshifts. This apparent magnitude range is also brighter than the photometric completeness limit of the G10 catalog, m=24.5 mag (Andrews et al., 2017), and we therefore do not adopt a photometric incompleteness correction.
We made two corrections to compensate for spectroscopic incompleteness. First, we corrected for the photometrically identified galaxies that were not targeted in a spectroscopic survey. This weight is labeled as the target sample rate, and defined as:
| (10) |
where is the number of objects observed in the photometric catalog, and is the number of objects targeted in the spectroscopic survey. As mentioned above, the spectra from this survey came primarily from the zCOSMOS survey (Lilly et al., 2009), and the PRIMUS survey (Coil et al., 2011). The zCOSMOS and PRIMUS surveys randomly targeted galaxies with mi<22.5 mag and since the objects were randomly targeted, we do not make any corrections to the target sampling rate based on apparent magnitude or color.
We also corrected for objects that were targeted in the spectroscopic survey, but whose redshifts were unable to be definitively determined. This spectroscopic sampling rate weighting is defined as:
| (11) |
where is the number of galaxies observed spectroscopically, and is the number of galaxies where the redshift was indeterminable. If we define the number of galaxies with secure redshifts as , then the total weight of each object, , is the multiple of the two weights described above:
| (12) |
The likelihood of obtaining a secure redshift varies with apparent magnitude as mentioned in Lilly et al. (2009), so we calculate weights in Subaru i+-band magnitude bins of 0.5. Weights generally range from 1.04 to 1.6. Six very bright objects have corrections above 5.5 due to small spectroscopic completeness of the brightest galaxies. Only 5 of the 34 brightest galaxies had secure redshifts. Only 11 of the 34 brightest galaxies were targeted in a spectroscopic survey, and of those, 6 of the 11 targeted sources did not have secure redshifts. The low rate of spectroscopic coverage of the brightest sources may be due confusion or crowding of the brightest sources.
We use a similar method to determine the extra weights for LCBGs. As mentioned in Section 2.1 in order to determine surface brightness to select for LCBGs we matched the photometry catalog from Andrews et al. (2017) to the morphology catalog from Tasca et al. (2009). Since it’s possible not all sources match between the two catalogs, the weight for surface brightness is:
| (13) |
where N is the number of galaxies identified in the photometric catalog N is the number of galaxies that did not match between the photometric and morphological catalog.These corrections typically varied between 1.3 and 1.8 with only three LCBGs falling in an apparent magnitude bin that has a correction greater than 2.
Finally, the color correction was applied when objects did not have a listed B and V-band apparent magnitude. The weight for color is:
| (14) |
where N did not have B and V-band apparent magnitudes. The largest correction for color is 1.01 and most galaxies LCBGs did not have any correction for color. The total weight for LCBGs then becomes
| (15) |
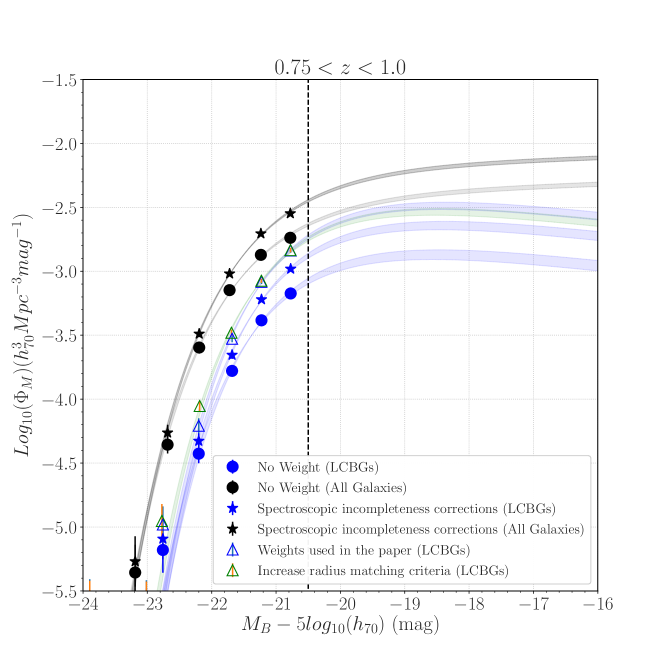
In Figure 6 we show the affects of our weighting described in Section 3.2 on the luminosity function in the highest redshift bin. We started by calculating the luminosity function for both the total galaxy population and LCBGs using no weighting in our incompleteness correction. Then we added weights to correct for spectroscopic incompleteness for the total galaxy population and the LCBG population. These were the only weights added to the total galaxy population, and were the final weights when calculating the total galaxy luminosity function. Finally we generated the luminosity function for LCBGs, adding weights to correct for galaxies without a calculated B-V color and galaxies for which we were not able to calculate the effective surface brightness. After applying all of the weights in the paper the number density of LCBGs increase by 129% in the highest redshift bin Comparisons to previous measurements of the number density will be made in later sections.
We also calculated the luminosity function for LCBGs after relaxing the matching criteria for the effective radius. As mentioned in 2.1 the effective radii measurements were matched to sources within 0.1". If we relax the matching criteria to sources within 0.3" we find more sources match, though we do get some cases where the same object in the morphology catalog is matched to multiple sources in the photometric/spectroscopic catalog. We then calculated the luminosity function with this relaxed matching criteria and plotted it in Figure 6. The figure shows that the luminosity function of LCBGs with the applied weighting resembles the luminosity function generated with this relaxed matching criteria. The number density calculated using our weighting is 6.4% higher than the number density calculated using the relaxed radius matching criteria in the highest redshift bin. The 68% confidence intervals for the number density calculated using each method do overlap, and as such we believe that our derived luminosity function is robust to the details of how we match sources and our weighting scheme.
4 Comparison to Previous Work
We calculated the luminosity function of all galaxies in the COSMOS field in four bins between . We specifically adopt the redshift bins from a previous study on the COSMOS field carried out by Zucca et al. (2009) of , , , and . We adopt these redshift bins to make a direct comparison and because they contain enough LCBGs to calculate a robust luminosity function in the lowest redshift bin. We also adopt the bias limit (Ilbert et al., 2004) cut-off used in Zucca et al. (2009) when calculating the luminosity function in each redshift bin. The bias limit is the absolute magnitude at which a subsample of galaxies would be detectable in a magnitude limited survey, while the rest of the galaxies would be undetected. This bias leads to an underestimate of the faint end slope when calculating the luminosity function using the 1/Vmax method. Table 2 lists these bias limits calculated for highest redshift in each redshift bin of this survey. The bias limit in high redshift samples does not allow us to estimate the faint end slope of the luminosity function properly so we fix the value of in all redshift bins using the weighted average value in the bins z= and . These values are for all galaxies, and for LCBGs.
| z-bin | Bias Limit |
|---|---|
| MB, mag | |
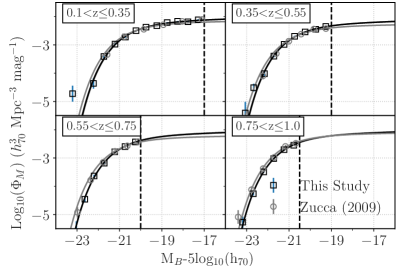
Figure 7 shows the points from our 1/Vmax calculation of the luminsoity function for all galaxies plotted at the average absolute magnitude of their bin, with the error bars on each point indicating the Poisson errors as mentioned in Section 3. We used a Markov Chain Monte Carlo (MCMC) sampler (Foreman-Mackey et al., 2013) to fit a Schecter function to the data points with the results shown in Table 3. Figure 7 also shows the points from Zucca et al. (2009) using the C+ method (Zucca et al., 1997), along with the Schechter function estimated by Zucca et al. (2009) using the STY method in gray. The fits in Figure 7 use a constant value for the faint end slope ( for Zucca et al. (2009) and for this study). The curves match within the error.
We compare the Schechter function parameters fit to our calculation to those from Zucca et al. (2009) in Table 3. The confidence values for and M are generally not in agreement, but Zucca et al. (2009) notes that their errors on these parameters are underestimates, and we note that and M are degenerate values that depend on the value selected for . Therefore, we calculate the luminosity density (jB) to compare values derived from both studies while avoiding the degeneracy of and M. The luminosity density is defined as:
| (16) |
where is the characteristic luminosity calculated from the characteristic magnitude, is the upper incomplete gamma function, and L is the luminosity calculated from the absolute magnitude limits defined above. Calculation of the luminosity density requires integrating the product of the luminosity and the Schechter function. We integrated from M23.5 mag, where we have a steep drop off in the number of sources in our catalog, to M18.5 mag, the limiting luminosity in the LCBG selection criteria. The luminosity density values between the two fits agree within in the first three redshift bins and only diverge significantly in the last bin.
5 The LCBG Luminosity Function
| z-bin | Number aaTotal number of galaxies in redshift bin | NumberbbTotal number of galaxies brighter than the bias limit | M-5log() | |||
|---|---|---|---|---|---|---|
| (mag) | (10Mpc-3) | (10L⊙Mpc-3) | ||||
| Zucca | ||||||
| (fixed) | ||||||
| (fixed) | ||||||
| (fixed) | ||||||
| (fixed) | ||||||
| All Galaxies | ||||||
| (fixed) | ||||||
| (fixed) | ||||||
| (fixed) | ||||||
| (fixed) | ||||||
| LCBGs | ||||||
| (fixed) | ||||||
| (fixed) | ||||||
| (fixed) | ||||||
| (fixed) |
| M-5log() | Luminosity Function Value (10Mpc-3) | ||||
|---|---|---|---|---|---|
| Min | Max | ||||
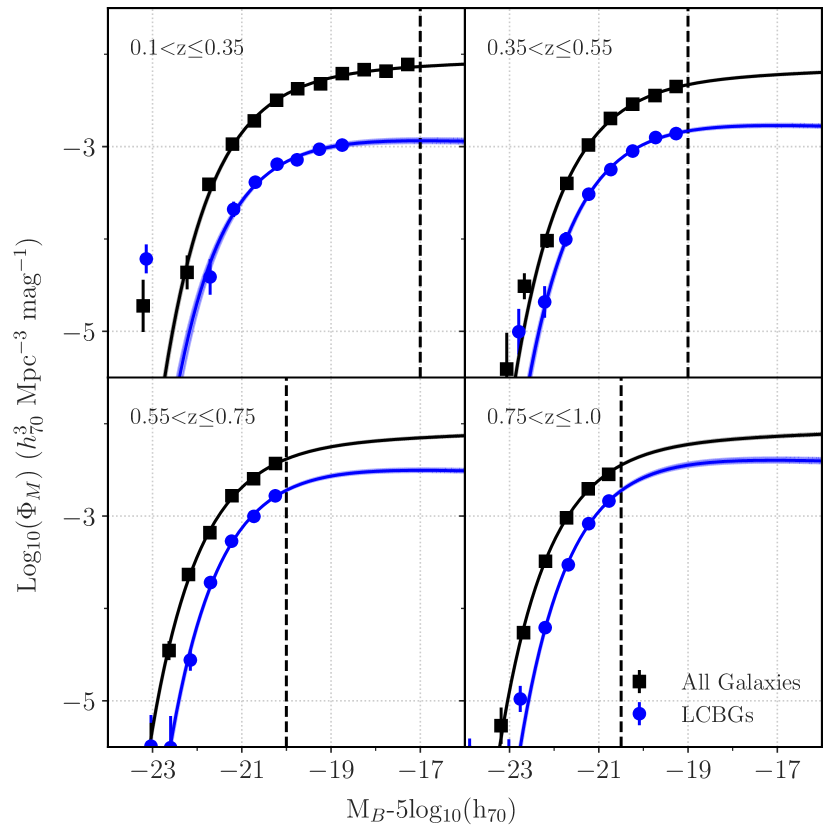
We show the luminosity function for both the total galaxy population and the LCBG sub-population in Figure 8, and their respective Schechter parameters in Table 3. In the LCBG population the characteristic magnitude, M∗, brightens by roughly mag over the redshift range . Both the LCBG space density, , and luminosity density, , increase by a factor of over this same redshift range. LCBGs become an important contributor to the total luminosity density, contributing of the B-band luminosity density between and almost between . This indicates that the evolution of LCBG number density is not necessarily due to probing different galaxy populations as we do not see much evolution in M∗, but that there is a large change in number density of the population as previously shown by Guzmán et al. (1998).

We estimate the number density of LCBGs in our four redshift bins by integrating all of the Schechter functions generated in the MCMC analysis from M= to mag. We then selected the most likely value as the accepted value and plotted the 68% confidence interval in the error bars.
The LCBG number density is plotted against redshift in Figure 9. At the lowest redshift range in our sample, , the LCBG number density is Mpc-3 and at the highest redshift range, , the LCBG number density is Mpc-3. Figure 9 also includes a linear fit to our number density values using the MCMC approach to better understand the errors in our fit. The fit includes the 68 confidence interval shaded in red, and approximately 1000 separate fits covering the confidence interval from the MCMC analysis plotted in a darker red shade. The equation, fit to our points is:
| (17) | |||
where N is the number density and z is the redshift. This can be used in future studies to find the estimated LCBG number density at a given redshift.
Werk et al. (2004) used the 1/Vmax method to calculate the number density of LCBGs below z=0.045 and found it to be Mpc-3. This is roughly a factor of 17 lower than the number density at z=1.0 and as seen in Figure 9 falls within the 68% confidence interval of our LCBG number density fit. Figure 9 also includes the LCBG number densities estimated by Phillips et al. (1997) and shows that between it is about 33% lower than our value. Phillips et al. (1997) do not include uncertainties in their estimate and suggest a large incompleteness correction to account for missing lower luminosity LCBGs. Werk et al. (2004) suggests that the uncertainty in the number density estimate from Phillips et al. (1997) is at least 33%, which would make their low redshift value fit closer to our estimate of the number density of LCBGs.
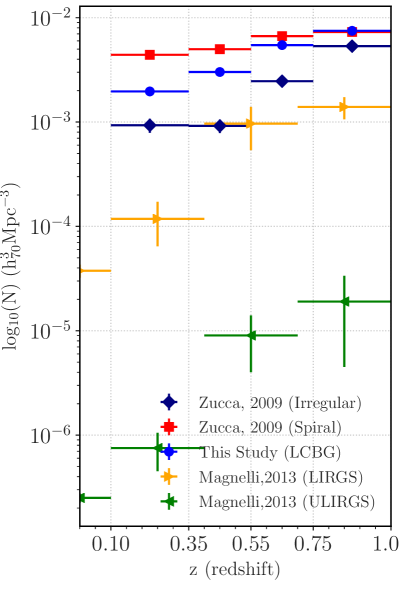
We also compare the evolution of the number density of LCBGs to the number density of other star-forming galaxy populations including luminous infrared galaxies (LIRGs) and ultra luminous infrared galaxies (ULIRGs) found in the Herschel-PACS Far Infrared Survey as calculated in Magnelli et al. (2013), irregular and spiral galaxies in COSMOS as calculated in Zucca et al. (2009). Galaxy morphology was determined in the COSMOS field by Tasca et al. (2009), and Zucca et al. (2009) used that classification to calculate the luminosity function for early type, spiral, and irregular galaxies. We estimate the number density of irregular and spiral galaxies in Zucca et al. (2009) by integrating the luminosity function for the two galaxy morphologies to M18.5 mag, the absolute magnitude cut-off for LCBGs. Figure 10 shows the number density of LCBGs rises more quickly than the number density of spiral galaxies between but not quite as rapidly as irregular galaxies. If LCBGs were predominantly spiral type or irregular type galaxies we would expect their number density to change in a way similar to the parent population. The fact that we do not see similar evolution to spiral or irregular galaxies indicates, as previously suggested, that the LCBG population is morphologically heterogeneous and includes both spiral and irregular galaxies. Magnelli et al. (2013) show LIRGs and ULIRGs grow in number density by a factor of and respectively between . Over the same redshift range, LCBGs grow in number density by a factor of , meaning ULIRGs and LIRGs also evolve more rapidly in number density. While LCBGs still appear to be one of the most rapidly evolving galaxy types as suggested by Rawat et al. (2007), other star-forming galaxy types do seem to evolve more rapidly. Magnelli et al. (2013) also finds that LIRGs and ULIRGs contribute of the total star formation rate density of the universe at z. Guzmán et al. (1997) found that LCBGs could contribute up to 45% of the star formation rate density of the universe at z. This indicates that at z0.7, LCBGs could contribute as much to the star formation rate density of the universe as LIRGs and ULIRGs while also being a much more significant population of galaxies.
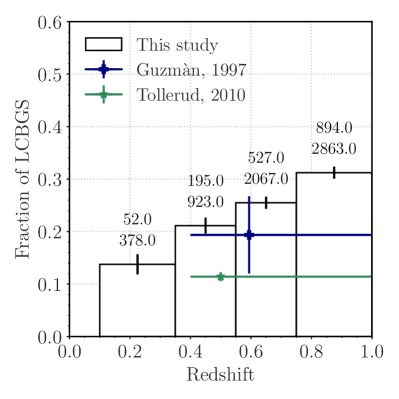
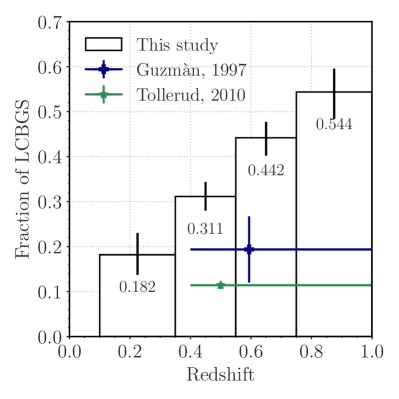
We estimate the fraction of LCBGs in each redshift bin in Figures 11 and 12. Figure 11 shows the fraction of galaxies more luminous than M20.5 that are LCBGs. This cutoff matches the completeness limit of the survey in the highest redshift bin and allows us to compare the same population of galaxies across all redshift bins. These more luminous LCBGs make up of the luminous galaxy population at z=0.225 and at z=0.875. In figure 12 we estimate the fraction of LCBGs in each redshift bin by determining the quotient of the number density of LCBGs and all galaxies more luminous than M18.5 by integrating the respective luminosity functions. We find that LCBGs make up about of galaxies at z=0.225 and of the galaxies at z=0.875. Both estimates show that LCBGs make up a significant portion of the galaxy population at a redshift of .
Guzmán et al. (1997) and Tollerud et al. (2010) have both previously looked at the fraction of LCBG like galaxies. Guzmán et al. (1997) selected compact star-forming galaxies that have I mag and mag arcsec-2 with no selection based on color. Their sample has an average M mag and average mag arcsec-2 which falls within our determined criteria for LCBG selection. Tollerud et al. (2010) selected LCBGs with M mag and BV mag and R kpc which at the absolute magnitude limit corresponds to mag arcsec-2. Therefore some of the galaxies contained in these samples would not likely be counted as LCBGs in our sample.
We compare the fraction of luminous LCBGs in COSMOS to the fraction found in Guzmán et al. (1997). As mentioned above, the photometric completeness of Guzmán et al. (1997) roughly matched the photometric completeness in COSMOS and we therefore expect a similar fraction of LCBGs in each sample. Guzmán et al. (1997) found LCBGs make up (19.37.4)% of the galaxy population with I22.5 mag between with the median redshift of z=0.594. The fraction of LCBGs in G10/COSMOS which has an apparent magnitude limit of Subaru i+=22.5 mag between is (252)% which matches the value determined by Guzmán et al. (1997) within the errors.
We have also plotted results from Tollerud et al. (2010) in Figure 12. They estimated the fraction of LCBGs to be (11.40.8)% also between without stating their limiting apparent magnitude. They do note that for their total sample of galaxies the limiting absolute magnitude at z=1 in the r-band is mag. At z=0.5, their median redshift, their limiting absolute magnitude becomes mag while the limiting absolute magnitude in the COSMOS field is 19 mag. It is therefore not surprising that Tollerud et al. (2010) finds a lower fraction of galaxies that are LCBGs as they are counting fainter galaxies in their total galaxy population than we do.
6 Conclusion
We have traced the evolution of the number density of LCBGs between using, for the first time, a consistent homogeneous data set and a sample of LCBGs almost two orders of magnitude larger than any other sample studied. We have done this by deriving the luminosity function of the total galaxy population and of LCBGs in four redshift bins between . We have found that the LCBG population appears to evolve as rapidly as previously suggested, with the number density at z=0.88 approximately four times larger than that at z=0.18, and approximately 20 times larger than the local number density estimated by Werk et al. (2004).
We find M∗ decreases by 0.22 mag and increases by 5.410Mpc-3 for LCBGs in the redshift range . We also found that the luminosity density increases by a factor of 4 between driven by the change in number density. We also show that LCBGs contribute roughly 48% of the luminosity density of galaxies more luminous than M18.5 at z0.88. We find that the LCBG number density evolves as Mpc-3, in line with previous studies. LCBGs do not evolve as rapidly as irregular galaxies, LIRGs or ULIRGs, but they do evolve more rapidly than spiral galaxies. Finally, we can see that at z=0.88, LCBGs make up approximately 31% of the galaxy population more luminous than MB=20.5 mag in COSMOS and approximately 54% of the galaxy population more luminous than M18.5 mag. The LCBG fraction is also in line with previous studies and illustrates how ubiquitous these compact star-forming galaxies become at higher redshift.
Acknowledgments: We thank the anonymous referee for many helpful suggestions which have significantly improved the paper. We would like to thank Dr. Elena Zucca for discussion and information that helped us with deriving the luminosity function. The G10/COSMOS redshift catalogue, photometric catalogue and cutout tool uses data acquired as part of the Cosmic Evolution Survey (COSMOS) project and spectra from observations made with ESO Telescopes at the La Silla or Paranal Observatories under programme ID 175.A-0839. The G10 cutout tool is hosted and maintained by funding from the International Centre for Radio Astronomy Research (ICRAR) at the University of Western Australia. Full details of the data, observation and catalogues can be found in Davies et al. (2015) and Andrews et al. (2016), or on the G10/COSMOS website: cutout.icrar.org/G10/dataRelease.php
MAB acknowledges support from NSF/AST-1517006. Support for SMC and GW for this work was provided by NASA through grant number AR 15058 from the Space Telescope Science Institute, Based on observations made with the NASA/ESA Hubble Space Telescope, obtained from the data archive at the Space Telescope Science Institute. STScI is operated by the Association of Universities for Research in Astronomy, Inc. under NASA contract NAS 5-26555 DJP and LRH acknowledge partial support from NSF CAREER grant AST-1149491 and AST 1412578.
References
- Ahn et al. (2014) Ahn, C., Gott, J. R., Mack, C. E., et al. 2014, Astrophysical Journal, Supplement Series, 211, 1
- Andrews et al. (2017) Andrews, S. K., Driver, S. P., Davies, L. J., et al. 2017, Monthly Notices of the Royal Astronomical Society, 464, 1569
- Atek et al. (2014) Atek, H., Kneib, J. P., Pacifici, C., et al. 2014, Astrophysical Journal, 789, doi:10.1088/0004-637X/789/2/96
- Baldry et al. (2014) Baldry, I. K., Alpaslan, M., Bauer, A. E., et al. 2014, Monthly Notices of the Royal Astronomical Society, 441, 2440
- Blanton & Roweis (2007) Blanton, M. R., & Roweis, S. 2007, The Astronomical Journal, 133, 734
- Capak et al. (2007) Capak, P., Aussel, H., Ajiki, M., et al. 2007, Energy Education Science and Technology Part B: Social and Educational Studies, 5, 321
- Cardamone et al. (2009) Cardamone, C., Schawinski, K., Sarzi, M., et al. 2009, Monthly Notices of the Royal Astronomical Society, 399, 1191
- Choloniewski (1986) Choloniewski, J. 1986, Monthly Notices of the Royal Astronomical Society, 223, 1
- Civano et al. (2016) Civano, F., Marchesi, S., Comastri, A., et al. 2016, The Astrophysical Journal, 819, 62
- Coil et al. (2011) Coil, A. L., Blanton, M. R., Burles, S. M., et al. 2011, Astrophysical Journal, 741, doi:10.1088/0004-637X/741/1/8
- Cool et al. (2012) Cool, R. J., Eisenstein, D. J., Kochanek, C. S., et al. 2012, The Astrophysical Journal, 748, 10
- Crawford et al. (2005) Crawford, S. M., Bershady, M. A., Glenn, A. D., & Hoessel, J. G. 2005, The Astrophysical Journal, 636, L13
- Crawford et al. (2014) Crawford, S. M., Wirth, G. D., & Bershady, M. A. 2014, Astrophysical Journal, 786, arXiv:1403.1115
- Crawford et al. (2016) Crawford, S. M., Wirth, G. D., Bershady, M. A., & Randriamampandry, S. M. 2016, The Astrophysical Journal, 817, 87
- Davies et al. (2015) Davies, L. J., Driver, S. P., Robotham, A. S., et al. 2015, Monthly Notices of the Royal Astronomical Society, 447, 1014
- Efstathiou et al. (1988) Efstathiou, G., Ellis, R. S., & Peterson, B. A. 1988, Monthly Notices of the Royal Astronomical Society, 232, 431
- Foreman-Mackey et al. (2013) Foreman-Mackey, D., Hogg, D. W., Lang, D., & Goodman, J. 2013, Publications of the Astronomical Society of the Pacific, 125, 306
- Garilli et al. (2008) Garilli, B., Fèvre, O. L., Guzzo, L., et al. 2008, Astronomy and Astrophysics, 486, 683
- Garland (2004) Garland, C. A. 2004, PhD thesis, University of Hawai’i
- Garland et al. (2015) Garland, C. A., Pisano, D. J., Low, M.-M. M., et al. 2015, The Astrophysical Journal, 807, 134
- Graham & Driver (2005) Graham, A. W., & Driver, S. P. 2005, Publications of the Astronomical Society of Australia, 22, 118
- Guzmán et al. (1997) Guzmán, R., Gallego, J., Koo, D. C., et al. 1997, The Astrophysical Journal, 489, 559
- Guzmán et al. (1998) Guzmán, R., Jangren, A., Koo, D. C., Bershady, M. A., & Simard, L. 1998, The Astrophysical Journal, 495, L13
- Guzmán et al. (1996) Guzmán, R., Koo, D. C., Faber, S. M., et al. 1996, The Astrophysical Journal, 460, L5
- Guzman et al. (2003) Guzman, R., Ostlin, G., Kunth, D., et al. 2003, The Astrophysical Journal, 1, 45
- Heckman et al. (2005) Heckman, T. M., Hoopes, C. G., Seibert, M., et al. 2005, The Astrophysical Journal, 619, L35
- Hoyos et al. (2004) Hoyos, C., Guzmán, R., Bershady, M. A., Koo, D. C., & Díaz, A. I. 2004, The Astronomical Journal, 128, 1541
- Hunter (2007) Hunter, J. D. 2007, Computing in Science & Engineering, 9, 90
- Ilbert et al. (2004) Ilbert, O., Tresse, L., Arnouts, S., et al. 2004, Monthly Notices of the Royal Astronomical Society, 351, 541
- Ilbert et al. (2005) Ilbert, O., Tresse, L., Zucca, E., et al. 2005, Astronomy & Astrophysics, 439, 863
- Ilbert et al. (2009) Ilbert, O., Capak, P., Salvato, M., et al. 2009, Astrophysical Journal, 690, 1236
- Koo et al. (1994) Koo, D. C., Bershady, M. A., Wirth, G. D., Stanford, S. A., & Majewski, S. R. 1994, The Astrophysical Journal, 427, L9
- Koo et al. (1995) Koo, D. C., Guzman, R., Faber, S. M., et al. 1995, The Astrophysical Journal, 440, L49
- Koo & Kron (1988) Koo, D. C., & Kron, R. G. 1988, The Astrophysical Journal, 325, 92
- Laigle et al. (2016) Laigle, C., McCracken, H. J., Ilbert, O., et al. 2016, The Astrophysical Journal Supplement Series, 224, 24
- Lilly et al. (2009) Lilly, S. J., Le Brun, V., Maier, C., et al. 2009, The Astrophysical Journal Supplement Series, 184, 218
- Lynden-Bell (1971) Lynden-Bell, D. 1971, Monthly Notices of the Royal Astronomical Society, 155, 95
- Magnelli et al. (2013) Magnelli, B., Popesso, P., Berta, S., et al. 2013, Astronomy & Astrophysics, 553, A132
- McCracken et al. (2012) McCracken, H. J., Milvang-Jensen, B., Dunlop, J., et al. 2012, Astronomy & Astrophysics, 544, A156
- Noeske et al. (2006) Noeske, K. G., Koo, D. C., Phillips, A. C., et al. 2006, The Astrophysical Journal, 640, L143
- Oliver et al. (2012) Oliver, S. J., Bock, J., Altieri, B., et al. 2012, Monthly Notices of the Royal Astronomical Society, 424, 1614
- Pérez-Gallego et al. (2011) Pérez-Gallego, J., Guzmán, R., Castillo-Morales, A., et al. 2011, Monthly Notices of the Royal Astronomical Society, 418, 2350
- Phillips et al. (1997) Phillips, A. C., Guzman, R., Gallego, J., et al. 1997, The Astrophysical Journal, 489, 543
- Price-Whelan et al. (2018) Price-Whelan, A. M., Sipőcz, B. M., Günther, H. M., et al. 2018, The Astronomical Journal, 156, 123
- Rabidoux et al. (2018) Rabidoux, K., Pisano, D. J., Garland, C. A., et al. 2018, The Astrophysical Journal, 852, 125
- Randriamampandry et al. (2017) Randriamampandry, S. M., Crawford, S. M., Bershady, M. A., Wirth, G. D., & Cress, C. M. 2017, Monthly Notices of the Royal Astronomical Society, 470, 4382
- Rawat et al. (2007) Rawat, A., Kembhavi, A. K., Hammer, F., Flores, H., & Barway, S. 2007, Astronomy & Astrophysics, 469, 483
- Robitaille et al. (2013) Robitaille, T. P., Tollerud, E. J., Greenfield, P., et al. 2013, Astronomy and Astrophysics, 558, 1
- Sanders et al. (2007) Sanders, D. B., Salvato, M., Aussel, H., et al. 2007, The Astrophysical Journal Supplement Series, 172, 86
- Schade et al. (1996) Schade, D., Lilly, S. J., Le Fevre, O., Hammer, F., & Crampton, D. 1996, The Astrophysical Journal, 464, 79
- Schade et al. (1995) Schade, D. J., Lilly, S. J., Crampton, D., et al. 1995, The Astrophysical Journal, 451, 1
- Schechter (1976) Schechter, P. 1976, The Astrophysical Journal, 203, 297
- Schmidt (1968) Schmidt, M. 1968, The Astrophysical Journal, 151, 393
- Scoville et al. (2007) Scoville, N., Aussel, H., Brusa, M., et al. 2007, The Astrophysical Journal Supplement Series, 172, 1
- Smolčić et al. (2017) Smolčić, V., Delvecchio, I., Zamorani, G., et al. 2017, Astronomy & Astrophysics, 602, A2
- Tammann et al. (1979) Tammann, G. A., Yahil, A., & Sandage, A. 1979, The Astrophysical Journal, 234, 775
- Taniguchi et al. (2007) Taniguchi, Y., Scoville, N., Murayama, T., et al. 2007, The Astrophysical Journal Supplement Series, 172, 9
- Taniguchi et al. (2015) Taniguchi, Y., Kajisawa, M., Kobayashi, M. A., et al. 2015, Publications of the Astronomical Society of Japan, 67, 1
- Tasca et al. (2009) Tasca, L. A. M., Kneib, J.-P., Iovino, A., et al. 2009, Astronomy & Astrophysics, 503, 379
- Tollerud et al. (2010) Tollerud, E. J., Barton, E. J., van Zee, L., & Cooke, J. 2010, The Astrophysical Journal, 708, 1076
- Turner (1979) Turner, E. L. 1979, The Astrophysical Journal, 231, 645
- Werk et al. (2004) Werk, J. K., Jangren, A., & Salzer, J. J. 2004, The Astrophysical Journal, 617, 1004
- Willmer et al. (2006) Willmer, C. N. A., Faber, S. M., Koo, D. C., et al. 2006, The Astrophysical Journal, 647, 853
- Wright et al. (2016) Wright, A. H., Robotham, A. S., Bourne, N., et al. 2016, Monthly Notices of the Royal Astronomical Society, 460, 765
- Zamojski et al. (2007) Zamojski, M. A., Schiminovich, D., Rich, R. M., et al. 2007, The Astrophysical Journal Supplement Series, 172, 468
- Zucca et al. (1997) Zucca, E., Zamorani, G., Vettolani, G., et al. 1997, Astronomy and Astrophysics, 326, 477
- Zucca et al. (2009) Zucca, E., Bardelli, S., Bolzonella, M., et al. 2009, Astronomy & Astrophysics, 508, 1217