Understanding the Effect of Out-of-distribution Examples and Interactive Explanations on Human-AI Decision Making
Abstract.
Although AI holds promise for improving human decision making in societally critical domains, it remains an open question how human-AI teams can reliably outperform AI alone and human alone in challenging prediction tasks (also known as complementary performance). We explore two directions to understand the gaps in achieving complementary performance. First, we argue that the typical experimental setup limits the potential of human-AI teams. To account for lower AI performance out-of-distribution than in-distribution because of distribution shift, we design experiments with different distribution types and investigate human performance for both in-distribution and out-of-distribution examples. Second, we develop novel interfaces to support interactive explanations so that humans can actively engage with AI assistance. Using virtual pilot studies and large-scale randomized experiments across three tasks, we demonstrate a clear difference between in-distribution and out-of-distribution, and observe mixed results for interactive explanations: while interactive explanations improve human perception of AI assistance’s usefulness, they may reinforce human biases and lead to limited performance improvement. Overall, our work points out critical challenges and future directions towards enhancing human performance with AI assistance.
1. Introduction
As AI performance grows rapidly and often surpasses humans in constrained tasks (Kleinberg et al., 2018; He et al., 2015; McKinney et al., 2020; Silver et al., 2018; Brown and Sandholm, 2019), a critical challenge to enable social good is to understand how AI assistance can be used to enhance human performance. AI assistance has been shown to improve people’s efficiency in tasks such as transcription by enhancing their computational capacity (Lasecki et al., 2017; Gaur et al., 2016), support creativity in producing music (Louie et al., 2020; McCormack et al., 2019; Frid et al., 2020), and even allow the visually impaired to “see” images (Wu et al., 2017; Gurari et al., 2018). However, it remains difficult to enhance human decision making in challenging prediction tasks (Kleinberg et al., 2015). Ideally, with AI assistance, human-AI teams should outperform AI alone and human alone (e.g., in accuracy; also known as complementary performance (Bansal et al., 2021)). Instead, researchers have found that while AI assistance improves human performance compared to human alone, human-AI teams seldom outperform AI alone in a wide variety of tasks, including recidivism prediction, deceptive review detection, and hypoxemia prediction (Lai and Tan, 2019; Lai et al., 2020; Green and Chen, 2019b, a; Zhang et al., 2020; Poursabzi-Sangdeh et al., 2021; Carton et al., 2020; Lin et al., 2020; Weerts et al., 2019; Beede et al., 2020; Wang and Yin, 2021; Lundberg et al., 2018).
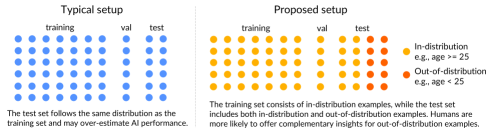
To address the elusiveness of complementary performance, we study two factors: 1) an overlooked factor in the experimental setup that may over-estimate AI performance; 2) the lack of two-way conversations between humans and AI, which may limit human understanding of AI predictions. First, we argue that prior work adopts a best-case scenario for AI. Namely, these experiments randomly split a dataset into a training set and a test set (Fig. 1). The training set is used to train the AI, and the test set is used to evaluate AI performance and human performance (with AI assistance). We hypothesize that this evaluation scheme is too optimistic for AI performance and provide limited opportunities for humans to contribute insights because the test set follows the same distribution as the training set (in-distribution). In practice, examples during testing may differ substantially from the training set, and AI performance can significantly drop for these out-of-distribution examples (McCoy et al., 2019; Clark et al., 2019; Jia and Liang, 2017). Furthermore, humans are better equipped to detect problematic patterns in AI predictions and offer complementary insights in out-of-distribution examples. Thus, we propose to develop experimental designs with both out-of-distribution examples and in-distribution examples in the test set.
Second, although explaining AI predictions has been hypothesized to help humans understand AI predictions and thus improve human performance (Doshi-Velez and Kim, 2017), static explanations, such as highlighting important features and showing AI confidence, have been mainly explored so far (Green and Chen, 2019b; Lai and Tan, 2019; Bansal et al., 2021). Static explanations represent a one-way conversation from AI to humans and may be insufficient for humans to understand AI predictions. In fact, psychology literature suggests that interactivity is a crucial component in explanations (Lombrozo, 2006; Miller, 2018). Therefore, we develop interactive interfaces to enable a two-way conversation between decision makers and AI. For instance, we allow humans to change the input and observe how AI predictions would have changed in these counterfactual scenarios (Fig. 6). We hypothesize that interactive explanations improve the performance of humans and their subjective perception of AI assistance’s usefulness. Although out-of-distribution examples and interactive explanations are relatively separate research questions, we study them together in this work as we hypothesize that they are critical missing ingredients towards complementary performance.
 \Description
To investigate the effect of out-of-distribution examples and interactive explanations on human-AI decision making, we choose three datasets spanning two tasks informed by prior work: 1) recidivism prediction (COMPAS and ICPSR) (a canonical task that has received much attention due to its importance; COMPAS became popular because of the ProPublica article on machine bias (Angwin et al., 2016), and ICPSR was recently introduced to the human-AI interaction community by Green and Chen (2019b, a), so it would be useful to see whether same results hold in both datasets); 2) profession detection (BIOS) (the task is to predict a person’s profession based on a short biography; this task is substantially easier than recidivism prediction and other text-based tasks such as deceptive review detection, so crowdworkers may have more useful insights to offer for this task). We investigate human-AI decision making in these tasks through both virtual pilot studies and large-scale randomized experiments. We focus on the following three research questions:
-
•
RQ1: how do distribution types affect the performance of human-AI teams, compared to AI alone?
-
•
RQ2: how do distribution types affect human agreement with AI predictions?
-
•
RQ3: how do interactive explanations affect human-AI decision making?
Our results demonstrate a clear difference between in-distribution and out-of-distribution. Consistent with prior work, we find that human-AI teams tend to underperform AI alone in in-distribution examples in all tasks. In comparison, human-AI teams can occasionally outperform AI in out-of-distribution examples in recidivism prediction (although the difference is small). It follows that the performance gap between human-AI teams and AI is smaller out-of-distribution than in-distribution, confirming that humans are more likely to achieve complementary performance out-of-distribution.
Distribution types also affect human agreement with AI predictions. In recidivism prediction (COMPAS and ICPSR), humans are more likely to agree with AI predictions in-distribution than out-of-distribution, suggesting that humans behave differently depending on the distribution type. Moreover, in recidivism prediction, human agreement with wrong AI predictions is lower out-of-distribution than in-distribution, suggesting that humans may be better at providing complementary insights into AI mistakes out-of-distribution. However, in BIOS, where humans may have more intuitions for detecting professions, humans are less likely to agree with AI predictions in-distribution than out-of-distribution. This observation also explains the relatively low in-distribution performance of human-AI teams in BIOS compared to AI alone.
Finally, although we do not find that interactive explanations lead to improved performance for human-AI teams, they significantly increase human perception of AI assistance’s usefulness. Participants with interactive explanations are more likely to find real-time assistance useful in ICPSR and COMPAS, and training more useful in COMPAS. To better understand the limited utility of interactive explanations, we conduct an exploratory study on what features participants find important in recidivism prediction. We find that participants with interactive explanations are more likely to fixate on demographic features such as age and race, and less likely to identify the computationally important features based on Spearman correlation. Meanwhile, they make more mistakes when they disagree with AI. These observations suggest that interactive explanations might reinforce existing human biases and lead to suboptimal decisions.
Overall, we believe that our work adds value to the community in the emerging field of human-AI collaborative decision making in challenging prediction tasks. Our work points out an important direction in designing future experimental studies on human-AI decision making: it is critical to think about the concept of out-of-distribution examples and evaluate the performance of human-AI teams both in-distribution and out-of-distribution. The implications for interactive explanations are mixed. On the one hand, interactive explanations improve human perception of AI usefulness, despite not reliably improving their performance. On the other hand, similar to ethical concerns about static explanations raised in prior work (Green and Chen, 2019a, b; Bansal et al., 2021), interactive explanations might reinforce existing human biases. It is critical to take these factors into account when developing and deploying improved interactive explanations. Our results also highlight the important role that task properties may play in shaping human-AI collaborative decision making and provide valuable samples for exploring the vast space of tasks.
2. Related work and Research Questions
In this section, we review related work and formulate our research questions.
2.1. Performance of Human-AI Teams in Prediction Tasks
With a growing interest in understanding human-AI interaction, many recent studies have worked on enhancing human performance with AI assistance in decision making. Typically, these decisions are formulated as prediction tasks where AI can predict the outcome and may offer explanations, e.g., by highlighting important features. For instance, the bailing decision (whether a defendant should be bailed) can be formulated as a prediction problem of whether a defendant will violate pretrial terms in two years (Kleinberg et al., 2018). Most studies have reported results aligning with the following proposition:
Proposition 1.
AI assistance improves human performance compared to without any assistance; however, the performance of human-AI teams seldom surpasses AI alone in challenging prediction tasks (Lai and Tan, 2019; Lai et al., 2020; Green and Chen, 2019b, a; Zhang et al., 2020; Poursabzi-Sangdeh et al., 2021; Carton et al., 2020; Lin et al., 2020; Weerts et al., 2019; Beede et al., 2020; Lundberg et al., 2018; Wang and Yin, 2021; Buçinca et al., 2020).111Our focus in this work is on understanding the performance of human-AI teams compared to AI performance and do not recommend AI to replace humans in any means. In fact, many studies have argued that humans should be the final decision makers in societally critical domains for ethical and legal reasons such as recidivism prediction and medical diagnosis (Green and Chen, 2019b; Lai and Tan, 2019; Liptak, 2017; Supreme Court of Wisconsin, 2016; Supreme Court of the United States, 1993).
This proposition is supported in a wide variety of tasks, including recidivism prediction (Green and Chen, 2019b, a; Lin et al., 2020), deceptive review detection (Lai and Tan, 2019; Lai et al., 2020), income prediction (Poursabzi-Sangdeh et al., 2021), and hypoxemia prediction (Lundberg et al., 2018), despite different forms of AI assistance. To understand this observation, we point out that Proposition 1 entails that AI alone outperforms humans alone in these tasks (human human + AI AI). Lai et al. (2020) conjectures that the tasks where humans need AI assistance typically fall into the discovering mode, where the groundtruth is determined by (future) external events (e.g., a defendant’s future behavior) rather than human decision makers, instead of the emulating mode, where humans (e.g., crowdworkers) ultimately define the groundtruth.222In fact, it is unclear what complementary performance means in the emulating mode if humans define the groundtruth as human performance is by definition 100%. A more subtle discussion can be found in footnote 4. We refer to prediction tasks in the discovering mode as challenging prediction tasks. Example tasks include the aforementioned recidivism prediction, deception detection, hypoxemia prediction, etc. These tasks are non-trivial to humans and two corollaries follow: 1) human performance tend to be far from perfect; 2) the groundtruth labels cannot be crowdsourced.333Whether a task is challenging (in the discovering mode) also depends on characteristics of humans. For instance, sentiment analysis of English reviews might not be challenging for native speakers, but could remain challenging for non-native speakers. In such tasks, AI can identify non-trivial and even counterintuitive patterns to humans. These patterns can be hard for humans to digest and leverage when they team up with AI. As such, it is difficult for human-AI teams to achieve complementary performance.
A notable exception is Bansal et al. (2021), which shows that human-AI team performance surpasses AI performance in sentiment classification (beer reviews and Amazon reviews) and LSAT question answering. Their key hypothesis is that human-AI teams are likely to excel when human performance and AI performance are comparable, while prior studies tend to look at situations where the performance gap is substantial. It naturally begs the question of what size of performance gap counts as comparable performance, whether comparable performance alone is sufficient for complementary performance, and whether other factors are associated with the observed complementary performance (we summarize the definitions of complementary performance and comparable performance in Table 1 to help readers understand these concepts). For instance, it is useful to point out that sentiment analysis is closer to the emulating mode.444Although labels in sentiment analysis are determined by the original author, sentiment analysis is generally viewed as a natural language understanding task that humans are capable of. AI is thus designed to emulate human capability. In the emulating mode, improving human performance is essentially aligning single-person decisions with the majority of a handful of annotators. We argue that data annotation is qualitatively different from decision making in challenging tasks such as recidivism prediction. We will provide a more in-depth discussion in §7.
| Complementary performance. An ideal outcome of human-AI collaborative decision making: the performance of human-AI teams is better than AI alone and human alone. |
| Comparable performance. The performance of human alone is similar to AI alone, yielding more potential for complementary performance as hypothesized in Bansal et al. (2021). There lacks a quantitative definition of what performance gap counts as comparable. We explore different ranges in this work. |
Our core hypothesis is that a standard setup in current experimental studies on human-AI interaction might limit the potential of human-AI teams. Namely, researchers typically follow standard machine learning setup in evaluating classifiers by randomly splitting the dataset into a training set and a test set, and using the test set to evaluate the performance of human-AI teams and AI alone. It follows that the data distribution in the test set is similar to the training set by design. Therefore, this setup is designed for AI to best leverage the patterns learned from the training set and provide a strong performance. In practice, a critical growing concern is distribution shift (Goodfellow et al., 2016; Quionero-Candela et al., 2009; Sugiyama and Kawanabe, 2012). In other words, the test set may differ from the training set, so the patterns that AI identifies can fail during testing, leading to a substantial drop in AI performance (McCoy et al., 2019; Clark et al., 2019; Jia and Liang, 2017). Throughout this paper, we refer to testing examples that follow the same distribution as the training set as in-distribution (IND) examples and that follow a different distribution as out-of-distribution (OOD) examples.
Thus, our first research question (RQ1) examines how distribution types affect the performance of human-AI teams, compared to AI alone. We expect our results in in-distribution examples to replicate previous findings and be consistent with Proposition 1. In comparison, we hypothesize that humans are more capable of spotting problematic patterns and mistakes in AI predictions when examples are not similar to the training set (out-of-distribution), as humans might be robust against distribution shift. Even if human-AI teams do not outperform AI alone in out-of-distribution examples, we expect the performance gap between human-AI teams and AI alone to be smaller out-of-distribution than in-distribution. Inspired by the above insights on comparable performance, we choose three tasks where humans and AI have performance gaps of different sizes so that we can investigate the effect of distribution type across tasks.
2.2. Agreement with AI
In addition to human performance, human agreement with AI predictions is critical for understanding human-AI interaction, especially in tasks where humans are the final decision makers. When AI predictions are explicitly shown, this agreement can also be interpreted as the trust that humans place in AI. Prior work has found that in general, the more information about AI predictions is given, the more likely humans are going to agree with AI predictions (Lai and Tan, 2019; Feng and Boyd-Graber, 2019; Bansal et al., 2021; Ghai et al., 2020). For instance, explanations, presented along with AI predictions, increase the likelihood that humans agree with AI (Lai et al., 2020; Bansal et al., 2021; Ghai et al., 2020). Confidence levels have also been shown to help humans calibrate whether to agree with AI (Zhang et al., 2020; Bansal et al., 2021). In a similar vein, Yin et al. (2019) investigate the effect of observed and stated accuracy on humans’ trust in AI and find that both stated and observed accuracy can affect human trust in AI. Finally, expertise may shape humans’ trust in AI: Feng and Boyd-Graber (2019) find that novices in Quiz Bowl trust the AI more than experts when visualizations are enabled.
However, little is known about the effect of distribution types as it has not been examined in prior work. Our second research question (RQ2) inquires into the effect of distribution types on human agreement with AI predictions. We hypothesize that humans are more likely to agree with AI in-distribution than out-of-distribution because the patterns that AI learns from in-distribution examples may not apply out-of-distribution and AI performance is worse out-of-distribution than in-distribution. Furthermore, given prior results that humans are more likely to agree with correct AI predictions than wrong AI predictions (Lai and Tan, 2019; Bansal et al., 2021), it would be interesting to see whether that trend is different out-of-distribution from in-distribution.
Additionally, we are interested in having a closer look at the effect of distribution types on human agreement by zooming in on the correctness of AI predictions. Prior work has introduced three terms to address these different cases of agreement (Wang and Yin, 2021): appropriate trust (McBride and Morgan, 2010; McGuirl and Sarter, 2006; Merritt et al., 2015; Muir, 1987) (the fraction of instances where humans agree with correct AI predictions and disagree with wrong AI predictions; this is equivalent to human-AI team accuracy in binary classification tasks), overtrust (Parasuraman and Riley, 1997; de Visser et al., 2014) (the fraction of instances where humans agree with wrong AI predictions), and undertrust (Parasuraman and Riley, 1997; de Visser et al., 2014) (the fraction of instances where humans disagree with correct AI predictions). To simplify the measurement, we only consider agreement with AI predictions in this work because disagreement and agreement add up to 1. We define the fraction of instances where humans agree with correct AI predictions as appropriate agreement and the fraction of instances where humans agree with incorrect AI predictions as overtrust, and similarly the counterparts in disagreement as undertrust and appropriate disagreement. Table 2 shows the full combinations of human agreement and AI correctness. The term appropriate trust then is the sum of appropriate agreement and appropriate disagreement. We hypothesize that patterns embedded in the AI model may not apply to out-of-distribution examples, humans can thus better identify wrong AI predictions in out-of-distribution examples (i.e., overtrust is lower out-of-distribution). Similarly, our intuition is that appropriate agreement is also likely lower out-of-distribution as AI may make correct predictions based on non-sensible patterns. While we focus on how distribution types affect appropriate agreement and overtrust, it also entails how distribution types affect undertrust and appropriate disagreement.
| Correct AI predictions | Wrong AI predictions | |
|---|---|---|
| Humans agree with | Appropriate agreement | Overtrust |
| Humans disagree with | Undertrust | Appropriate disagreement |
2.3. Interactive Explanations
A key element in developing AI assistance are explanations of AI predictions, which have attracted a lot of interest from the research community (Lipton, 2016; Doshi-Velez and Kim, 2017; Ribeiro et al., 2016; Lundberg and Lee, 2017; Koh and Liang, 2017; Lakkaraju et al., 2016; Gilpin et al., 2018). Experimental studies in human-AI decision making have so far employed static explanations such as highlighting important features and showing similar examples, a few studies have also investigated the effect of explanations with an interactive interface. However, literature in social sciences has argued that explanations should be interactive. For instance, Lombrozo (2006) suggests that an explanation is a byproduct of an interaction process between an explainer and an explainee, and Miller (2018) says that explanations are social in that they are transferable knowledge that is passed from one person to the other in a conversation. We hypothesize that the one-way conversation in static explanations is insufficient for humans to understand AI predictions, contributing to the proposition that human-AI teams have yet to outperform AI alone.
It is worth pointing out that industry practitioners have worked towards developing interactive interfaces to take advantage of deep learning models’ superior predictive power. For instance, Tenney et al. (2020) develop an interative interpretability tool that provide insightful visualizations for NLP tasks. Similar interactive tools have been used to support data scientists in debugging machine learning models and improving model performance (Kaur et al., 2020; Hohman et al., 2019; Wu et al., 2019). While data scientists are familiar with machine learning, laypeople may not have the basic knowledge of machine learning. We thus focus on developing an interface that enables meaningful interactive explanations for laypeople to support decision making rather than debugging. Our ultimate goal is to improve human performance instead of model performance. In addition, there have been interactive systems that provide AI assistance for complicated tasks beyond constrained prediction tasks (Cai et al., 2019; Xie et al., 2020; Yang et al., 2019). Our scope in this work is limited to explanations of AI predictions where the human task is to make a simple categorical prediction. Most similar to our work is Cheng et al. (2019), which examines the effect of different explanation interfaces on user understanding of a model and shows improved understandings with interactive explanations, whereas our work focuses on the effect of interactive explanations on human-AI decision making.
As such, our final research question (RQ3) investigates the effect of interactive explanations on human-AI decision making. We hypothesize that interactive explanations lead to better human-AI performance, compared to static explanations. We further examine the effect of interactive explanations on human agreement with AI predictions. If interactive explanations enable humans to better critique incorrect AI predictions, then humans may become less reliant on the incorrect predicted labels (i.e., lower overtrust). Finally, we expect interactive explanations to improve subjective perception of usefulness over static explanations because interactive explanations enable users to have two-way conversations with the model.
2.4. Differences from Interactive Machine Learning and Transfer Learning
It is important to note that our focus in this work is on how distribution types and interactive explanations affect human performance in decision making and our ultimate goal is to enhance human performance. While other areas such as transfer learning and interactive machine learning have conducted user studies where people interact with machine learning models, the goal is usually to improve model performance. Specifically, interactive machine learning tends to involve machine learning practitioners, while our work considers the population that does not have a machine learning background (Hohman et al., 2019; Krause et al., 2016; Tenney et al., 2020; Wexler et al., 2019). Similarly, transfer learning focuses on improving models that would generalize well on other domains (distributions), whereas our work investigates how examples in different distributions affect human performance (Zhuang et al., 2020; Liang and Zheng, 2020; Torrey and Shavlik, 2010). Although improving AI will likely improve human performance in the long run, we focus on the effect of AI assistance on human decision making where the AI is not updated.
3. Methods
In order to evaluate the performance of human-AI teams, we consider three important ingredients in this work: 1) Prediction tasks: we consider three prediction tasks that include both tabular and text datasets as well as varying performance gaps between human alone and AI alone (§3.1); 2) In-distribution (IND) vs. out-of-distribution (OOD): a key contribution of our work is to highlight the importance of distribution shift and explore ways to design human-AI experimental studies with considerations of in-distribution and out-of-distribution examples (§3.2); 3) Explanation type: another contribution of our work is to design novel interactive explanations for both tabular data and text data (§3.3). We further use virtual pilot studies to gather qualitative insights and validate our interface design (§3.4), and then conduct large-scale experiments with crowdworkers on Mechanical Turk (§3.5).
3.1. Prediction Tasks
We use two types of tasks, recidivism prediction, and profession prediction. Recidivism prediction is based on tabular datasets, while profession prediction is based on text datasets.
-
•
ICPSR (United States Department of Justice. Office of Justice Programs. Bureau of Justice Statistics., 2014). This dataset was collected by the U.S. Department of Justice. It contains defendants who were arrested between 1990 and 2009, and the task is to predict if a defendant will violate the terms of pretrial release. Violating terms of pretrial release means that the defendant is rearrested before trial, or fails to appear in court for trial, or both. We clean the dataset to remove incomplete rows, restrict the analysis to defendants who were at least 18 years old, and consider only defendants who were released before trial as we only have ground truth for this group. We consider seven attributes as features in this dataset: Gender, Age, Race, Prior Arrests, Prior Convictions, Prior Failure to Appear, and Offense Type (e.g., drug, violent). To protect defendant privacy, we only selected defendants whose features are identical to at least two other defendants in the dataset. This yielded a dataset of 40,551 defendants.
-
•
COMPAS (Angwin et al., 2016). The task is to predict if the defendant will recidivate in two years. The features in this dataset are Sex, Age, Race, Prior Crimes, Charge Degree, Juvenile Felony Count, and Juvenile Misdemeanor Count. Both datasets have overlapping features such as Age and Race. There are 7,214 defendants in this dataset.
-
•
BIOS (De-Arteaga et al., 2019). This dataset contains hundreds of thousands of online biographies from the Common Crawl corpus. The task is to predict a person’s profession given a biography. The original dataset consists of 29 professions, and we narrow it down to five professions to make the task feasible for humans, namely, psychologist, physician, surgeon, teacher, and professor.555To choose these five professions, we built maximum spanning trees with 4, 5, 6 nodes from a graph based on the confusion matrix of a classifier trained with all biographies. Thus, the maximum spanning tree identifies the most confusing professions for the AI. This yielded a dataset of 205,360 biographies.
As Bansal et al. (2021) hypothesize that comparable performance between humans and AI is critical for complementary performance, our tasks cover varying performance gaps. The in-distribution performance gap between AI alone and human alone in-distribution is relatively small (7%) in recidivism prediction (68.4% vs. 60.9% in ICPSR and 65.5% vs. 60.0% in COMPAS), but large (20%) in profession prediction (see Table 3 and §4 for a more detailed discussion on performance gap). Note that human performance in ICPSR and COMPAS is derived from our experiments with crowdworkers. Although they are not representative of judges (see more discussion in §7), they outperform random baselines and can potentially be improved with AI assistance. In fact, human performance in LSAT is also 60% in Bansal et al. (2021), and crowdworkers were able to achieve complementary performance. Finally, we include gender and race for recidivism prediction to understand how humans might use the information, but they should not be included in AI for deployment.
3.2. In-distribution vs. Out-of-distribution Setup
As argued in §2, prior work randomly split a dataset to evaluate the performance of human-AI teams. This setup constitutes a best-case scenario for AI performance and may have contributed to the elusiveness of complementary performance. We expect humans to be more capable of providing complementary insights (e.g., recognizing that AI falsely generalizes a pattern) on examples following different distributions from the training data (out-of-distribution). Therefore, it is crucial to evaluate the performance of human-AI teams on out-of-distribution examples. We thus provide the first attempt to incorporate distribution shift into experimental studies in the context of human-AI decision making.
3.2.1. Designing In-distribution vs. Out-of-distribution
To simulate the differences between in-distribution and out-of-distribution examples, our strategy is to split the dataset into an in-distribution (IND) subset and an out-of-distribution (OOD) subset based on a single attribute (e.g., age 25 as in-distribution and age 25 as out-of-distribution to simulate a scenario where young adults are not presented in the training set). We develop the following desiderata for selecting an attribute to split the dataset: 1) splitting by this attribute is sensible and interpretable to human (e.g., it makes little sense to split biographies based on the number of punctuation marks); 2) splitting by this attribute could yield a difference in AI performance between in-distribution and out-of-distribution so that we might expect different human behavior in different distribution types; 3) this attribute is “smoothly” distributed in the dataset to avoid extreme distributions that can limit plausible ways to simulate IND and OOD examples (see the supplementary materials for details). Now we discuss the attribute selected for each dataset and present rationales for not using other attributes.

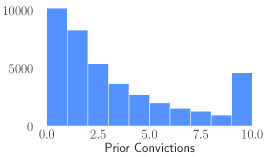
Numbers of instances for “Prior Arrests” 0-9 decrease logarithmicly from around 5000 to around 1000, while the number of instances for “Prior Arrests” 10 is more than 12000. Numbers of instances for “Prior Convictions” 0-9 decrease logarithmicly from around 10000 to around 1000, while the number of instances for “Prior Convictions” 10 is around 5000.
-
•
ICPSR. We choose the age of the defendant as the attribute. We also tried Gender, but it failed desiderata 2 due to a small AI performance difference (1%) between in-distribution and out-of-distribution. Other features such as Prior Arrests and Prior Convictions do not satisfy desiderata 3, because they have a huge spike towards the end (see Fig. 2) and thus limit possible IND/OOD splits.
-
•
COMPAS. We choose the age of the defendant as the attribute. We also tried Sex and Prior Crimes, but they failed desiderata 2 and 3 respectively as Gender and Prior Convictions did in ICPSR.
-
•
BIOS. We choose the length of the biography (i.e., the total number of characters) as the attribute. Note that our dataset contains biographies from the web, a dataset created by De-Arteaga et al. (2019). Although one may think that professor, surgeon, psychologist, and physician require more education than teacher and thus resulting in longer biographies, the average biography length of a teacher’s biography is not the shortest in our dataset. Interestingly, physicians have the shortest biographies with 348 characters and teachers have an average biography length of 367 characters. We also experimented with gender but it does not satisfy desiderata 2 since we observed a small AI performance difference (3%) between in-distribution and out-of-distribution.
Given the selected attribute, for each dataset, we split the data into 10 bins of equal size based on the attribute of choice. Then, we investigate which bins to use as in-distribution and out-of-distribution. Our goal in this step is to maximize the AI performance gap between in-distribution and out-of-distribution so that we can observe whether humans would behave differently with AI assistance depending on distribution types (see supplementary materials). The chosen splits for each dataset are: 1) age 25 as IND and age 25 as OOD in ICPSR, 2) age 26 as IND and age 26 as OOD in COMPAS, and 3) length 281 characters as IND and length 281 characters as OOD in BIOS. For each potential split, we use 70% of the data in the IND bins for training and 10% of the data in the IND bins for validation. Our test set includes two subsets: 1) the remaining 20% of the data in the IND bins, and 2) the data in the OOD bins. We also balance the labels in each bin of our test set for performance evaluation.
 \Description
3.2.2. AI Performance in-distribution and out-of-distribution.
Following prior work (Lai et al., 2020; De-Arteaga et al., 2019), we use a linear SVM classifier with unigram bag-of-words for BIOS and with one-hot encoded features for recidivism prediction tasks. The standard procedure of hyperparameter selection (a logarithmic scale between and for the inverse of regularization strength) is done with the validation set. We focus on linear models in this work for three reasons: 1) linear models are easier to explain than deep models and are a good starting point to develop interactive explanations (Feng and Boyd-Graber, 2019; Poursabzi-Sangdeh et al., 2021); 2) prior work has shown that human performance is better when explanations from simple models are shown (Lai et al., 2020); 3) there is a sizable performance gap between humans and AI even with a linear model, although smaller than the case of deception detection (Lai and Tan, 2019; Lai et al., 2020).
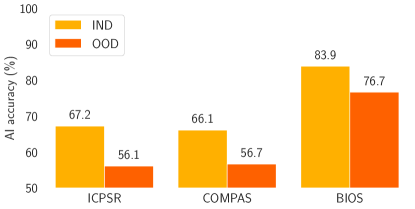
Finally, to reduce the variance of human performance so that each example receives multiple human evaluations, we randomly sample 180 IND examples and 180 OOD examples from the test set to create a balanced pool for our final user study.666We choose from five random seeds the one that leads to the greatest AI performance difference between in-distribution samples and out-of-distribution samples. Fig. 3 shows AI performance on these samples: the IND-OOD gap is about 10% in recidivism prediction and 7% in BIOS. It entails that the absolute performance necessary to achieve complementary performance is lower OOD than IND. Because of this AI performance gap in-distribution and out-of-distribution, we will focus on understanding the performance difference between human-AI teams and AI alone (accuracy gain). As discussed in §2, we hypothesize that the accuracy gain is greater out-of-distribution than in-distribution.
3.3. Interactive Explanations and Explanation Type
To help users understand the patterns embedded in machine learning models, following Lai et al. (2020), our experiments include two phases: 1) a training phase where users are shown no more than six representative examples and the associated explanations; and 2) a prediction phrase that is used to evaluate the performance of human-AI teams with 10 random in-distribution examples and 10 random out-of-distribution examples. Fig. 4 shows the workflow of our experiments. Our contribution is to develop interactive explanations to enable a two-way conversation between humans and AI and examine the effect of interactive explanations. We also consider a static version of AI assistance in each phase for comparison. We refer to AI assistance during the prediction phase as real-time assistance.
 \Description
The workflow contains four stages: 1) instructions and attention check; 2) training phase; 3) prediction phase; 4) exit survey.
3.3.1. Static Assistance
Our static assistance for an AI prediction includes two components (see Fig. 5). First, we highlight important features based on the absolute value of feature coefficients to help users understand what factors determine the AI prediction. We color all seven features in ICPSR and COMPAS to indicate whether a feature contributes positively or negatively to the prediction (Fig. 5(a)). As BIOS has many words as features, we highlight the top 10 most important words. We only show the colors but hide the feature coefficient numbers because 1) we have not introduced the notion of prediction score; 2) showing numerical values without interaction may increase the cognitive burden without much gain. Second, we also show the AI predicted label along with the highlights. In the training phase, following Lai et al. (2020), the actual label is revealed after users make their predictions so that they can reflect on their decisions and actively think about the task at hand.
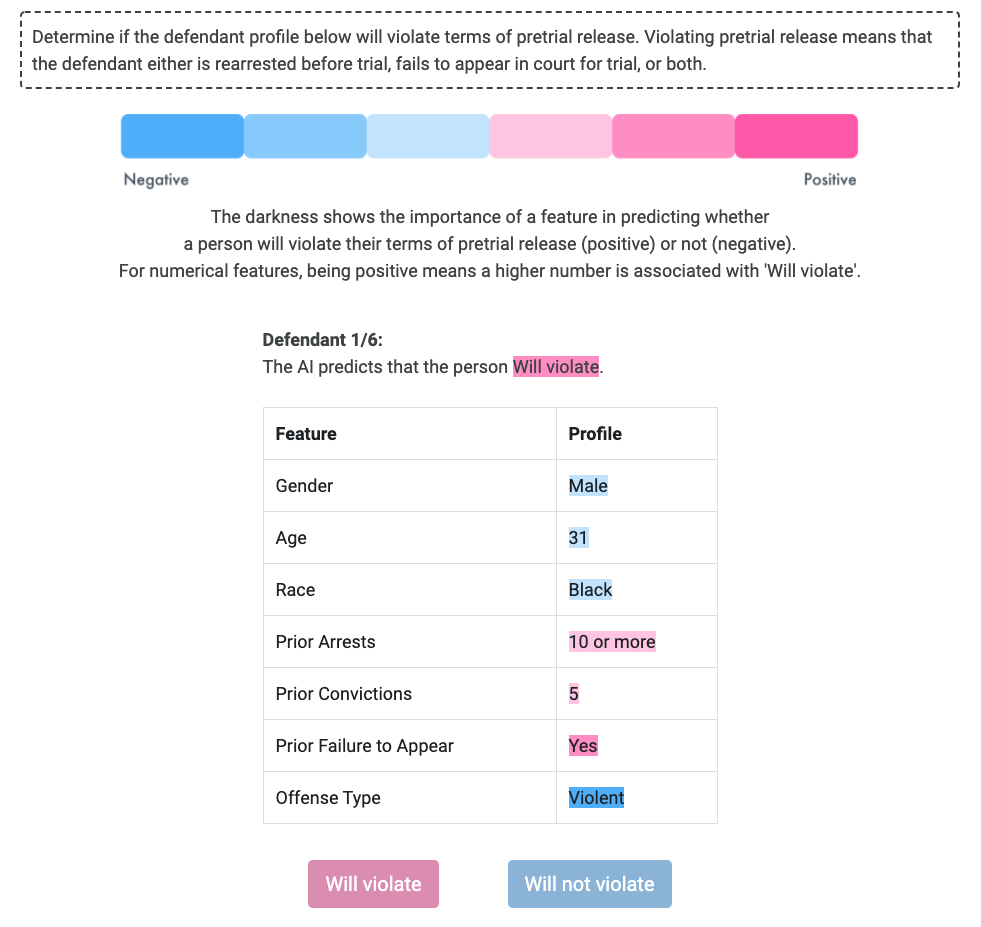
Defendant profile with features highlighted in three shades of blue and three shades of pink.
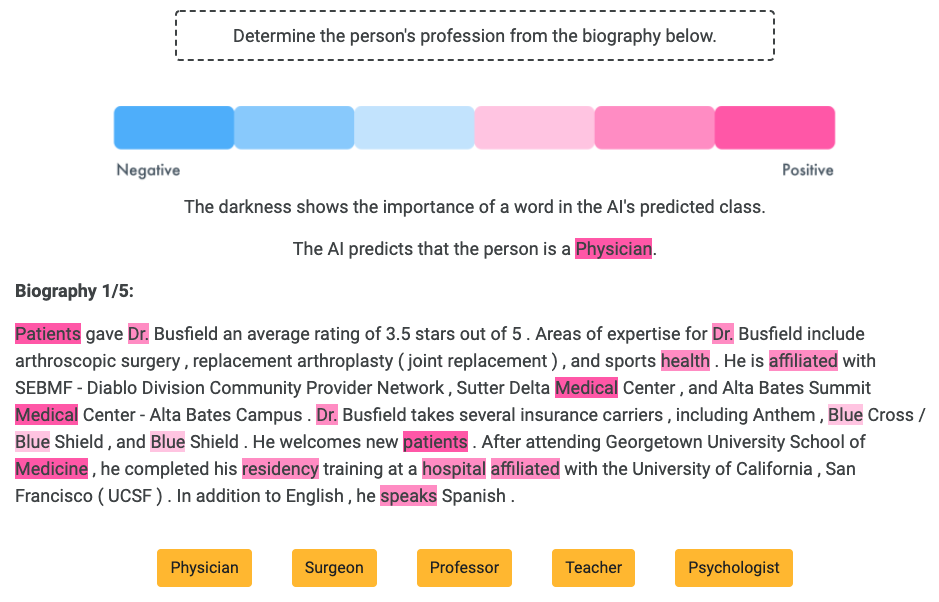
Biography texts with words highlighted in three shades of blue and three shades of pink.
The purpose of the training examples is to allow participants to familiarize themselves with the task, extract useful and insightful patterns, and apply them during the prediction phase. We use SP-LIME (Ribeiro et al., 2016; Lai et al., 2020) to identify 5-6 representative training examples that capture important features (6 in ICPSR and COMPAS and 5 in BIOS).777We include 10 examples in the pilot studies, but mechanical turkers commented that the experiment took too long. We make sure the selected examples are balanced across classes. For the control condition, we simply include the first two examples. Finally, during training, to ensure that users understand the highlighted important features, we add a feature quiz after each example where users are required to choose a positive and a negative feature (see Fig. 25).
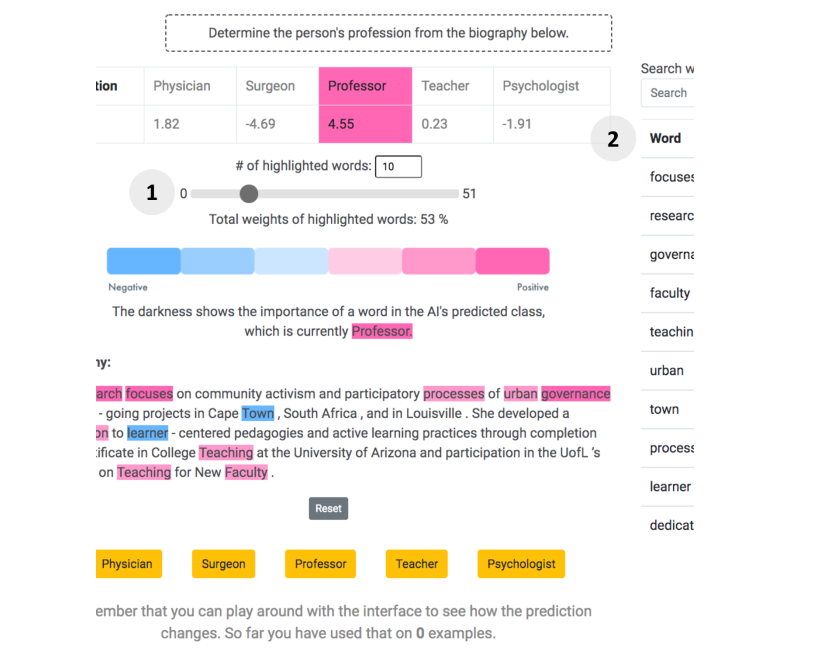
Picture shows an interactive console that allows user to manipulate feature values with sliders and radio buttons. Changes in feature values may result in a change of the AI prediction. A table on the right of the picture displays feature coefficients.
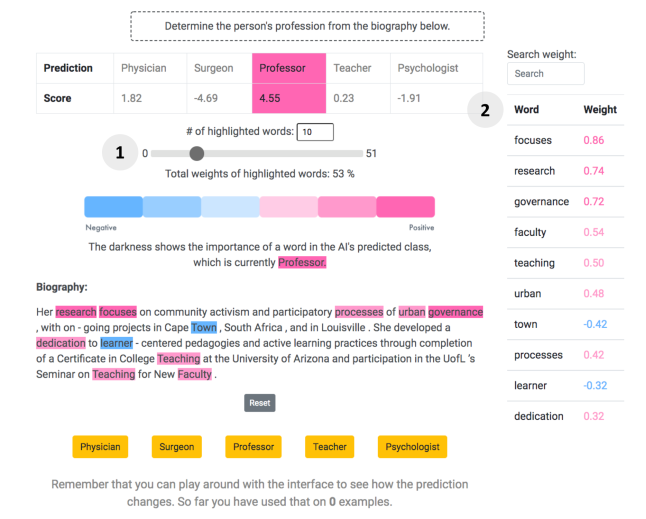
Picture shows an interactive console that allows user to manipulate the number of highlighted words with a slider and an input field. A table on the right of the picture displays feature coefficients of words and a search box.
3.3.2. Interactive Explanations
To help humans better understand how AI makes a prediction and the potential fallacies in AI reasoning, we develop a suite of interactive experiences. There are two important components. First, we enable users to experiment with counterfactual examples of a given instance. This allows participants to interact with each feature and observe changes in AI predictions. Second, we make the feature highlights dynamic, especially for BIOS where there are many features. Specifically, our designs are as follows:
-
•
Interactive explanations for tabular-data classification (ICPSR and COMPAS; Fig. 6(a) gives a screenshot for ICPSR). We present the original profile of the defendant and the counterfactual (“What-if scenario profile”) on the left of the screen (Fig. 6(a)(1)). Users can adjust features to change the counterfactual profile (Fig. 6(a)(2)) via sliders, radio buttons, and select lists (Fig. 6(a)(3-5)). For instance, users can investigate how a younger or older age affects the prediction by adjusting a defendant’s age using the slider. In addition, we show all the features and their associated weight on the right, sorted in descending order (Fig. 6(a)(6)).
-
•
Interactive explanations for text classification (BIOS; see Fig. 6(b)). To enable the counterfactuals, users can delete any word in the text and see how the prediction would change (removal can be undone by clicking the same word again). For dynamic highlight, a slider is available for users to adjust the number of highlighted words (Fig. 6(b)(1)). In addition, we provide a searchable table to display all words presented in the text and their associated feature importance, sorted in descending order (Fig. 6(b)(2)).
The searchable table allows users to the explore the high-dimensional feature space in BIOS, a text classification task. While it may seem that showing coefficients in recidivism prediction is not as useful, we highlight that these numerical values make little sense on their own. The counterfactual profile enables users to examine how these numerical values affect prediction outcomes.
3.4. Virtual Pilot Studies
We conducted virtual pilot studies to obtain a qualitative understanding of human interaction with interactive explanations. The pilot studies allow us to gather insights on how humans use interactive explanations in their decision-making process, as well as feedback on the web application before conducting large-scale randomized experiments.
Experimental design. We employed a concurrent think-aloud process with participants (Nielsen et al., 2002). Participants are told to verbalize the factors they considered behind a prediction. During the user study session, participants first read instructions for the task and proceed to answer a couple of attention-check questions (see Fig. 23), which ensure that they understand the purpose of the user study. Upon passing the attention-check stage, they undergo a training phase before proceeding to the prediction phase. Finally, they answer an exit survey (see Fig. 28) that asks for demographic information and semi-structured questions on the web application and interactive explanations. A participant works on ICPSR and BIOS in a random order.
We recruited 15 participants through mailing lists at the University of Colorado Boulder: 7 were female and 8 were male, with ages ranging from 18 to 40.888Note that the wide range in age is due to the available choices in our exit survey. Namely, the first option is 18-25 and the second option is 26-40. To understand the general population that does not have a machine learning background, we sent out emails to computer science and interdisciplinary programs. Participants included both undergraduate and graduate students with and without machine learning background. The user study is conducted on Zoom due to the pandemic. The user study sessions were recorded with the participants’ consent. Participants were compensated for $10 for every 30 minutes. A typical user study session lasted between an hour to an hour and a half. Participants were assigned in a round-robin manner to interactive and static explanations. For instance, if a participant was assigned to static explanations in BIOS, the participant would be assigned to interactive explanations in ICPSR. As the user study sessions were recorded on Zoom cloud, we used the first-hand transcription provided by Zoom and did a second round of transcribing to correct any mistranscriptions. Subsequently, thematic analysis was conducted to identify common themes in the think-aloud processes, and thematic codes were collectively coded by two researchers.
Next, we summarize the key themes from the pilot studies and the changes to our interface.
Disagreement with AI predictions. Participants tend to disagree with AI predictions when the explanations provided by the AI contradict their intuitions. For instance, although AI suggests that the drug offense type is correlated with “Will violate”, P4 thinks that “drug offense is not something serious, a minor offense” and thus disagrees with AI and chooses “Will not violate”. With a similar train of thought, P7 asks why AI suggests the violent offense type to be correlated with “Will not violate” and thinks that it should be the other way around. A potential reason is that people are more likely to restrain themselves after serious crimes as the consequence can be dire, but it seemed difficult for the participants to reason about this counterintuitive pattern. The above comments suggest that some patterns that AI identifies can be counterintuitive and thus challenging for humans to make sense of.
Furthermore, participants disagree with AI predictions due to focusing too much on a few patterns they learned from AI. For instance, if a participant learns that Prior Failure to Appear positively relates to “Will violate”, they will apply the same logic on future examples and disagree with the AI when the pattern and prediction disagrees. Quoting from P9, “The current example has no for Prior Failure to Appear and drug offense but the previous examples had yes for Prior Failure to Appear and drug offense”. P9 then chooses “Will not violate” because of these two features. This observation highlights the importance of paying attention to features globally, which can be challenging for humans.
Finally, participants are more confident in BIOS than in ICPSR as they are able to relate to the task better and understand the explanations provided by the AI better. They believe that the biography text is sufficient to detect the profession, but much of the crucial information is missing in ICPSR. P9 said, “there was more background on what they did in their lives, and how they got there and whatnot, so it helped me make a more educated decision”. This observation also extends to their evaluation of AI predictions, quoting from P12, “the AI would be more capable of predicting based on a short snippet about someone than predicting something that hasn’t happened”.
Strategies in different tasks. Different strategies are employed in different tasks. Since BIOS is a task requiring participants to read a text, most participants look for (highlighted) keywords that distinguish similar professions. For instance, while both professor and teacher teach, participants look for keywords such as “phd” to distinguish them. Similarly, in the case of surgeon and physician, participants look for keywords such as “practice” and “surgery”. In ICPSR, as there are only seven features, most participants pay extra attention to a few of them, including Prior Failure to Appear, Prior Convictions, Prior Arrest, and Offense Type. We also noticed during the interview that most participants tend to avoid discussing or mentioning sensitive features such as Race. In §7, we elaborate and discuss findings on an exploratory study on important features identified by participants.
The effect of interactive explanations. Participants could be categorized into two groups according to their use of the interactive console, either they do not experiment with it, or they play with it excessively. Participants in the former group interact with the console only when prompted, while the latter group result in a prolonged user study session. Some participants find the additional value of interactive console limited as compared to static explanations such as highlights. They are unsure of the ‘right’ way to use it as P12 commented, “I know how it works, but I don’t know what I should do. Maybe a few use cases can be helpful. Like examples of how to use them”. Other participants do not interact much with it, but still think it is helpful. With reference to P6, “I only played with it in the first few examples. I just use them to see the AI’s decision boundaries. Once I get it in training, I don’t need them when I predict.”
Another interesting finding was that while some participants make decisions due to visual factors, others make decisions due to numerical factors. P2 said, “the color and different darkness were really helpful instead of just having numbers”. In contrast, P4, who often made decisions by looking at the numbers, commented on one of the many justifications that the defendant “will not violate because the numbers are low.” This observation suggests that our dynamic highlights may provide extra benefits to static highlights.
Web application feedback. As some participants were unsure of how to use the interactive console and make the most out of it, we added an animated video that showcased an example of using the interactive console on top of the walk-through tutorial that guides a user through each interactive element (see the supplementary materials). We also added a nudging component describing how many instances they have used interactive explanations with to remind participants of using the interactive console (see Fig. 6).
In addition to Zoom sessions, we conducted pilot studies on Mechanical Turk before deploying them in large-scale tasks. Since some Zoom sessions took longer than we expected, we wanted to investigate the total time taken for completing 10 training and 20 test instances. We noted from the feedback collected from exit surveys of pilot studies that the training was too time consuming and difficult. We thus reduced the number of training instances and improved the attention check questions and instruction interfaces. See the supplementary materials for details.
3.5. Large-scale Experiments with Crowdworkers
Finally, we discuss our setup for the large-scale experiments on Amazon Mechanical Turk. First, in order to understand the effect of out-of-distribution examples, we consider the performance of humans without any assistance as our control setting. Second, another focus of our study is on interactive explanations, we thus compares interactive explanations and static explanations.999A natural question is about the effect of explanations vs. AI assistance without explanations. We refer readers to prior work on this question (Lai et al., 2020; Lai and Tan, 2019; Green and Chen, 2019b).
Specifically, participants first go through a training phase to understand the patterned embedded in machine learning models, and then enter the prediction phase where we evaluate the performance of human-AI teams. We allow different interfaces in the training phase and in the prediction phase because the ideal outcome is that participants can achieve complementary performance without real-time assistance after the training phase. To avoid scenarios where users experience a completely new interface during prediction, we consider situations where the assistance in training is more elaborate than the real-time assistance in prediction. Therefore, we consider the following six conditions to understand the effect of explanation types during training and prediction (the word before and after “/” refers to the assistance type during training and prediction respectively):
-
•
None/None. Participants are not given any form of AI assistance in either the training phase or the prediction phase. In the training phase, there are only two examples instead of 5-6 in other conditions to help participants understand the task. In other words, this condition is a human-only condition.
-
•
Static/None. Participants are provided static assistance in the training phase. Important features are highlighted in shades of pink/blue and AI predictions are provided. Participants are not provided any assistance in the prediction phase.
-
•
Static/Static. Participants are provided static assistance in both training and prediction.
-
•
Interactive/None. Participants are provided interactive explanations during the training phase, and no assistance in the prediction phase.
-
•
Interactive/Static. Participants are provided interactive explanations in the training phase and static assistance in the prediction phase.
-
•
Interactive/Interactive. Participants are provided interactive explanations in both training and prediction.
We refer to these different conditions as explanation type in the rest of this paper. The representative examples are the same during training in Interactive and Static. Participants are recruited via Amazon Mechanical Turk and must satisfy three criteria to work on the task: 1) residing in the United States, 2) have completed at least 50 Human Intelligence Tasks (HITs), and 3) have been approved for 99% of the HITs completed. Following the evaluation protocol in prior work (Green and Chen, 2019a, b), each participant is randomly assigned to one of the explanation types, and their performance is evaluated on 10 random in-distribution examples and 10 random out-of-distribution examples. We do not allow any repeated participation. We used the software program G*Power to conduct a power analysis. Our goal was to obtain .95 power to detect a small effect size of .1 at the standard .01 alpha error probability using F-tests. As such, we employed 216 participants for each explanation type, which adds up to 1,296 participants per task. Note that our setup allows us to examine human performance on random samples beyond a fixed set of 20 examples, which alleviates the concern that our findings only hold on a dataset of 20 instances.
The median time taken to complete a HIT is 9 minutes and 22 seconds. Participants exposed to interactive conditions took 12 minutes, while participants exposed to non-interactive conditions took 7 minutes (see Fig. 26). Our focus in this work is on human performance, so we did not limit the amount of time in the experiments. Participants were allowed to spend as much time as they needed so that they were able to explore the full capacities of our interface. Participants were paid an average wage of $11.31 per hour. We leave consideration of efficiency (i.e., maintaining good performance while reducing duration of interactions) for future work.
4. RQ1: The Effect of In-distribution and Out-of-distribution Examples on Human Performance
| Task | IND (typical setup) | OOD (proposed setup) | ||||
|---|---|---|---|---|---|---|
| Human | AI | Difference between humans and AI | Human | AI | Difference between humans and AI | |
| ICPSR | 60.9 | 68.4 | 7.5 | 55.9 | 55.0 | 0.9 |
| COMPAS | 60.0 | 65.5 | 5.5 | 54.5 | 56.1 | 1.6 |
| BIOS | 63.5 | 84.1 | 20.6 | 68.4 | 76.6 | 8.2 |
| Deception detection (Lai et al., 2020; Lai and Tan, 2019) | 51 | 87.0 | 36 | — | — | — |
| LSAT (Bansal et al., 2021) | 58 | 65 | 7 | — | — | — |
| Beer reviews (Bansal et al., 2021) | 82 | 84 | 2 | — | — | — |
Our first research question examines how in-distribution and out-of-distribution examples affect the performance of human-AI teams. Recall that Bansal et al. (2021) hypothesize that comparable performance is important to achieve complementary performance. Table 3 compares the performance of human alone and AI alone in the three prediction tasks both in-distribution and out-of-distribution (we also add tasks from other papers to illustrate the ranges in prior work). The performance gap between human alone and AI alone in ICPSR and COMPAS is similar to tasks considered in Bansal et al. (2021). In BIOS, the in-distribution performance gap between human alone and AI alone is greater than the tasks in Bansal et al. (2021) but much smaller than deception detection, and the out-of-distribution performance gap between human alone and AI alone becomes similar to LSAT in Bansal et al. (2021). As a result, we believe that our chosen tasks somewhat satisfy the condition of “comparable performance” and allow us to study human-AI decision making over a variety of performance gaps between human alone and AI alone.
Note that AI performance here is calculated from the random samples shown in None/None (human alone), and is thus slightly different (1.2%) from AI performance in Fig. 3, which is calculated from the in-distribution and out-of-distribution test set of 180 examples each. To account for this sample randomness and compare human performance in different explanation types for these two distribution types, we need to establish a baseline given the random samples (we show absolute accuracy in the supplementary material as the performance difference without accounting for the baseline is misleading; see Fig. 12). Therefore, we calculate the accuracy difference on the same examples between a human-AI team and AI, and use accuracy gain as our main metric. Accuracy gain is positive if a human-AI team outperforms AI. In the rest of this paper, we will use human performance and the performance of human-AI teams interchangeably. Since the results are similar between ICPSR and COMPAS, we show the results for ICPSR in the main paper and include the figures for COMPAS in the supplementary materials (see Fig. 13-Fig. 17).
Preview of results. To facilitate the understanding of our complex results across tasks, we provide a preview of results before unpacking the details of each analysis. Our results indeed replicate existing findings that AI performs better than human-AI teams in in-distribution examples. However, human-AI teams fail to outperform AI in out-of-distribution examples. The silver lining is that the performance gap between human-AI teams and AI is smaller out-of-distribution than in-distribution. These results are robust across tasks (see Table 4 for a summary).
| IND (typical setup) | OOD (proposed setup) | |||||
| ICPSR | COMPAS | BIOS | ICPSR | COMPAS | BIOS | |
| AI performs better than human-AI teams in in-distribution examples. | ✓ | ✓ | ✓ | — | — | — |
| Human-AI teams perform better than AI in out-of-distribution examples. | — | — | — | ✗ | ✗ | ✗ |
| The performance difference between human-AI teams and AI is smaller out-of-distribution than in-distribution. | see the OOD columns | ✓ | ✓ | |||
| ✓: holds | : holds in at least half of the explanation types | |||||
| ✗: rejected | : rejected in all except one explanation type | |||||
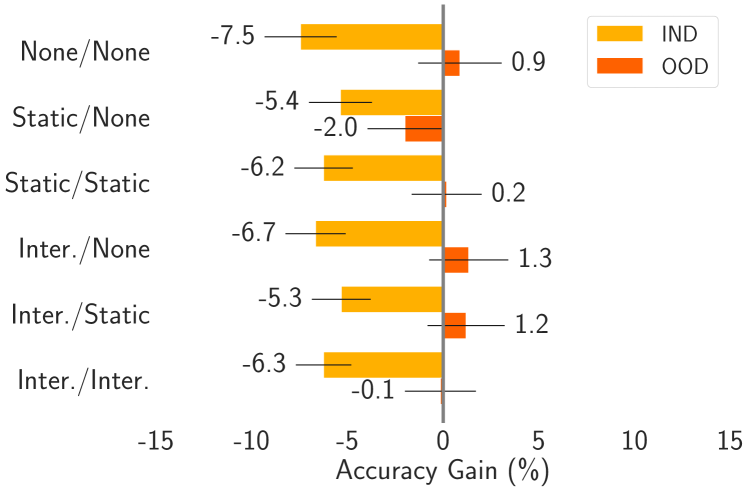
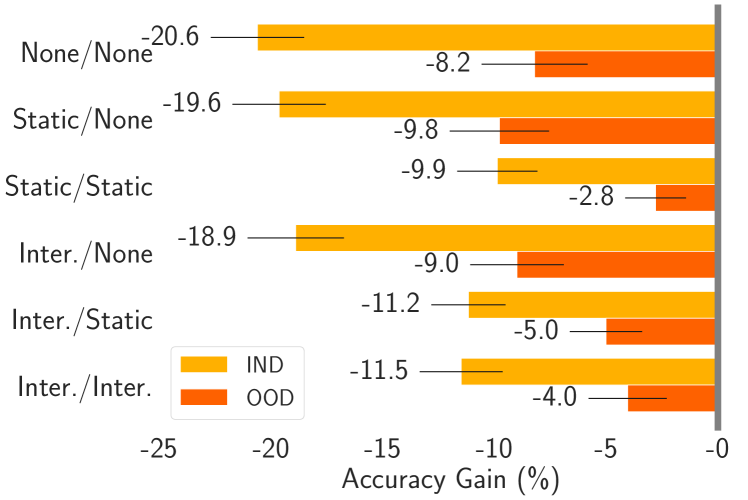
Human-AI teams underperform AI in in-distribution examples (see Fig. 7). We use -tests with Bonferroni correction to determine whether the accuracy gain for in-distribution examples is statistically significant. Consistent with Proposition 1, our results show that accuracy gain is negative across all explanation types (). In other words, the performance of human-AI teams is lower than AI performance for in-distribution examples. This observation also holds across all tasks, which means that AI may have an advantage in both challenging (ICPSR and COMPAS) and relatively simple tasks (BIOS) for humans if the test set follows a similar distribution as the training set (in-distribution).
Human-AI teams do not outperform AI in out-of-distribution examples, although the accuracy gain out-of-distribution is sometimes positive (see Fig. 7). Similarly, we use -tests with Bonferroni correction to determine whether the accuracy gain for out-of-distribution examples is statistically significant. The results are different than what we expected: humans seldom outperform AI in out-of-distribution examples. Interestingly, we observe quite different results across different tasks. In BIOS, accuracy gain is significantly below 0 across all explanation types (). In ICPSR and COMPAS, accuracy gain is occasionally positive, including None/None, Static/Static, Interactive/None, Interactive/Static in ICPSR, and Interactive/None in COMPAS, although none of them is statistically significant. The negative accuracy gain (Static/None) in ICPSR is not significant either. These results suggest that although AI performs worse out-of-distribution than in-distribution, it remains challenging for human-AI teams to outperform AI alone out-of-distribution. The performance of human-AI teams, however, becomes comparable to AI performance in challenging tasks such as recidivism prediction, partly because the performance of AI alone is more comparable to human alone out-of-distribution (e.g., 0.9% in ICPSR vs. -8.2% in BIOS in None/None (human alone) in Fig. 7).
Interestingly, Interactive/None leads to the highest accuracy gain in ICPSR, while Interactive/Interactive leads to a tiny negative gain, suggesting interactive explanations as real-time assistance might hurt human performance in ICPSR. We will elaborate on this observation in §6.
The performance gap between human-AI teams and AI is smaller in out-of-distribution examples than in in-distribution examples (see Fig. 7). We finally examine the difference between in-distribution and out-of-distribution examples. We use two approaches to determine whether there exists a significant difference. First, for each explanation type in each task, we test whether the accuracy gain in out-of-distribution examples is significantly different from that in in-distribution examples with -tests after Bonferroni correction. In both BIOS and COMPAS, accuracy gain is significantly greater in out-of-distribution examples than in in-distribution examples across all explanation types (). In ICPSR, accuracy gain is significantly greater in out-of-distribution examples than in in-distribution examples in all explanation types () except Static/None. Second, we conduct two-way ANOVA based on distribution types and explanation types. We focus on the effect of distribution types here and discuss the effect of explanation types in §6. We observe a strong effect of distribution type across all tasks (), suggesting a clear difference between in-distribution and out-of-distribution. Note that this reduced performance gap does not necessarily suggest that humans behave differently out-of-distribution from in-distribution, as it is possible that human performance stays the same and the reduced performance gap is simply due to a drop in AI performance. We further examine human agreement with AI predictions to shed light on the reasons behind this reduced performance gap.
In short, our results suggest a significant difference between in-distribution and out-of-distribution, and human-AI teams are more likely to perform well in comparison with AI out-of-distribution. These results are robust across different explanation types. In general, the accuracy gain is greater in recidivism prediction than in BIOS. After all, the in-distribution AI performance in BIOS is much stronger than humans without any assistance. This observation resonates with the hypothesis in Bansal et al. (2021) that comparable performance between humans and AI is related to complementary performance. However, we do not observe complementary performance in our experiments, which suggests that comparable performance between humans and AI alone is insufficient for complementary performance.
5. RQ2: Agreement/Trust of Humans with AI
| IND (typical setup) | OOD (proposed setup) | |||||
| ICPSR | COMPAS | BIOS | ICPSR | COMPAS | BIOS | |
| Agreement is higher in-distribution than out-of-distribution. | see the OOD columns | ✓ | ||||
| Agreement is higher when AI predictions are correct (appropriate agreement) than when AI predictions are wrong (overtrust). | ✗ | ✓ | ✓ | |||
| When AI predictions are correct, agreement (appropriate agreement) is higher in-distribution than out-of-distribution. | see the OOD columns | ✗ | ! | |||
| When AI predictions are wrong, agreement (overtrust) is higher in-distribution than out-of-distribution. | see the OOD columns | ✓ | ||||
| ✓: holds | : holds in at least half of the explanation types | |||||
| ✗: rejected | : rejected in all except one explanation type | |||||
| !: mostly supported in the reverse direction except one explanation type | : reversed only in one explanation type | |||||
Our second research question examines how well human predictions agree with AI predictions depending on the distribution type. Agreement is defined as the percentage of examples where the human gives the same prediction as AI. Humans have access to AI predictions in Static/Static, Interactive/Static, Interactive/Interactive, so agreement in these explanation types may be interpreted as how much trust humans place in AI predictions (we use overtrust to refer to agreement with incorrect predictions in all explanation types). Since both ICPSR and COMPAS yield similar results, we show ICPSR results in the main paper and COMPAS in the supplementary materials (see Fig. 13-Fig. 17).
Preview of results. Different from results in performance, we observe intriguing differences across tasks. Our results show that humans tend to show higher agreement with AI predictions in in-distribution examples than out-of-distribution examples in ICPSR and COMPAS, but not in BIOS. When it comes to appropriate agreement vs. overtrust, the results depend on distribution types. We first compare the extent of appropriate agreement and overtrust in the same distribution type. In out-of-distribution examples, human agreement with AI predictions is higher when AI predictions are correct than when AI predictions are wrong (appropriate agreement exceeds overtrust). But for in-distribution examples, this is only true for BIOS, but false in ICPSR and COMPAS. To further understand these results, we compare appropriate agreement and overtrust in-distribution to out-of-distribution. We find that both appropriate agreement and overtrust are stronger in-distribution than out-of-distribution in ICPSR, but in BIOS, the main statistical significant results are that appropriate agreement is stronger out-of-distribution than in-distribution. See Table 5 for a summary.
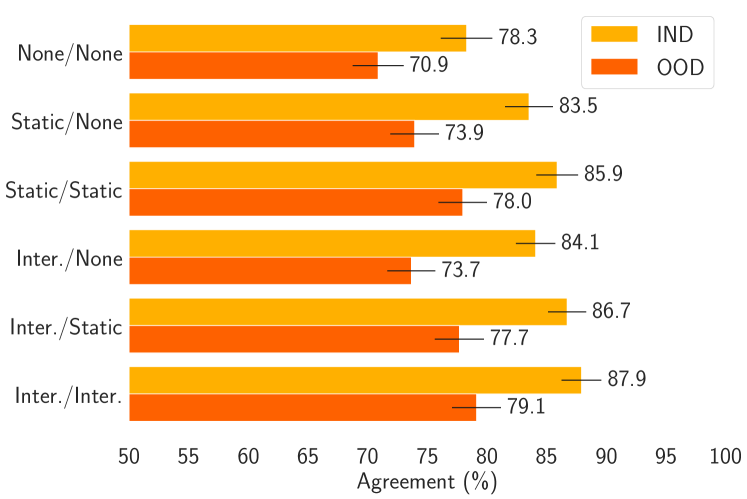
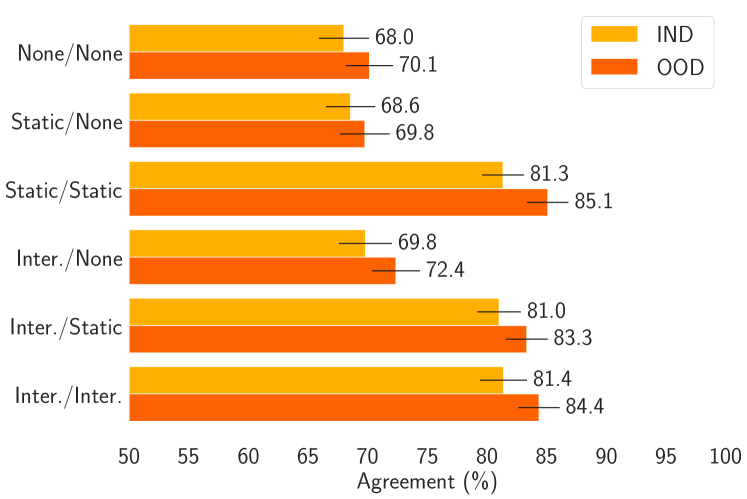
Humans are more likely to agree with AI on in-distribution examples than out-of-distribution examples in ICPSR and COMPAS, but not in BIOS (see Fig. 8). As AI performance is typically better in-distribution than out-of-distribution, we expect humans to agree with AI predictions more often in-distribution than out-of-distribution. To determine whether the difference is significant, we use -test with Bonferroni correction for each explanation type in Fig. 8. In ICPSR, agreement is indeed significantly greater in-distribution than out-of-distribution in all explanation types (). In COMPAS, in-distribution agreement is significantly higher in all explanation types ( in None/None, in Static/None and Interactive/Interactive, in Interactive/None) except Static/Static and Interactive/Static (see Fig. 14). These results suggest that in ICPSR and COMPAS, humans indeed behave more differently from AI out-of-distribution. However, in BIOS, we find the agreement is generally higher for out-of-distribution examples than for in-distribution examples, and the difference is statistically significant in Static/Static (). Note that the agreement difference between in-distribution and out-of-distribution is much smaller in BIOS (4%, usually within 2%) than in ICPSR and COMPAS (10%).
These results echo observations in our virtual pilot studies that humans are more confident in themselves when detecting professions and are less affected by in-distribution vs. out-of-distribution differences, and may turn to AI predictions out-of-distribution because the text is too short for them to determine the label confidently. In comparison, the fact that humans agree with AI predictions less out-of-distribution than in-distribution in recidivism prediction suggests that humans seem to recognize that AI predictions are more likely to be wrong out-of-distribution than in-distribution in ICPSR and COMPAS. To further unpack this observation, we analyze human agreement with correct AI predictions vs. incorrect AI predictions.
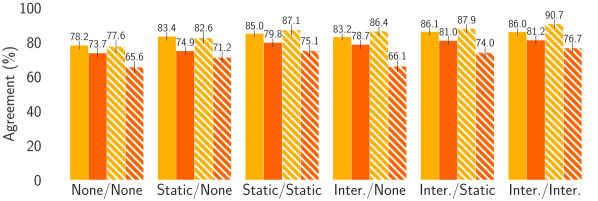
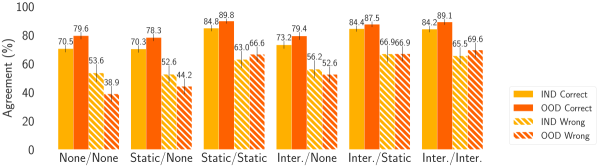
Out-of-distribution appropriate agreement mostly exceeds out-of-distribution overtrust in all of the three tasks; in-distribution appropriate agreement exceeds in-distribution overtrust only in BIOS (see Fig. 9). We next examine the role of distribution type in whether humans can somehow distinguish when AI is correct from when AI is wrong. First, for each distribution type, we use -test with Bonferroni correction to determine if humans agree with AI more when AI predictions are correct. Consistent with prior work (Lai and Tan, 2019; Bansal et al., 2021), we find that human-AI teams are more likely to agree with AI when AI predictions are correct than when AI predictions are wrong in most explanation types. This is true both in-distribution and out-of-distribution in BIOS (): the agreement gap between correct and incorrect AI predictions is close to 20%, and even reaches 30%-40% out-of-distribution with some explanation types (Fig. 9(b)). In ICPSR and COMPAS, we mostly find significantly greater appropriate agreement than overtrust out-of-distribution. In fact, IND appropriate agreement tends to be lower than IND overtrust, though only significantly in Interactive/Interactive () in ICPSR. In comparison, for out-of-distribution examples, appropriate agreement is significantly higher than overtrust in three explanation types in ICPSR ( in None/None, Interactive/None, and Interactive/Static). In COMPAS, appropriate agreement is also significantly higher than overtrust in out-of-distribution examples ( in None/None and Interactive/Static, in Static/None and Interactive/None) except Static/Static and Interactive/Interactive (see Fig. 15). These results are especially intriguing as they suggest that although the performance of human alone and AI alone is worse out-of-distribution than in-distribution in recidivism prediction, humans can more accurately detect AI mistakes, which explains the small positive accuracy gain in Fig. 7.
In-distribution and out-of-distribution appropriate agreement comparison shows different results in each of the three tasks (see Fig. 9). We further compare human agreement between in-distribution and out-of-distribution when AI is correct. Similarly, we use -tests with Bonferroni corrections for each explanation type. Different from our expectation, appropriate agreement is significantly higher out-of-distribution than in-distribution in all explanation types in BIOS except Interactive/Static ( in None/None and Static/None; in Static/Static, Interactive/None, and Interactive/Interactive). This is consistent with the observation of higher overall agreement out-of-distribution than in-distribution in BIOS in Fig. 8. In ICPSR, appropriate agreement for in-distribution examples is significantly higher than for out-of-distribution examples in all explanation types except None/None ( in Interactive/None, Interactive/Static, and Interactive/Interactive, in Static/None and Static/Static). In COMPAS, no significant difference is found between in-distribution and out-of-distribution.
These results suggest that appropriate agreement is stronger out-of-distribution than in-distribution in BIOS. In other words, humans can recognize correct AI predictions better out-of-distribution than in-distribution. This could relate to that humans have higher confidence in their own predictions when the text is longer. As a result, they are more likely to overrule correct AI predictions. However, appropriate agreement is stronger in-distribution than out-of-distribution in ICPSR, which relatively weakens the performance of human-AI teams compared to AI alone out-of-distribution, and suggests that a reduced overtrust is the main contributor to the aforementioned reduced performance gap. In comparison, it seems that in COMPAS, humans simply tend to agree with AI predictions more in-distribution than out-of-distribution, without the ability to recognize when AI predictions are correct.
Overtrust is lower out-of-distribution than in-distribution in ICPSR and COMPAS, but not in BIOS (see Fig. 9). In comparison, when AI predictions are wrong, human agreement is significantly lower for out-of-distribution examples than in-distribution examples in all explanation types () in ICPSR. This also holds for some explanation types ( in Static/None, Interactive/None, and Interactive/Static) in COMPAS. However, overtrust in in-distribution examples has no significant difference from out-of-distribution examples in BIOS except for None/None (). These results suggest that in recidivism prediction, human decisions contradict wrong AI predictions out-of-distribution more accurately than in-distribution, but it is not the case in BIOS.
In summary, the contrast between appropriate agreement and overtrust is interesting as it explains the different stories behind the reduced performance gap out-of-distribution compared to in-distribution in ICPSR and in BIOS: the reduced performance gap in BIOS is mainly attributed to the higher appropriate agreement out-of-distribution, while the reduced performance gap in ICPSR is driven by the lower overtrust out-of-distribution. These results may relate to the task difficulty for humans. Recidivism prediction is more challenging for humans and the advantage of humans may lie in the ability to recognize obvious AI mistakes. In constrast, as humans are more confident in their predictions in BIOS, it is useful that they avoid overruling correct AI predictions. Such asymmetric shifts in agreement rates highlight the complementary insights that humans can offer when working with AI assistance and suggest interesting design opportunities to leverage human expertise in detecting AI mistakes.
6. RQ3: The Effect of Interactive Explanations
In this section, we focus on the effect of interactive explanations in human decision making. We revisit human performance and human agreement and then examine human perception of AI assistance’s usefulness collected in our exit survey. Finally, for ICPSR and COMPAS, we take a deep look at the most important features reported by humans in the exit survey to understand the limited improvement in the performance of human-AI teams.
Preview of results. In general, we do not find significant impact from interactive explanations with respect to the performance of human-AI team or human agreement with wrong AI predictions, compared to static explanations. However, humans are more likely to find AI assistance useful with interactive explanations than static explanations in ICPSR and COMPAS, but not in BIOS. Table 6 summarizes the results.
| IND (typical setup) | OOD (proposed setup) | |||||
| ICPSR | COMPAS | BIOS | ICPSR | COMPAS | BIOS | |
| Interactive explanations lead to better human-AI team performance. | ✗ | ✗ | ✗ | ✗ | ✗ | ✗ |
| Interactive explanations lead to lower human agreement with wrong AI predictions (overtrust). | ✗ | ✗ | ✗ | ✗ | ✗ | ✗ |
| Human-AI teams are more likely to find AI assistance useful with interactive explanations. | see the OOD columns | ✗ | ||||
| ✓: holds | : holds in at least half of the explanation types | |||||
| ✗: rejected | : rejected in all except one explanation type | |||||
Real-time assistance leads to better performance than no assistance in BIOS, but interactive explanations do not lead to better human-AI performance than AI alone (see Fig. 7). We conduct one-way ANOVA on explanation type for in-distribution and out-of-distribution separately on human performance due to the clear difference between in-distribution and out-of-distribution. We find that explanation type affects human performance in both distribution types significantly in BIOS (), but not in ICPSR ( IND, OOD) nor in COMPAS ( IND, OOD). We further use Tukey’s HSD test to see if differences between explanation types are significant. In BIOS, we find Static/Static, Interactive/Static, and Interactive/Interactive have significantly better performance than None/None, Static/None, and Interactive/None for in-distribution examples (). For out-of-distribution examples, we have almost the same observation () except that the difference between Interactive/Static and None/None is no longer significant. These results suggest that real-time assistance in the prediction phase improves human performance in BIOS, consistent with (Lai and Tan, 2019; Bansal et al., 2021), although there is no significant difference between static and interactive explanations. In ICPSR and COMPAS, no significant difference exists between any pair of explanation types. In other words, no explanation type leads to better nor worse human-AI team performance in recidivism prediction.
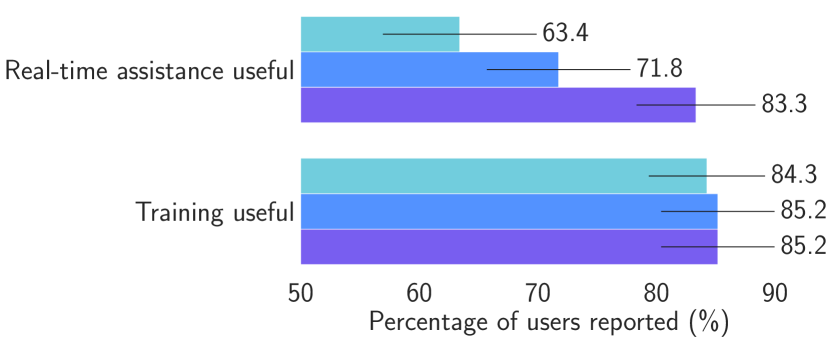
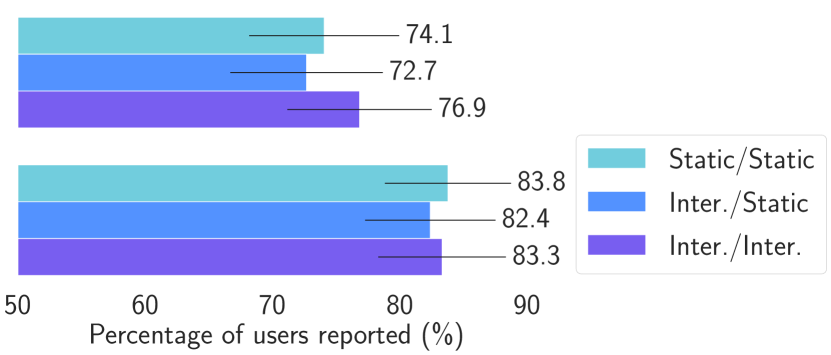
Interactive explanations do not lead to significantly lower overtrust (see Fig. 9). We use one-way ANOVA to determine whether significant differences in overtrust exist between different explanation types. We also do this separately for in-distribution and out-of-distribution examples. We observe a strong effect in all tasks in both distributions (). However, Tukey’s HSD test shows overtrust in Interactive/Interactive is not statistically different from Static/Static; similarly, Interactive/None is not statistically different from Static/None either. The strong effect comes from the significant differences between explanation types with real-time assistance and those without, likely because predicted labels are shown in real-time assistance. For example, in out-of-distribution examples in BIOS, three explanation types without real-time assistance (None/None, Static/None, Interactive/None) have significantly lower overtrust than the three with real-time assistance (Static/Static, Interactive/Static, Interactive/Interactive) ( for most pairs; for Interactive/None vs. Static/Static and Interactive/None vs. Interactive/Static). Similarly, in out-of-distribution examples in ICPSR, None/None and Interactive/None has significantly lower overtrust than Static/Static, Interactive/Static, and Interactive/Interactive ( for most pairs; for None/None vs. Interstatic/Static, Interactive/None vs. Static/Static, and Interactive/None vs. Interactive/Static). In fact, Interactive/Interactive has the highest overtrust in both in-distribution and out-of-distribution examples in ICPSR. Results in COMPAS are qualitatively similar (see Fig. 14).101010For in-distribution overtrust, None/None is significantly lower than explanation types with real-time assistance ( in Static/Static; in Interactive/Static and Interactive/Interactive). For out-of-distribution overtrust, all explanation types without real-time assistance are significantly lower than Static/Static () and Interactive/Interactive (). However, similarly to ICPSR, we do not see significantly lower overtrust in interactive explanations than in static explanations either in-distribution or out-of-distribution.
These results are contrary to our expectation: interactive explanations do not lead to lower overtrust. In fact, they lead to the highest overtrust in ICPSR, so they may not encourage users to critique incorrect AI predictions. Our observations also resonate with prior work that shows higher overall agreement with AI predictions when predicted labels are shown (Lai et al., 2020; Lai and Tan, 2019).
Human-AI teams are more likely to find AI assistance useful with interactive explanations in ICPSR and COMPAS, but not in BIOS (see Fig. 10). We ask participants whether they find training and real-time assistance useful when applicable. Since only Static/Static, Interactive/Static, and Interactive/Interactive have real-time assistance, we focus our analysis here on these three explanation types. We use one-way ANOVA to test the effect of explanation type for the usefulness of training and real-time AI assistance separately. For training, the effect of explanation type is significant only in COMPAS (). With Tukey’s HSD test, we find the perception of training usefulness is significantly higher in Interactive/Interactive than in Static/Static (). These results show that human-AI team with interactive explanations are more likely to find training useful in COMPAS.
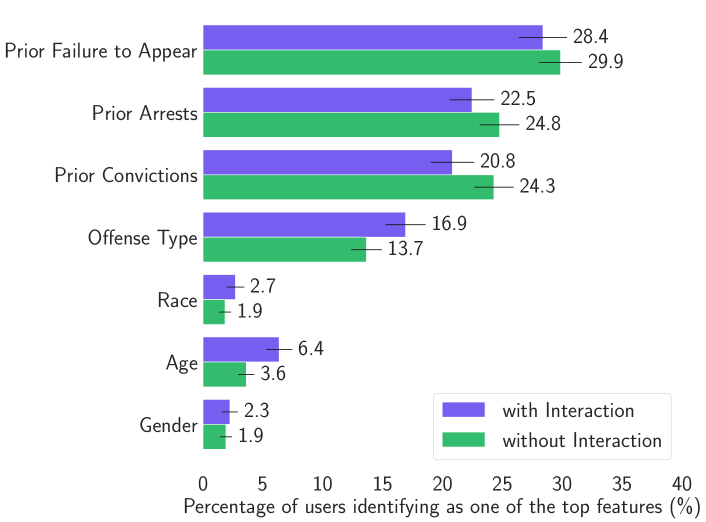
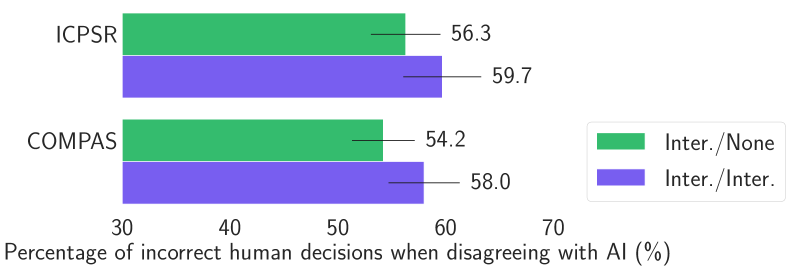
For perception of real-time assistance, explanation type has a significant effect in COMPAS () and ICPSR (), but not in BIOS (). We also use Tukey’s HSD test to determine whether there is a pairwise difference among explanation types. In COMPAS, Interactive/Interactive achieves a significantly higher human perception of real-time assistance usefulness than both Static/Static () and Interactive/Static () (see Fig. 16). Perception of Interactive/Static is also significantly higher than that of Static/Static (). We find similar results in ICPSR except that the difference between Static/Static and Interactive/Static is not significant. In BIOS, Interactive/Interactive has the highest human perception of AI assistance usefulness, but no significant difference is found. These results suggest that with interactive explanations, human-AI teams perceive real-time assistance as more useful, especially in recidivism prediction. A possible reason is that human perception of usefulness depends on the difficulty of tasks. COMPAS is more challenging than BIOS to humans as recidivism prediction is not an average person’s experience, thus interactive explanations may have decreased the difficulty of the task in perception.
Exploratory study on important features. Finally, since there are only seven features in ICPSR and COMPAS, we asked participants to identify the top three most important features that made the biggest influence on their own predictions in the exit survey (see Fig. 28 for the wording of all survey questions). We also identify important features based on Spearman correlation as a comparison point. The top three are (“Prior Failure to Appear”, “Prior Arrests”, “Prior Convictions”) in ICPSR, and (“Prior Crimes”, “Age”, and “Race”) in COMPAS. By comparing these computationally important features with human-perceived important features, we can identify potential biases in human perception to better understand the limited performance improvement.
Fig. 11(a) shows the percentage of participants that choose each feature as an important feature for their decisions in ICPSR. We group participants based on explanation types: 1) without interactions (Static/None and Static/Static) and 2) with interactions (Interactive/None, Interactive/Static, and Interactive/Interactive). Humans largely choose the top computationally important features in both groups in ICPSR. We use -test with Bonferroni correction to test whether there is a difference between the two groups. In ICPSR, we find participants with interaction choose significantly more “Age” and “Offense Type”, but less “Prior Convictions” (all ). In fact, participants with interaction are less likely to choose all of the top three features than those without. In COMPAS (see Fig. 17), we find participants with interaction choose significantly more “Race” and “Sex”, but less “Charge Degree” ( in “Race”, in “Sex” and “Charge Degree”). These results suggest that participants with interaction are more likely to fixate on demographic features and potentially reinforce human biases,111111Race is indeed important in COMPAS, so this might be justified to a certain extent. but are less likely to identify computationally important features in ICPSR and COMPAS.
This observation may also relate to why interactive explanations do not lead to better performance of human-AI teams. We thus hypothesize that participants with interaction make more mistakes when they disagree with AI predictions, which can explain the performance difference between Interactive/None and Interactive/Interactive in Fig. 7. Fig. 8 shows that users disagree with AI predictions less frequently in Interactive/Interactive than in Interactive/None, and Fig. 11(b) further shows that they are indeed more likely to be wrong when they disagree (not statistically significant).
7. Discussion
In this work, we investigate the effect of out-of-distribution examples and interactive explanations on human-AI decision making through both virtual pilot studies and large-scale, randomized human subject experiments. Consistent with prior work, our results show that the performance of human-AI teams is lower than AI alone in-distribution. This performance gap becomes smaller out-of-distribution, suggesting a clear difference between in-distribution and out-of-distribution, although complementary performance is not yet achieved. We also observe intriguing differences between tasks with respect to human agreement with AI predictions. For instance, participants in ICPSR and COMPAS agree with AI predictions more in-distribution than out-of-distribution, which is consistent with AI performance differences in-distribution and out-of-distribution, but it is not the case in BIOS. As for the effect of interactive explanations, although they fail to improve the performance of human-AI teams, they tend to improve human perception of AI assistance’s usefulness, with an important caveat of potentially reinforcing human biases.
Our work highlights the promise and importance of exploring out-of-distribution examples. The performance gap between human-AI teams and AI alone is smaller out-of-distribution than in-distribution both in recidivism prediction, where the task is challenging and humans show comparable performance with AI, and in BIOS, where the task is easier for both humans and AI but AI demonstrates a bigger advantage than humans. However, complementary performance is not achieved in our experiments, suggesting that out-of-distribution examples and interactive explanations (as we approach them) are not the only missing ingredients. Similarly, comparable performance alone might not be a sufficient condition for complementary performance. While results with respect to human-AI team performance and the effect of interactive explanations are relatively stable across tasks, the intriguing differences in human agreement with AI predictions between tasks demonstrate the important role of tasks and the complexity of interpreting findings in this area. We group our discussion of implications by out-of-distribution experiment design, interactive explanations, and choice of tasks, and then conclude with other limitations.
Out-of-distribution experimental design. The clear differences between in-distribution and out-of-distribution suggest that distribution type should be an important factor when designing experimental studies on human-AI decision making. Our results also indicate that it is promising to reduce the performance gap between human-AI teams and AI for out-of-distribution examples, as AI is more likely to suffer from distribution shift. Out-of-distribution examples, together with typical in-distribution examples, provide a more realistic examination of human-AI decision making and represent an important direction to examine how humans and AI complement each other.
However, it remains an open question of what the best practice is for evaluating the performance of human-AI teams out-of-distribution.121212Concurrently with this work, Chiang and Yin (2021) investigates human reliance on machine predictions when humans are aware of distribution shifts. To simulate out-of-distribution examples, we use separate bins based on an attribute (age for ICPSR and COMPAS; length for BIOS). Our setup is realistic in the sense that it is possible that age distribution in the training data differs from the testing data and leads to worse generalization performance in out-of-distribution examples in recidivism prediction. Similarly, length is a sensible dimension for distributon mistach in text classification. That said, our choice of separate bins leads to non-overlapping out-of-distribution and in-distribution examples. In practice, the difference between out-of-distribution and in-distribution can be continuous and subtle to quantify (Koh et al., 2021). From an experimental point of view, it is challenging to investiage the effect of out-of-distribution examples on a continuous spectrum, and out-of-distribution examples that are very close to in-distribution examples may not be interesting to study. As a result, it makes sense to zoom in on the challenging out-of-distribution examples and have a clear separation between in-distribution and out-of-distribution. We believe that our design represents a reasonable first attempt in understanding the effect of out-of-distribution examples and future work is required to address the spectrum of out-of-distribution.
Notably, a side effect of our split is that out-of-distribution examples are more difficult than in-distribution examples for humans in recidivism prediction (but not in BIOS; see Fig. 12). We encourage future work to examine to what extent this is true in practice and how this shift affects human decision making. Furthermore, out-of-distribution examples might benefit from new feature representations, which humans can extract, pointing to novel interaction with AI. Overall, many research questions emerge in designing experiments and interfaces to effectively integrate humans and AI under distribution shift.
Interactive explanations and appropriate trust in AI predictions. We find that interactive explanations improve human perception of AI assistance but fail to improve the performance of human-AI teams. While the idea of interactive explanations is exciting, our implementation of interactive explanations seems insufficient. That said, our results suggest future directions for interactive explanations: 1) detecting out-of-distribution examples and helping users calibrate their trust in-distribution and out-of-distribution (e.g., by suggesting how similar an example is to the training set); 2) automatic counterfactual suggestions (Wachter et al., 2017) to help users navigate the decision boundary as it might be difficult for decision makers to come up with counterfactuals on their own; 3) disagreement-driven assistance that frames the decision as to whether to agree with AI predictions or not and help decision makers explore features accordingly.
Meanwhile, we show that interactive explanations may reinforce human biases. While this observation is preliminary and further work is required to understand the effect of interactive explanations on human biases, this concern is consistent with prior work showing that explanations, including random ones, may improve people’s trust in AI predictions (Lai and Tan, 2019; Bansal et al., 2021; Green and Chen, 2019a, b). Therefore, it is important to stay cautious about the potential drawback of interactive explanations and help humans not only detect issues in AI predictions but also reflect biases from themselves. Future work is required to justify these interactive explanations to be deployed to support human decision making.
Choice of tasks and the complexity of interpreting findings in human-AI decision making. Our work suggests tasks can play an important role and it can be challenging to understand the generalizability of findings across tasks. We observe intriguing differences with respect to human agreement with AI predictions between recidivism prediction and BIOS. A surprising finding is that humans agree with AI predictions more out-of-distribution than in-distribution in BIOS, despite that AI performs worse out-of-distribution than in-distribution. Furthermore, there exists an asymmetry of human agreement with AI predictions when comparing OOD with IND: the reduced performance gap out-of-distribution in recidivism prediction is because humans are less likely to agree with incorrect predictions OOD than IND, but the reduced performance gap in BIOS is due to that humans are more likely to agree with correct AI predictions OOD than IND. This asymmetry indicates that humans perform better relatively with AI OOD than IND for different reasons in different tasks. One possible interpretation of this observation is that humans can complement AI in different ways in different tasks. To best leverage human insights, it may be useful to design appropriate interfaces that guide humans to find reasons to respectively reject AI predictions or accept AI predictions.
Moreover, by exploring tasks with different performance gaps, our results suggest that comparable performance alone might not be sufficient for complementary performance, echoing the discussion in Bansal et al. (2021). These differences could be driven by many possible factors related to tasks, including difficulty levels, performance gap, and human expertise/confidence. Although these factors render it difficult to assess the generalizability of findings across tasks, it is important to explore the diverse space and understand how the choice of tasks may induce different results in the emerging area of human-AI interaction. We hope that our experiments provide valuable samples for future studies to explore the question of what tasks should be used and how findings would generalize in the context of human-AI decision making.
Our choice of tasks is aligned with the discovering mode proposed in Lai et al. (2020), where AI can identify counterintuitive patterns and humans may benefit from AI assistance beyond efficiency. In contrast, humans define the labels in tasks such as question answering and object recognition in the emulating mode, in which case improving performance is essentially improving the quality of data annotation. We argue that improvement in these two cases can be qualitatively different.
We include recidivism prediction because of its societal importance. One might argue that complementary performance is not achieved because crowdworkers are not representative of decision makers in this task (i.e., judges) and recidivism prediction might be too difficult for humans. Indeed, crowdworkers are not the best demographic for recidivism prediction and lack relevant experieince compared to judges. That said, we hypothesized that complementary performance is possible in recidivism prediction because 1) humans and AI show comparable performance, in fact 1% out-of-distribution (as a result, the bar to exceed AI performance out-of-distribution is quite low and the absolute performance is similar to LSAT in Bansal et al. (2021)); 2) prior studies have developed valuable insights on this task with mechanical turkers (Green and Chen, 2019a, b) and mechanical turkers outperform random guessing, indicating that they can potentially offer valuable insights, despite their lack of experience compared to judges. Therefore, we believe that this was a reasonable attempt, although it is possible that the performance of judge-AI teams would differ. As for the difficulty of this task, it is useful to note that this task is challenging for judges as well. This difficulty might have contribued to the elusiveness of complementary performance, but is also why it is especially important to improve human performance in these challenging tasks where human performance is low, ideally while preserving human agency.
To complement recidivism prediction, we chose BIOS because humans including mechanical turkers have strong intuitions about this task and can potentially provide complementary insights from AI. Indeed, mechanical turkers are more likely to override wrong AI predictions in BIOS than in recidivism prediction. However, the performance gap between AI and humans in BIOS might be too big to count as “comparable”. As “comparable performance” is a new term, it is difficult to quantify and decide what performance gap constitutes comparable performance.
Model complexity and other limitations. In this work, we have focused on linear models because they are relatively simple to “explain”. However, a growing body of work has shown that “explaining” linear models is non-trivial in a wide variety of tasks (Lai et al., 2020; Poursabzi-Sangdeh et al., 2021). We speculate that the reason is that the relatively simple patterns in linear models are still challenging for humans to make sense of, e.g., why violent crimes are associated with “will not violate pretrial terms”. Humans need to infer the reason might be that the consequence is substantial in that scenario. We expect such challenges to be even more salient for complex deep learning models. We leave it to future work for examining the role of model complexity in human-AI decision making.
Our limitations in samples of human subjects also apply to our virtual pilot studies. University students are not necessarily representative of decision makers for each task. Our findings may depend on the sample population, although it is reassuring that both virtual pilot studies and large-scale, randomized experiments show that humans may not identify important features or effectively use patterns identified by AI.
Acknowledgments
We thank anonymous reviewers for their insightful suggestions and comments. We thank all members of the Chicago Human+AI Lab for feedbacks on early versions of our website interface. All experiments were approved by the University of Colorado IRB (20-0012). This work was supported in part by NSF grants IIS-1837986, 2040989, 2125116, and 2125113.
Appendix A Human Performance in Absolute Accuracy
Fig. 12 shows human performance in absolute accuracy.
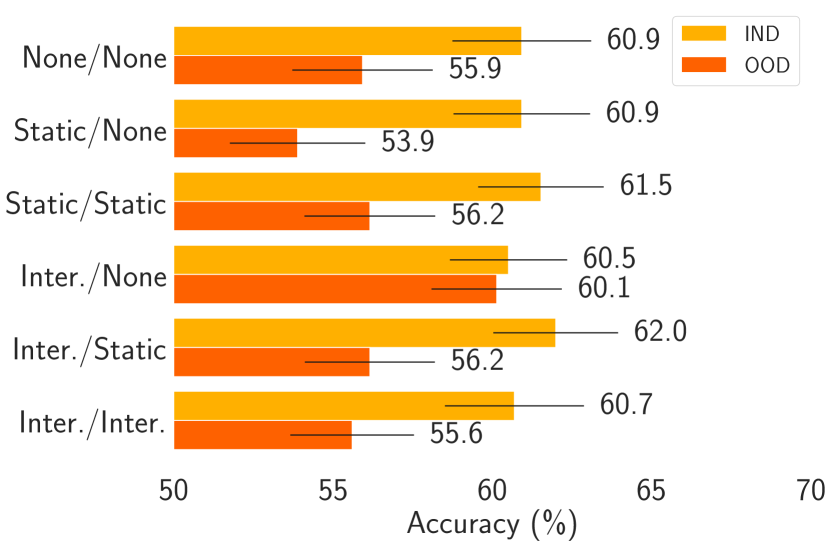
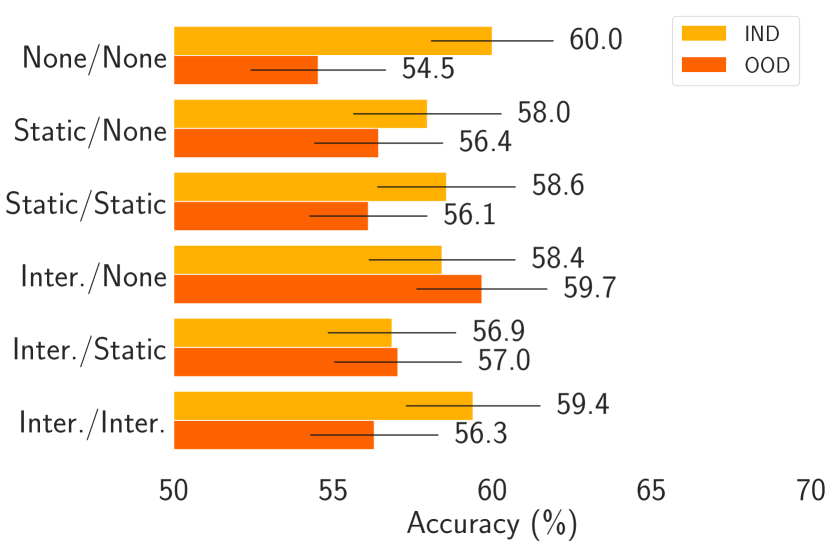
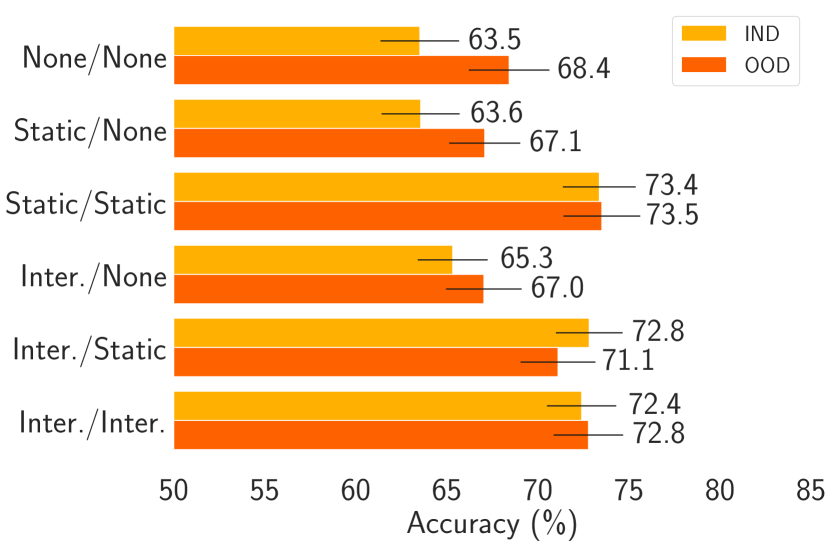
Appendix B COMPAS Figures
We also present the figures related to our hypotheses and results for COMPAS. The accuracy gain in COMPAS is shown in Fig. 13. The agreement and agreement by correctness are shown in Fig. 14 and Fig. 15. The subjective perception on whether real-time assistance is useful and whether training is useful is shown in Fig. 16. Fig. 17 shows the percentage of participants who rate a feature important.
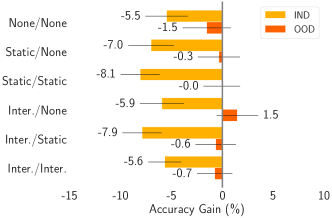
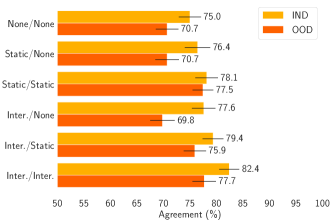
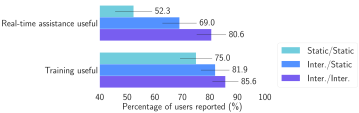
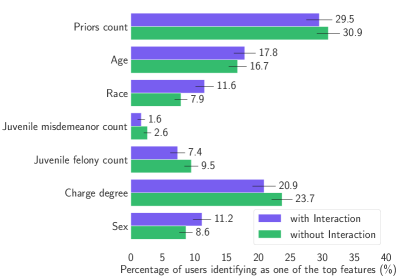
Appendix C In-distribution vs. Out-of-distribution Setup
In this section, we will explain how we split in-distribution examples and out-of-distribution examples in ICPSR as an demonstration of the in-distribution vs. out-of-distribution setup procedures. First, we need to select an attribute for splitting. For each candidate attribute, we split the data into 10 bins of equal size based on this attribute. We do this because we want to explore different settings of splitting, e.g. different ranges of bins to use for training. In other words, we hope to have as much control as possible when we consider which bins are IND and which are OOD. For example in Fig. 18(a) we show the histogram of four candidate attributes that we can use to split the examples. The distribution is so extreme in Gender and Prior Arrests (too many “Male” in Gender and too many “10” in Prior Arrests) that if we choose any of these two attributes, we would have no choice but to use nearly half of our data as either IND or OOD, because we want to avoid having the same value in both distribution types. Similarly Prior Convictions also limits our choices of bins due to its extreme distribution. Since there are too many instances with value “,” bin 1 and bin 2 would both consist of defendants who have prior convictions after binning. If we were to use a splitting where bin 1 is IND and bin 2 is OOD, then this splitting does not make sense (one distribution type falls into the other’s distribution). Therefore we finally choose Age as the attribute. We also design desiderata 3) for the in-distribution vs. out-of-distribution setup to avoid these situations.
After selecting the attribute, we also need to decide which bins we use as in-distribution examples and which bins as out-of-distribution examples. In ICPSR, the options we explore are: 1) bin 1-5 as IND: age 30 as IND and age 30 as OOD. 2) bin 4-7 as IND: age between 25-36 as IND and age 25 or age 36 as OOD; 3) bin 4-10 as IND: age 25 as IND and age 25 as OOD; We finally settled on option 3) because it gives us the largest performance gap between in-distribution examples and out-of-distribution examples (Fig. 18(b)). Note that this performance gap looks different from what we present in Fig. 2 in the main paper because here we use the entire testset (after balancing labels) for evaluation, instead of the 360 randomly sampled examples we prepare for the user study. The in-distribution examples in the random samples are easier for AI, therefore giving us an even larger performance gap between in-distribution and out-of-distribution.
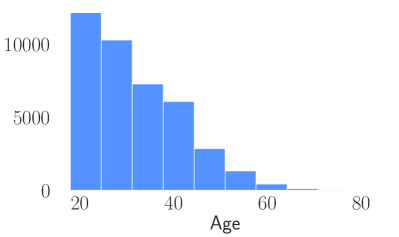
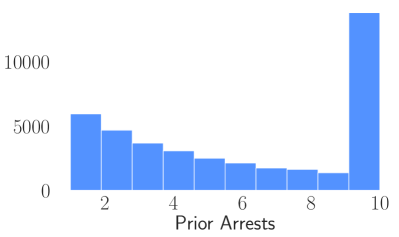
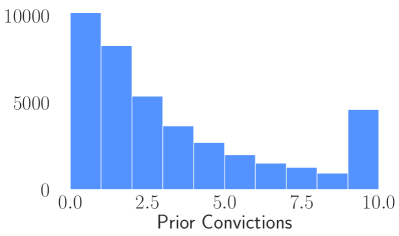
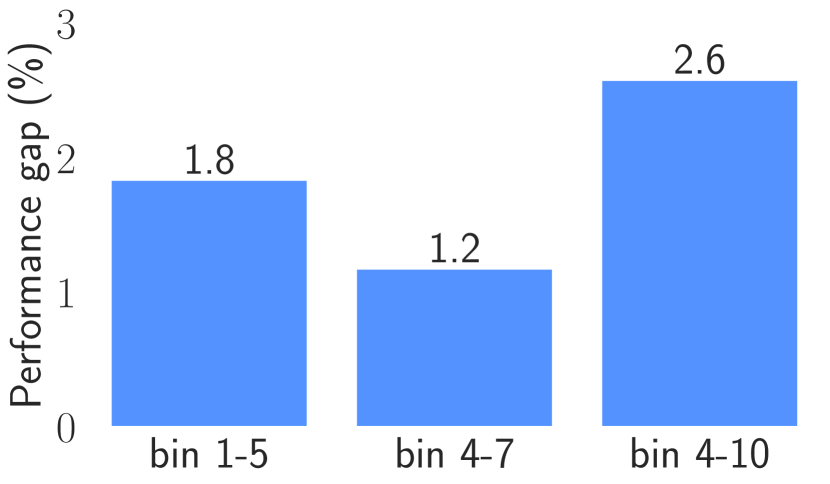
The performance gap for bin 1-5 is 1.8, for bin 4-7 is i.2, and for bin 4-10 is 2.6.
Appendix D User Interface Designs
Screenshots for static assistance for COMPAS. Fig. 19 shows the static assistance for COMPAS.
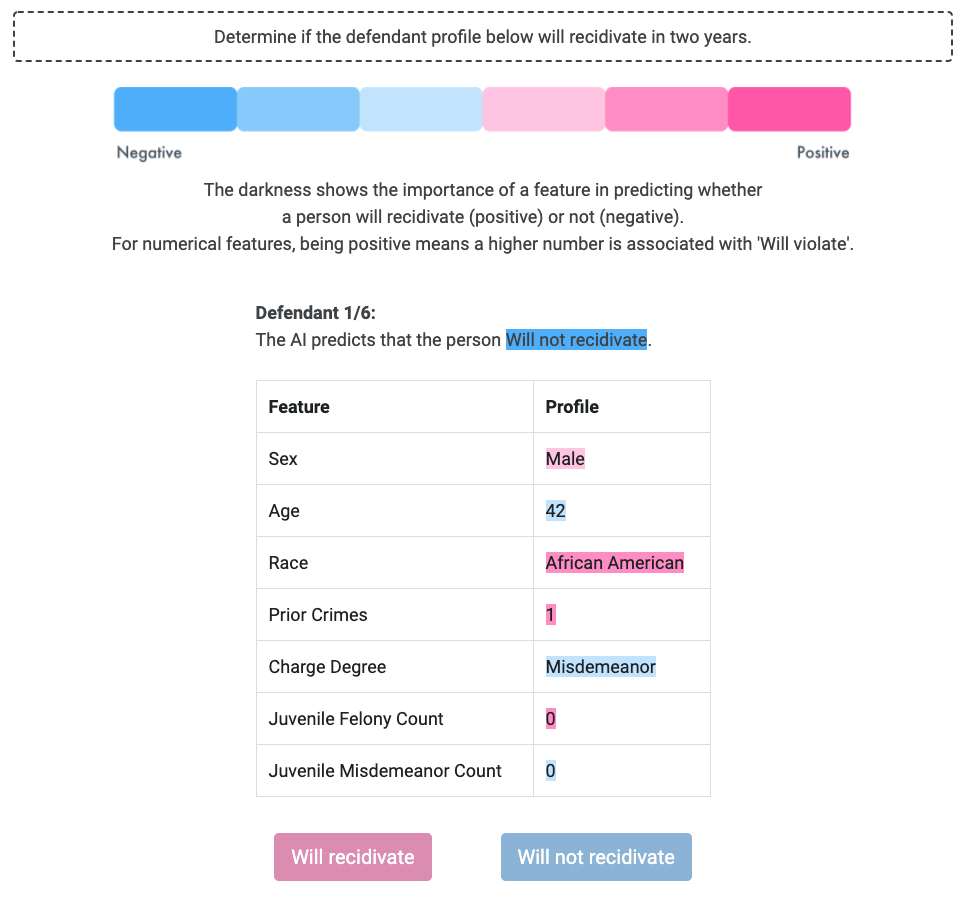
Interactive interface for COMPAS. Fig. 20 shows the interactive interface for COMPAS.

Picture shows an interactive console that allows user to manipulate feature values with sliders and radio buttons. Changes in feature values may result in a change of the AI prediction. A table on the right of the picture displays feature coefficients.
Attention check. In the recidivism prediction task, many participants found one of the attention-check questions to be very tricky. As the purpose of the attention-check questions was not to intentionally trick users into answering the wrong answer, we made edits to one of the attention-check questions to remove any confusion. In addition, many participants felt that it was better if they could refer to the definitions of certain terminology. As such, we combined the instructions and attention-check questions step in one page so participants are able to look up on the definitions if they had forgotten. Fig. 23 shows screenshots of attention check questions in all the three tasks.
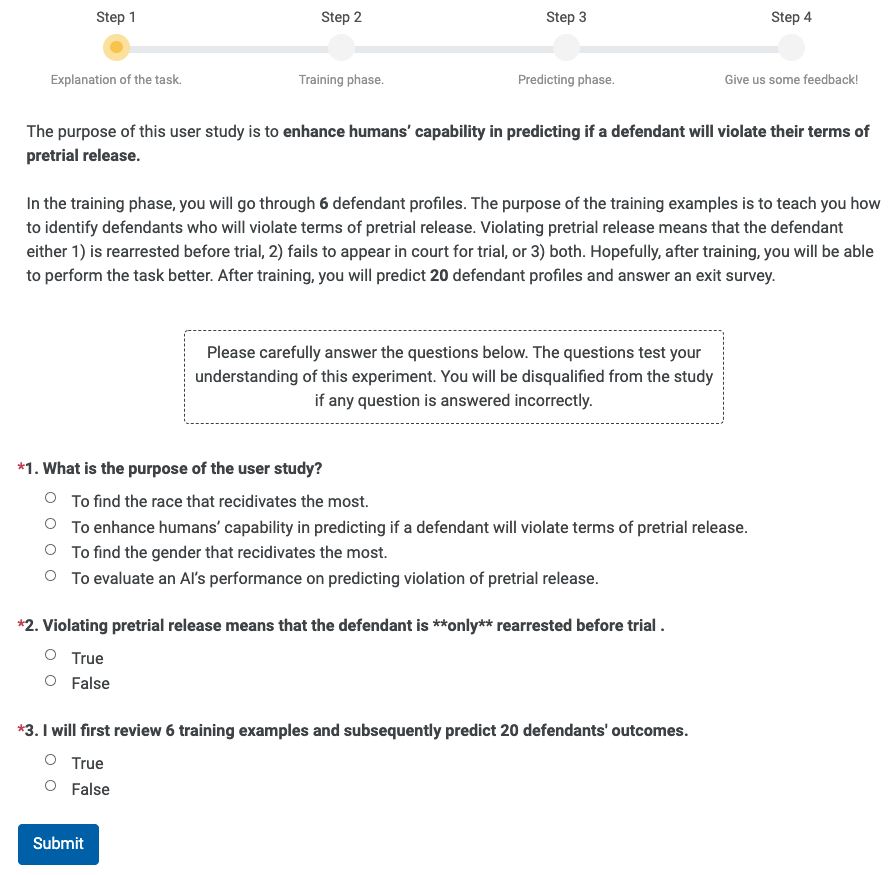
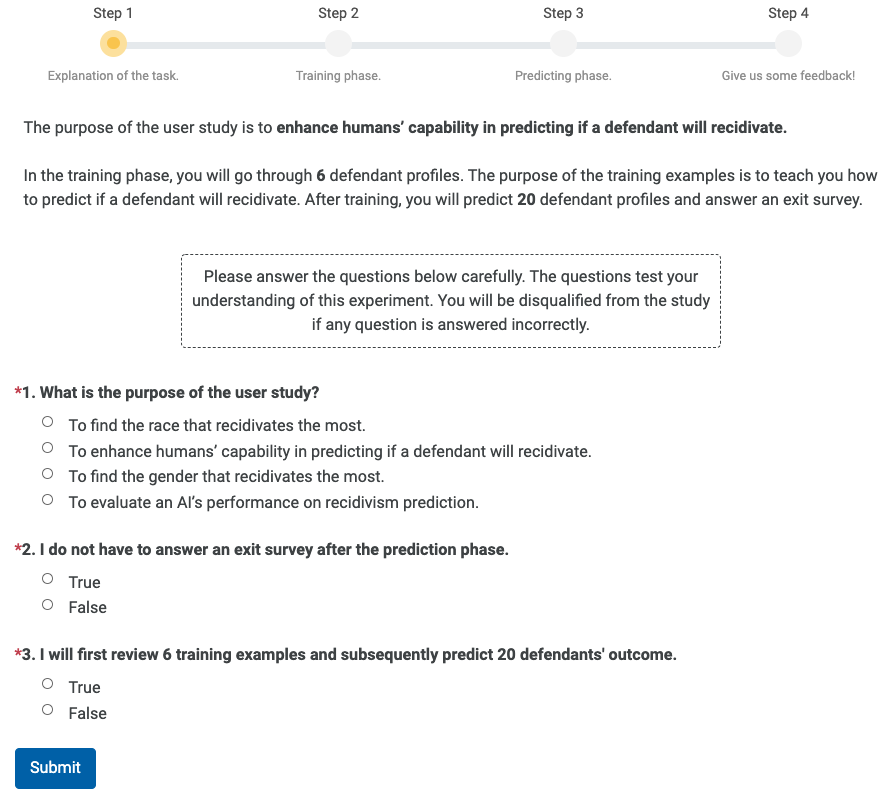
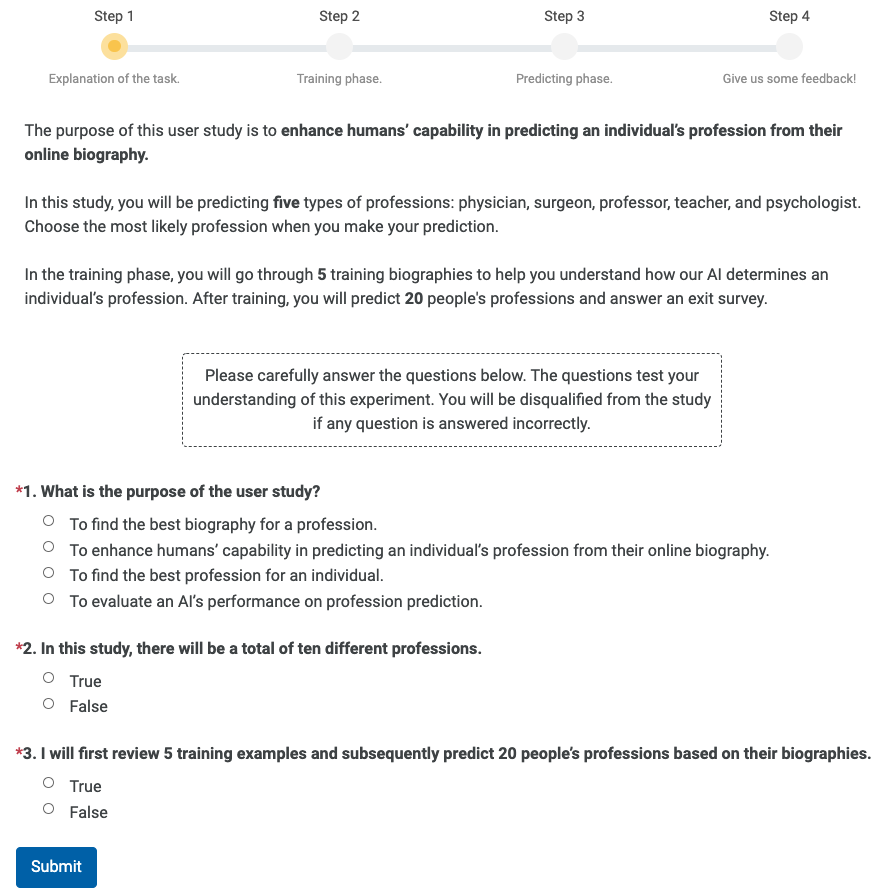
Feature quiz. In the training phase of each task, for all explanation types except None/None, we also design a feature quiz to see if users understand the association between features and labels correctly. For each training instance in the training phase, we prompt users the quiz as in Fig. 25 after they make the prediction. We ask users to identify the positive and negative feature from two candidate features. The correct candidate is prepared by a random sampling from all the features that are currently shown in the interface, while the incorrect candidate is sampled from all features that do not have the correct polarity as prompted. The submit button is disabled for five seconds starting from the appearance of the check to refrain users from submitting a random answer.

Details for experiments on Mechanical Turk. We report the median time taken by the users to complete each task. The median time taken for ICPSR, COMPAS, and BIOS are 9’55”, 9’16”, and 8’59” respectively. In Fig. 26, we show the median time taken for each explanation type. We are reporting the median time taken due to a few outliers in the data collected where user is inactive for a long period of time during the study.
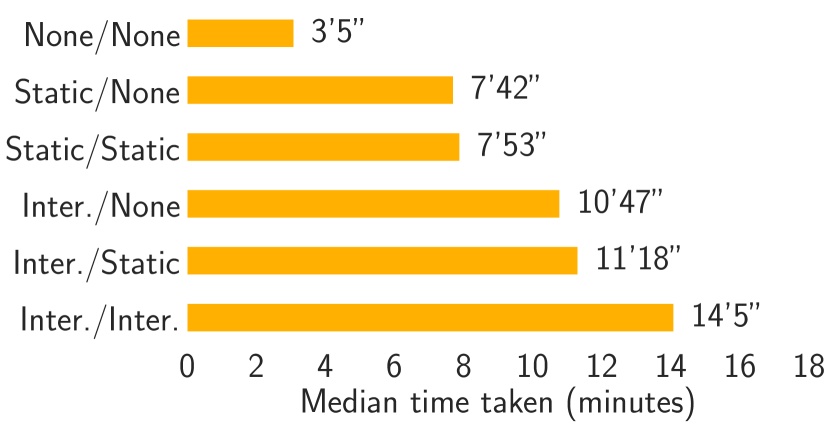
Median time taken for each explanation type are 3’5”, 7’42”, 7’53”, 10’47”, 11’18”, and 14’5”.
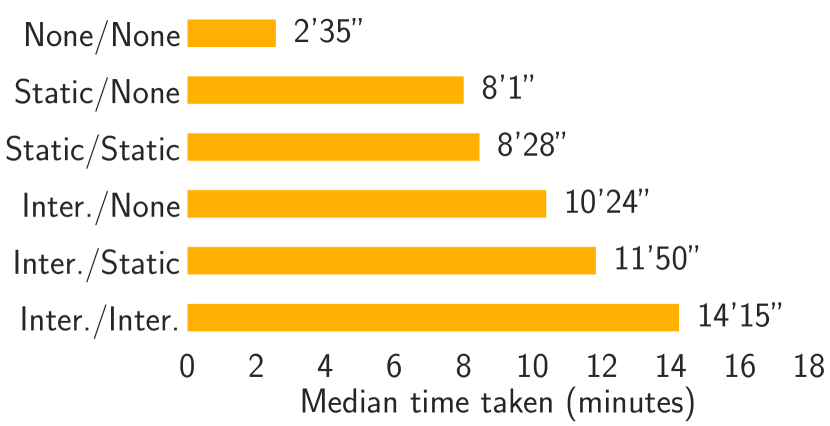
Median time taken for each explanation type are 2’35”, 8’1”, 8’28”, 10’24”, 11’50”, and 14’15”.
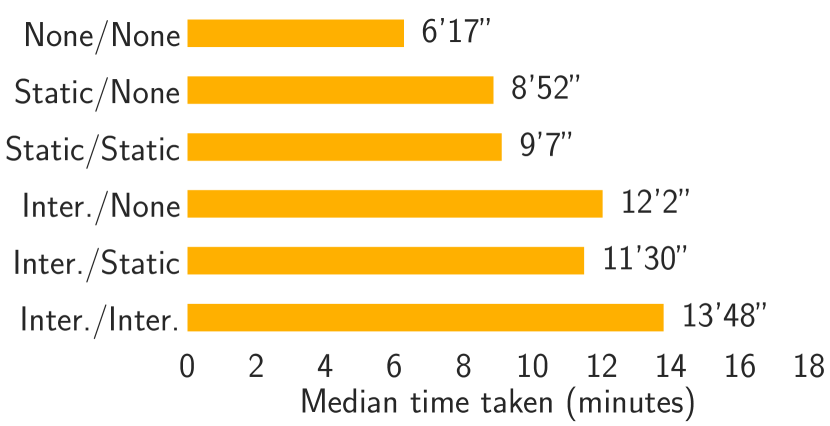
Median time taken for each explanation type are 6’17”, 8’52”, 9’7”, 12’2”, 11’30”, and 13’48”.
Appendix E Survey Questions
References
- (1)
- Angwin et al. (2016) Julia Angwin, Jeff Larson, Surya Mattu, and Lauren Kirchner. 2016. Machine Bias.
- Bansal et al. (2021) Gagan Bansal, Tongshuang Wu, Joyce Zhou, Raymond Fok, Besmira Nushi, Ece Kamar, Marco Tulio Ribeiro, and Daniel Weld. 2021. Does the whole exceed its parts? the effect of ai explanations on complementary team performance. In Proceedings of the 2021 CHI Conference on Human Factors in Computing Systems. 1–16.
- Beede et al. (2020) Emma Beede, Elizabeth Baylor, Fred Hersch, Anna Iurchenko, Lauren Wilcox, Paisan Ruamviboonsuk, and Laura M Vardoulakis. 2020. A Human-Centered Evaluation of a Deep Learning System Deployed in Clinics for the Detection of Diabetic Retinopathy. In Proceedings of the 2020 CHI Conference on Human Factors in Computing Systems. 1–12.
- Brown and Sandholm (2019) Noam Brown and Tuomas Sandholm. 2019. Superhuman AI for multiplayer poker. Science 365, 6456 (2019), 885–890.
- Buçinca et al. (2020) Zana Buçinca, Phoebe Lin, Krzysztof Z Gajos, and Elena L Glassman. 2020. Proxy tasks and subjective measures can be misleading in evaluating explainable AI systems. In Proceedings of the 25th International Conference on Intelligent User Interfaces. 454–464.
- Cai et al. (2019) Carrie J Cai, Emily Reif, Narayan Hegde, Jason Hipp, Been Kim, Daniel Smilkov, Martin Wattenberg, Fernanda Viegas, Greg S Corrado, Martin C Stumpe, et al. 2019. Human-centered tools for coping with imperfect algorithms during medical decision-making. In Proceedings of the 2019 CHI Conference on Human Factors in Computing Systems. ACM, 4.
- Carton et al. (2020) Samuel Carton, Qiaozhu Mei, and Paul Resnick. 2020. Feature-Based Explanations Don’t Help People Detect Misclassifications of Online Toxicity. In Proceedings of the International AAAI Conference on Web and Social Media, Vol. 14. 95–106.
- Cheng et al. (2019) Hao-Fei Cheng, Ruotong Wang, Zheng Zhang, Fiona O’Connell, Terrance Gray, F Maxwell Harper, and Haiyi Zhu. 2019. Explaining Decision-Making Algorithms through UI: Strategies to Help Non-Expert Stakeholders. In Proceedings of the 2019 CHI Conference on Human Factors in Computing Systems. ACM, 559.
- Chiang and Yin (2021) Chun-Wei Chiang and Ming Yin. 2021. You’d Better Stop! Understanding Human Reliance on Machine Learning Models under Covariate Shift. In 13th ACM Web Science Conference 2021. 120–129.
- Clark et al. (2019) Christopher Clark, Mark Yatskar, and Luke Zettlemoyer. 2019. Don’t Take the Easy Way Out: Ensemble Based Methods for Avoiding Known Dataset Biases. In Proceedings of the 2019 Conference on Empirical Methods in Natural Language Processing and the 9th International Joint Conference on Natural Language Processing (EMNLP-IJCNLP). 4069–4082.
- De-Arteaga et al. (2019) Maria De-Arteaga, Alexey Romanov, Hanna Wallach, Jennifer Chayes, Christian Borgs, Alexandra Chouldechova, Sahin Geyik, Krishnaram Kenthapadi, and Adam Tauman Kalai. 2019. Bias in bios: A case study of semantic representation bias in a high-stakes setting. In Proceedings of the Conference on Fairness, Accountability, and Transparency. 120–128.
- de Visser et al. (2014) Ewart J de Visser, Marvin Cohen, Amos Freedy, and Raja Parasuraman. 2014. A design methodology for trust cue calibration in cognitive agents. In International conference on virtual, augmented and mixed reality. Springer, 251–262.
- Doshi-Velez and Kim (2017) Finale Doshi-Velez and Been Kim. 2017. Towards a rigorous science of interpretable machine learning. arXiv preprint arXiv:1702.08608 (2017).
- Feng and Boyd-Graber (2019) Shi Feng and Jordan Boyd-Graber. 2019. What can ai do for me? evaluating machine learning interpretations in cooperative play. In Proceedings of the 24th International Conference on Intelligent User Interfaces. 229–239.
- Frid et al. (2020) Emma Frid, Ceslo Gomes, and Zeyu Jin. 2020. Music Creation by Example. In Proceedings of the 2020 CHI Conference on Human Factors in Computing Systems.
- Gaur et al. (2016) Yashesh Gaur, Walter S Lasecki, Florian Metze, and Jeffrey P Bigham. 2016. The effects of automatic speech recognition quality on human transcription latency. In Proceedings of the 13th Web for All Conference. 1–8.
- Ghai et al. (2020) Bhavya Ghai, Q Vera Liao, Yunfeng Zhang, Rachel Bellamy, and Klaus Mueller. 2020. Explainable Active Learning (XAL): An Empirical Study of How Local Explanations Impact Annotator Experience. arXiv preprint arXiv:2001.09219 (2020).
- Gilpin et al. (2018) Leilani H Gilpin, David Bau, Ben Z Yuan, Ayesha Bajwa, Michael Specter, and Lalana Kagal. 2018. Explaining explanations: An overview of interpretability of machine learning. In 2018 IEEE 5th International Conference on data science and advanced analytics (DSAA). IEEE, 80–89.
- Goodfellow et al. (2016) Ian Goodfellow, Y Bengio, and A Courville. 2016. Machine learning basics. In Deep learning. Vol. 1. MIT press, 98–164.
- Green and Chen (2019a) Ben Green and Yiling Chen. 2019a. Disparate interactions: An algorithm-in-the-loop analysis of fairness in risk assessments. In Proceedings of the Conference on Fairness, Accountability, and Transparency. ACM, 90–99.
- Green and Chen (2019b) Ben Green and Yiling Chen. 2019b. The principles and limits of algorithm-in-the-loop decision making. Proceedings of the ACM on Human-Computer Interaction 3, CSCW (2019), 50.
- Gurari et al. (2018) Danna Gurari, Qing Li, Abigale J Stangl, Anhong Guo, Chi Lin, Kristen Grauman, Jiebo Luo, and Jeffrey P Bigham. 2018. Vizwiz grand challenge: Answering visual questions from blind people. In Proceedings of the IEEE Conference on Computer Vision and Pattern Recognition. 3608–3617.
- He et al. (2015) Kaiming He, Xiangyu Zhang, Shaoqing Ren, and Jian Sun. 2015. Delving deep into rectifiers: Surpassing human-level performance on imagenet classification. In Proceedings of ICCV.
- Hohman et al. (2019) Fred Hohman, Andrew Head, Rich Caruana, Robert DeLine, and Steven M Drucker. 2019. Gamut: A design probe to understand how data scientists understand machine learning models. In Proceedings of the 2019 CHI Conference on Human Factors in Computing Systems. 1–13.
- Jia and Liang (2017) Robin Jia and Percy Liang. 2017. Adversarial Examples for Evaluating Reading Comprehension Systems. In Proceedings of the 2017 Conference on Empirical Methods in Natural Language Processing. 2021–2031.
- Kaur et al. (2020) Harmanpreet Kaur, Harsha Nori, Samuel Jenkins, Rich Caruana, Hanna Wallach, and Jennifer Wortman Vaughan. 2020. Interpreting Interpretability: Understanding Data Scientists’ Use of Interpretability Tools for Machine Learning. In Proceedings of the 2020 CHI Conference on Human Factors in Computing Systems. 1–14.
- Kleinberg et al. (2018) Jon Kleinberg, Himabindu Lakkaraju, Jure Leskovec, Jens Ludwig, and Sendhil Mullainathan. 2018. Human decisions and machine predictions. The quarterly journal of economics 133, 1 (2018), 237–293.
- Kleinberg et al. (2015) Jon Kleinberg, Jens Ludwig, Sendhil Mullainathan, and Ziad Obermeyer. 2015. Prediction policy problems. American Economic Review 105, 5 (2015), 491–95.
- Koh and Liang (2017) Pang Wei Koh and Percy Liang. 2017. Understanding black-box predictions via influence functions. In Proceedings of the 34th International Conference on Machine Learning-Volume 70. JMLR. org, 1885–1894.
- Koh et al. (2021) Pang Wei Koh, Shiori Sagawa, Sang Michael Xie, Marvin Zhang, Akshay Balsubramani, Weihua Hu, Michihiro Yasunaga, Richard Lanas Phillips, Irena Gao, Tony Lee, et al. 2021. Wilds: A benchmark of in-the-wild distribution shifts. In International Conference on Machine Learning. PMLR, 5637–5664.
- Krause et al. (2016) Josua Krause, Adam Perer, and Kenney Ng. 2016. Interacting with predictions: Visual inspection of black-box machine learning models. In Proceedings of the 2016 CHI Conference on Human Factors in Computing Systems. ACM, 5686–5697.
- Lai et al. (2020) Vivian Lai, Han Liu, and Chenhao Tan. 2020. “Why is ‘Chicago’ deceptive?” Towards Building Model-Driven Tutorials for Humans. In Proceedings of the 2020 CHI Conference on Human Factors in Computing Systems. 1–13.
- Lai and Tan (2019) Vivian Lai and Chenhao Tan. 2019. On human predictions with explanations and predictions of machine learning models: A case study on deception detection. In Proceedings of the conference on fairness, accountability, and transparency. 29–38.
- Lakkaraju et al. (2016) Himabindu Lakkaraju, Stephen H Bach, and Jure Leskovec. 2016. Interpretable decision sets: A joint framework for description and prediction. In Proceedings of the 22nd ACM SIGKDD international conference on knowledge discovery and data mining. 1675–1684.
- Lasecki et al. (2017) Walter S Lasecki, Christopher D Miller, Iftekhar Naim, Raja Kushalnagar, Adam Sadilek, Daniel Gildea, and Jeffrey P Bigham. 2017. Scribe: deep integration of human and machine intelligence to caption speech in real time. Commun. ACM 60, 9 (2017), 93–100.
- Liang and Zheng (2020) Gaobo Liang and Lixin Zheng. 2020. A transfer learning method with deep residual network for pediatric pneumonia diagnosis. Computer methods and programs in biomedicine 187 (2020), 104964.
- Lin et al. (2020) Zhiyuan “Jerry” Lin, Jongbin Jung, Sharad Goel, Jennifer Skeem, et al. 2020. The limits of human predictions of recidivism. Science advances 6, 7 (2020), eaaz0652.
- Liptak (2017) Adam Liptak. 2017. Sent to Prison by a Software Program’s Secret Algorithms.
- Lipton (2016) Zachary C Lipton. 2016. The mythos of model interpretability. arXiv preprint arXiv:1606.03490 (2016).
- Lombrozo (2006) Tania Lombrozo. 2006. The structure and function of explanations. Trends in cognitive sciences 10, 10 (2006), 464–470.
- Louie et al. (2020) Ryan Louie, Andy Coenen, Cheng Zhi Huang, Michael Terry, and Carrie J Cai. 2020. Novice-AI Music Co-Creation via AI-Steering Tools for Deep Generative Models. In Proceedings of the 2020 CHI Conference on Human Factors in Computing Systems. 1–13.
- Lundberg and Lee (2017) Scott M Lundberg and Su-In Lee. 2017. A unified approach to interpreting model predictions. In Proceedings of the 31st international conference on neural information processing systems. 4768–4777.
- Lundberg et al. (2018) Scott M Lundberg, Bala Nair, Monica S Vavilala, Mayumi Horibe, Michael J Eisses, Trevor Adams, David E Liston, Daniel King-Wai Low, Shu-Fang Newman, Jerry Kim, et al. 2018. Explainable machine-learning predictions for the prevention of hypoxaemia during surgery. Nature biomedical engineering 2, 10 (2018), 749–760.
- McBride and Morgan (2010) Maranda McBride and Shona Morgan. 2010. Trust calibration for automated decision aids. Institute for Homeland Security Solutions (2010), 1–11.
- McCormack et al. (2019) Jon McCormack, Toby Gifford, Patrick Hutchings, Maria Teresa Llano Rodriguez, Matthew Yee-King, and Mark d’Inverno. 2019. In a silent way: Communication between ai and improvising musicians beyond sound. In Proceedings of the 2019 CHI Conference on Human Factors in Computing Systems. 1–11.
- McCoy et al. (2019) Tom McCoy, Ellie Pavlick, and Tal Linzen. 2019. Right for the Wrong Reasons: Diagnosing Syntactic Heuristics in Natural Language Inference. In Proceedings of the 57th Annual Meeting of the Association for Computational Linguistics. Association for Computational Linguistics, Florence, Italy, 3428–3448. https://doi.org/10.18653/v1/P19-1334
- McGuirl and Sarter (2006) John M McGuirl and Nadine B Sarter. 2006. Supporting trust calibration and the effective use of decision aids by presenting dynamic system confidence information. Human factors 48, 4 (2006), 656–665.
- McKinney et al. (2020) Scott Mayer McKinney, Marcin Sieniek, Varun Godbole, Jonathan Godwin, Natasha Antropova, Hutan Ashrafian, Trevor Back, Mary Chesus, Greg C Corrado, Ara Darzi, et al. 2020. International evaluation of an AI system for breast cancer screening. Nature 577, 7788 (2020), 89–94.
- Merritt et al. (2015) Stephanie M Merritt, Deborah Lee, Jennifer L Unnerstall, and Kelli Huber. 2015. Are well-calibrated users effective users? Associations between calibration of trust and performance on an automation-aided task. Human Factors 57, 1 (2015), 34–47.
- Miller (2018) Tim Miller. 2018. Explanation in artificial intelligence: Insights from the social sciences. Artificial Intelligence (2018).
- Muir (1987) Bonnie M Muir. 1987. Trust between humans and machines, and the design of decision aids. International journal of man-machine studies 27, 5-6 (1987), 527–539.
- Nielsen et al. (2002) Janni Nielsen, Torkil Clemmensen, and Carsten Yssing. 2002. Getting access to what goes on in people’s heads?: reflections on the think-aloud technique. In Proceedings of the second Nordic conference on Human-computer interaction. ACM, 101–110.
- Parasuraman and Riley (1997) Raja Parasuraman and Victor Riley. 1997. Humans and automation: Use, misuse, disuse, abuse. Human factors 39, 2 (1997), 230–253.
- Poursabzi-Sangdeh et al. (2021) Forough Poursabzi-Sangdeh, Daniel G Goldstein, Jake M Hofman, Jennifer Wortman Wortman Vaughan, and Hanna Wallach. 2021. Manipulating and measuring model interpretability. In Proceedings of the 2021 CHI Conference on Human Factors in Computing Systems. 1–52.
- Quionero-Candela et al. (2009) Joaquin Quionero-Candela, Masashi Sugiyama, Anton Schwaighofer, and Neil D Lawrence. 2009. Dataset shift in machine learning. The MIT Press.
- Ribeiro et al. (2016) Marco Tulio Ribeiro, Sameer Singh, and Carlos Guestrin. 2016. Why should i trust you?: Explaining the predictions of any classifier. In Proceedings of KDD.
- Silver et al. (2018) David Silver, Thomas Hubert, Julian Schrittwieser, Ioannis Antonoglou, Matthew Lai, Arthur Guez, Marc Lanctot, Laurent Sifre, Dharshan Kumaran, Thore Graepel, et al. 2018. A general reinforcement learning algorithm that masters chess, shogi, and Go through self-play. Science 362, 6419 (2018), 1140–1144.
- Sugiyama and Kawanabe (2012) Masashi Sugiyama and Motoaki Kawanabe. 2012. Machine learning in non-stationary environments: Introduction to covariate shift adaptation. MIT press.
- Supreme Court of the United States (1993) Supreme Court of the United States. 1993. Daubert v. Merrell Dow Pharmaceuticals, Inc. 509 U.S. 579.
- Supreme Court of Wisconsin (2016) Supreme Court of Wisconsin. 2016. State of Wisconsin, Plaintiff-Respondent, v. Eric L. Loomis, Defendant-Appellant. https://www.wicourts.gov/sc/opinion/DisplayDocument.pdf?content=pdf&seqNo=171690
- Tenney et al. (2020) Ian Tenney, James Wexler, Jasmijn Bastings, Tolga Bolukbasi, Andy Coenen, Sebastian Gehrmann, Ellen Jiang, Mahima Pushkarna, Carey Radebaugh, Emily Reif, et al. 2020. The Language Interpretability Tool: Extensible, Interactive Visualizations and Analysis for NLP Models. In Proceedings of the 2020 Conference on Empirical Methods in Natural Language Processing: System Demonstrations. 107–118.
- Torrey and Shavlik (2010) Lisa Torrey and Jude Shavlik. 2010. Transfer learning. In Handbook of research on machine learning applications and trends: algorithms, methods, and techniques. IGI global, 242–264.
- United States Department of Justice. Office of Justice Programs. Bureau of Justice Statistics. (2014) United States Department of Justice. Office of Justice Programs. Bureau of Justice Statistics. 2014. State Court Processing Statistics, 1990-2009: Felony Defendants in Large Urban Counties.
- Wachter et al. (2017) Sandra Wachter, Brent Mittelstadt, and Chris Russell. 2017. Counterfactual explanations without opening the black box: Automated decisions and the GDPR.
- Wang and Yin (2021) Xinru Wang and Ming Yin. 2021. Are Explanations Helpful? A Comparative Study of the Effects of Explanations in AI-Assisted Decision-Making. In 26th International Conference on Intelligent User Interfaces. 318–328.
- Weerts et al. (2019) Hilde JP Weerts, Werner van Ipenburg, and Mykola Pechenizkiy. 2019. A Human-Grounded Evaluation of SHAP for Alert Processing. arXiv preprint arXiv:1907.03324 (2019).
- Wexler et al. (2019) James Wexler, Mahima Pushkarna, Tolga Bolukbasi, Martin Wattenberg, Fernanda Viégas, and Jimbo Wilson. 2019. The what-if tool: Interactive probing of machine learning models. IEEE transactions on visualization and computer graphics 26, 1 (2019), 56–65.
- Wu et al. (2017) Shaomei Wu, Jeffrey Wieland, Omid Farivar, and Julie Schiller. 2017. Automatic alt-text: Computer-generated image descriptions for blind users on a social network service. In Proceedings of the 2017 ACM Conference on Computer Supported Cooperative Work and Social Computing. 1180–1192.
- Wu et al. (2019) Tongshuang Wu, Daniel S Weld, and Jeffrey Heer. 2019. Local Decision Pitfalls in Interactive Machine Learning: An Investigation into Feature Selection in Sentiment Analysis. ACM Transactions on Computer-Human Interaction (TOCHI) 26, 4 (2019), 1–27.
- Xie et al. (2020) Yao Xie, Melody Chen, David Kao, Ge Gao, and Xiang ‘Anthony’ Chen. 2020. CheXplain: Enabling Physicians to Explore and Understand Data-Driven, AI-Enabled Medical Imaging Analysis. In Proceedings of the 2020 CHI Conference on Human Factors in Computing Systems. 1–13.
- Yang et al. (2019) Qian Yang, Aaron Steinfeld, and John Zimmerman. 2019. Unremarkable ai: Fitting intelligent decision support into critical, clinical decision-making processes. In Proceedings of the 2019 CHI Conference on Human Factors in Computing Systems. 1–11.
- Yin et al. (2019) Ming Yin, Jennifer Wortman Vaughan, and Hanna Wallach. 2019. Understanding the Effect of Accuracy on Trust in Machine Learning Models. In Proceedings of the 2019 CHI Conference on Human Factors in Computing Systems. ACM, 279.
- Zhang et al. (2020) Yunfeng Zhang, Q Vera Liao, and Rachel KE Bellamy. 2020. Effect of confidence and explanation on accuracy and trust calibration in AI-assisted decision making. In Proceedings of the 2020 Conference on Fairness, Accountability, and Transparency. 295–305.
- Zhuang et al. (2020) Fuzhen Zhuang, Zhiyuan Qi, Keyu Duan, Dongbo Xi, Yongchun Zhu, Hengshu Zhu, Hui Xiong, and Qing He. 2020. A comprehensive survey on transfer learning. Proc. IEEE (2020).