ALMA detection of millimetre 183 GHz H2O maser emission in the Superantennae galaxy at z 0.06
Abstract
We present the results of ALMA band-5 (170 GHz) observations of the merging ultraluminous infrared galaxy, the “Superantennae” (IRAS 192547245) at 0.0617, which has been diagnosed as containing a luminous obscured active galactic nucleus (AGN). In addition to dense molecular line emission (HCN, HCO+, and HNC = 2–1), we detect a highly luminous (610) 183 GHz H2O 31,3–22,0 emission line. We interpret the strong H2O emission as largely originating in maser amplification in AGN-illuminated dense and warm molecular gas, based on (1) the spatially compact (220 pc) nature of the H2O emission, unlike spatially resolved (500 pc) dense molecular emission, and (2) a strikingly different velocity profile from, and (3) significantly elevated flux ratio relative to, dense molecular emission lines. H2O maser emission, other than the widely studied 22 GHz 61,6–52,3 line, has been expected to provide important information on the physical properties of gas in the vicinity of a central mass-accreting supermassive black hole (SMBH), because of different excitation energy. We here demonstrate that with highly sensitive ALMA, millimetre 183 GHz H2O maser detection is feasible out to 270 Mpc, opening a new window to scrutinize molecular gas properties around a mass-accreting SMBH far beyond the immediately local universe.
keywords:
galaxies: individual: IRAS 192547245 (Superantennae) – (galaxies:) quasars: supermassive black holes – radio lines: galaxies – masers – galaxies: nuclei – galaxies: active1 Introduction
Water (H2O) is an abundant molecule in the universe and has been detected in many active galaxies (Yang et al., 2013). The rotational energy levels of H2O are more complex than those of simple molecules (e.g., CO, HCN) and many rotational transition lines are found in the far-infrared (70–300 m), (sub)millimetre (0.3–10 mm), and centimetre (1 cm) wavelength ranges. In dense and warm molecular gas, population inversion can occur for a number of H2O rotational transitions through collisional excitation and/or infrared radiative pumping (e.g., Yates et al., 1997; Gonzalez-Alfonso et al., 2010). This population inversion can amplify background radiation and these H2O emission lines can be extremely bright through maser phenomena. The luminous megamaser (10) emission line of ortho-H2O 61,6–52,3 at rest frequency 22 GHz (1.35 cm) has been detected in galaxy nuclei, mostly obscured active galactic nuclei (AGNs) (e.g., Braatz et al., 1996; Greenhill et al., 2003b; Braatz et al., 2004; Henkel et al., 2005; Kondratko et al., 2006a, b), out to z 0.66 for an unlensed AGN (Barvainis & Antonucci, 2005) and z 2.6 for a lensed AGN (Impellizzeri et al., 2008). Dense and warm molecular gas in the vicinity of a luminous AGN is a plausible site for this H2O megamaser emission (Neufeld et al., 1994; Maloney et al., 2002), which often shows brighter blueshifted and redshifted components than the systemic velocity component caused by a highly edge-on rotating disc. Because high-spatial-resolution very-long-baseline interferometry (VLBI) observations are possible at centimetre wavelengths, detailed spatially resolved dynamical studies of the bright 22 GHz H2O megamaser emission can be an excellent probe of the surrounding mass distribution. Such VLBI observations provided the first convincing evidence of the presence of a supermassive black hole (SMBH) and its precise mass measurement in the nearby AGN NGC 4258 at 7 Mpc (Miyoshi et al., 1995). Subsequent centimetre VLBI observations also revealed the dynamical properties of H2O megamaser-emitting gas in close proximity to central mass-accreting SMBHs and constrained SMBH masses in other nearby well-studied AGNs, including NGC 4945 at 4 Mpc (Greenhill et al., 1997b), Circinus at 4 Mpc (Greenhill et al., 2003a), and others (e.g., Kuo et al., 2011).
Theoretically, other H2O rotational transition lines in the (sub)millimetre wavelength range can also be extremely bright as a result of the maser phenomena caused by population inversion in dense and warm molecular gas. Examples include the 31,3–22,0 transition line of para-H2O at 183 GHz, 102,9–93,6 line of ortho-H2O at 321 GHz, and 51,5–42,2 line of para-H2O at 325 GHz (e.g., Deguchi, 1977; Neufeld et al., 1991; Yates et al., 1997). Observing multiple H2O megamaser emission lines will enable us to constrain the physical properties of the innermost AGN-illuminated gas around a mass-accreting SMBH (Maloney et al., 2002; Hagiwara et al., 2013), because excitation energy levels differ distinctly between different lines.
With the advent of highly sensitive (sub)millimetre observing facilities, including the Atacama Large Millimeter/submillimeter Array (ALMA), detection of (sub)millimetre H2O emission (183 GHz H2O 31,3–22,0 and/or 321 GHz H2O 102,9–93,6 lines) has been reported in the very nearby obscured AGNs Circinus (4 Mpc), NGC 4945 (4 Mpc), and NGC 3079 (16 Mpc) (Humphreys et al., 2005; Hagiwara et al., 2013, 2016; Pesce et al., 2016; Humphreys et al., 2016). These detected (sub)millimetre H2O emission lines can be explained by maser phenomena based mainly on high luminosity and velocity profiles similar to the 22 GHz H2O megamaser emission previously detected by VLBI observations. The 183 GHz H2O emission line was also detected in the infrared luminous merging galaxy Arp 220 at z 0.018 (80 Mpc) (Cernicharo et al., 2006). While Cernicharo et al. (2006) interpreted the emission as masers originating from nuclear star-forming regions, Hagiwara et al. (2016) and Galametz et al. (2016) argued that it is more likely to be thermal emission. Konig et al. (2017) later detected the 183 GHz and 325 GHz H2O emission lines in Arp 220 and preferred the hypothesis of masers from star-forming regions (not from an AGN). Despite the potential importance of (sub)millimetre H2O megamaser emission from AGN-illuminated molecular gas, it remains largely unexplored beyond the immediately local universe at 20 Mpc.
In this paper, we report the detection of notably luminous 183 GHz H2O emission that is interpreted as being of maser origin, in the obscured-AGN-hosting infrared luminous merging galaxy, the “Superantennae” at 0.0617. Adopting H0 71 km s-1 Mpc-1, = 0.27, and = 0.73, its luminosity distance is 273 Mpc and 1 arcsec corresponds to 1.2 kpc.
2 Target
The “Superantennae” (IRAS 192547245) is a merging galaxy in the southern hemisphere (declination 72∘), consisting of two galaxy nuclei with a separation of 8” (10 kpc) along the north–south direction and prominent long (300 kpc) tidal tails (Melnick & Mirabel, 1990; Mirabel et al., 1991; Duc et al., 1997). It has infrared luminosity 1 10 (Melnick & Mirabel, 1990), belonging to the class of ultraluminous infrared galaxies (ULIRGs) (Sanders & Mirabel, 1996). The Superantennae is a scaled-up version of the classical merging galaxy “Antennae” (NGC 4038/9), with 3 times longer tidal tails and 10 times higher infrared luminosity (Sanders & Mirabel, 1996). The southern nucleus is classified as an obscured AGN through optical spectroscopy (Mirabel et al., 1991; Colina et al., 1991; Duc et al., 1997; Kewley et al., 2001), and signatures of a luminous obscured AGN behind a large column density of material were also found based on 2 m infrared spectroscopy (Genzel et al., 1998; Vanzi et al., 2002; Risaliti et al., 2003; Reunanen et al., 2007; Imanishi et al., 2008; Nardini et al., 2009, 2010) and 2 keV X-ray spectroscopy (Imanishi & Ueno, 1999; Pappa et al., 2000; Braito et al., 2003, 2009; Jia et al., 2012).
3 Observations and Data Analysis
The 183 GHz H2O line data of the Superantennae were obtained in our ALMA Cycle 5 program 2017.1.00022.S (PI = M. Imanishi) as part of band-5 (163–211 GHz) observations of 0.15 ULIRGs with dense molecular tracers HCN = 2–1 ( = 177.261 GHz), HCO+ = 2–1 ( = 178.375 GHz), and HNC =2–1 ( = 181.325 GHz) (M. Imanishi et al. 2021 in preparation). The H2O 31,3–22,0 line ( = 183.310 GHz) data were simultaneously obtained with the HNC = 2–1 line data on 2018 September 18 (UT) with 43 antennas with 15–1398 m baselines. The bandpass, flux, and phase calibrator were J16175848, J16175848, and J18377108, respectively. The net on-source integration time was 27 min. HCN = 2–1 and HCO+ = 2–1 line data were taken separately on 2018 September 18 (UT) with the same antenna numbers, baselines, and calibrators. The net on-source integration time was 6 min.
We used CASA (https://casa.nrao.edu) for the reduction of data calibrated and provided by ALMA. We selected channels that displayed no obvious emission lines to determine the continuum level, and then subtracted it using the CASA task “uvcontsub”. The “clean” task was applied with Briggs weighting (robust 0.5 and gain 0.1) for both the continuum-only and continuum-subtracted molecular line data, with a pixel scale of 005 pixel-1. The synthesized beam size was 055 035 (650 pc 400 pc).
4 Results
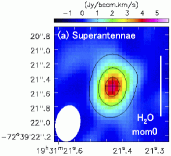
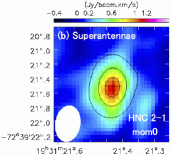
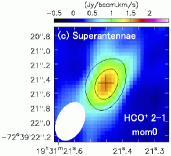
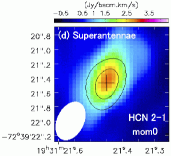
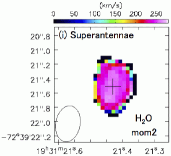
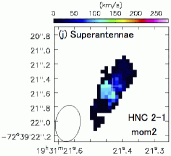
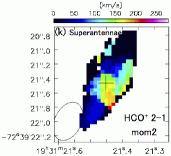
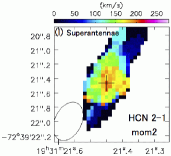
Continuum emission is clearly detected at International Celestial Reference System (ICRS) coordinates of (19h 31m 21.43s, 72∘ 39′ 21.5′′) (i.e., southern nucleus) and is displayed as contours in Figure 1 (Top). In Figure 1 (Top), integrated intensity (moment 0) maps of the 183 GHz H2O, HNC = 2–1, HCO+ = 2–1, and HCN = 2–1 lines are shown as images. These molecular emission line peak positions spatially agree with the continuum peak. Table 1 (columns 1–4) summarizes these molecular emission line properties.
| Line | Integrated intensity (moment 0) map | Gaussian fit | |||||
|---|---|---|---|---|---|---|---|
| Peak | rms | Beam | Velocity | Peak | FWHM | Flux | |
| [Jy beam-1 km s-1] | [′′ ′′] (∘) | [km s-1] | [mJy] | [km s-1] | [Jy km s-1] | ||
| (1) | (2) | (3) | (4) | (5) | (6) | (7) | (8) |
| 183 GHz H2O | 4.3 (15) | 0.30 | 0.500.34 (10∘) | 1820514, 1873820 A | 5.20.3, 4.90.2 A | 35730, 56246 A | 4.60.3 |
| HNC J=2–1 | 1.1 (5.0) | 0.23 | 0.510.35 (9∘) | 1854731 | 1.80.2 | 64998 | 1.20.2 |
| HCO+ J=2–1 | 1.6 (6.3) | 0.29 | 0.560.37 (26∘) | 1852224 | 2.60.2 | 76761 | 2.00.2 |
| HCN J=2–1 | 2.9 (6.3) | 0.47 | 0.570.37 (26∘) | 1856417 | 3.80.2 | 81048 | 3.10.2 |
A: Two Gaussian fit.
Notes: Col. (1): Line. Col. (2): Integrated intensity (in Jy beam-1 km s-1) at the emission peak. Detection significance relative to the rms noise (1) in the moment 0 map is shown in parentheses. Col. (3): Rms noise (1) level in the moment 0 map (in Jy beam-1 km s-1), derived from the standard deviation of sky signals in each moment 0 map. Col. (4): Beam size (in arcsec arcsec) and position angle (in degrees). The position angle is 0∘ along the north–south direction, and increases counterclockwise. Cols. (5)–(8): Gaussian fit of emission line in the spectrum at the continuum peak position, within the beam size. Col.(5): Optical local standard of rest (LSR) velocity (vopt) of the emission line peak (in km s-1). Col. (6): Peak flux (in mJy). Col. (7): Observed full width at half maximum (FWHM) (in km s-1). Col. (8): Gaussian-fit, velocity-integrated flux (in Jy km s-1). This flux will be used for our discussion of flux ratios.
Figures 2a–2b show beam-sized spectra at the continuum peak, where the 183 GHz H2O 31,3–22,0 line and HNC = 2–1, HCO+ = 2–1, and HCN = 2–1 emission lines are clearly detected. The 183 GHz H2O emission line is characterized by a double-peaked profile, whereas the remaining three dense molecular tracers (HNC, HCO+, and HCN = 2–1) display single-peaked emission line profiles. We apply a double and single Gaussian fit for the 183 GHz H2O and dense molecular lines, respectively. Table 1 (columns 5–8) summarizes the fitting results.


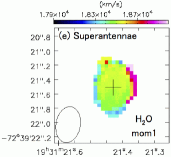
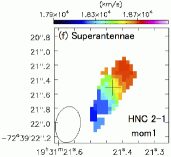
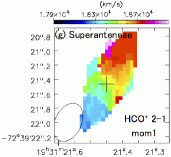
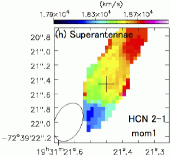
Intensity-weighted mean velocity (moment 1) and intensity-weighted velocity dispersion (moment 2) maps of 183 GHz H2O, HNC = 2–1, HCO+ = 2–1, and HCN = 2–1 lines are displayed in Figures 1e–1l. A similar rotation pattern is seen for the HNC = 2–1, HCO+ = 2–1, and HCN = 2–1 lines, with the south-eastern side being blueshifted and the north-western side being redshifted (Figures 1f–1h), as previously seen for other dense molecular tracers, HCN = 3–2 and HCO+ = 3–2 (Imanishi et al., 2016), and near-infrared (2 m) emission lines (Reunanen et al., 2007). However, the 183 GHz H2O emission line shows no such rotation signature (Figure 1e), and yet shows much larger velocity dispersion values of 200 km s-1 than the three dense molecular tracers at the nuclear (1 kpc) region (Figures 1i–1l). It is suggested that H2O and dense molecular emission originate from dynamically and spatially different regions in the galaxy nucleus.
5 Discussion
In the Superantennae, the 183 GHz H2O-to-HNC = 2–1 flux ratio is 4 (Table 1), which is by far the largest among 0.15 ULIRGs, the ratios of which are 2 (M. Imanishi et al. 2021 in preparation). The Superantennae is an outlier in this flux ratio. HNC emission is sometimes observed to be weak in the vicinity of a luminous AGN if the column density of the surrounding molecular gas is insufficient for HNC shielding (e.g., Imanishi et al., 2018, 2020). In fact, in the Superantennae, the flux of HNC, relative to HCN, at = 3–2 and = 4–3 is smaller than those of other ULIRGs (Imanishi et al., 2018). To distinguish whether (1) the 183 GHz H2O emission line is strong or (2) the HNC = 2–1 emission line is weak, we investigate the 183 GHz H2O-to-HCO+ = 2–1 flux ratio of the Superantennae and find it to be 2 (Table 1), which is also significantly higher than the ratios of 1 in the majority of other ULIRGs (M. Imanishi et al. 2021 in preparation). The H2O-to-HCN = 2–1 flux ratio of the Superantennae (1.4; Table 1) is also significantly higher than those of other ULIRGs (1; M. Imanishi et al. 2021 in preparation). As HCN = 2–1 emission can be enhanced in AGNs (e.g., Kohno, 2005; Imanishi et al., 2007; Krips et al., 2008; Imanishi et al., 2009; Izumi et al., 2016; Imanishi et al., 2016, 2019), we thought that the excess H2O-to-HCN = 2–1 flux ratio in the Superantennae may be weaker than other flux ratios, and yet it is still higher than those of other ULIRGs. To summarize, in the Superantennae, the 183 GHz H2O emission is significantly elevated relative to dense molecular line emission HNC = 2–1, HCO+ = 2–1, and HCN = 2–1. Applying Equation (3) of Solomon & Vanden Bout (2005) to the observed emission line flux in Table 1 (column 8), the luminosity in units of (K km s-1 pc2) is estimated to be 0.83 108, 1.4 108, and 2.3 109 for HNC = 2–1, HCO+ = 2–1, and HCN = 2–1, respectively. The probed nuclear dense molecular mass in the beam-sized spectrum (055 035 or 650 pc 400 pc) is a few 108M⊙, where we (1) use HCO+ = 2–1 luminosity as the least biased dense molecular mass indicator (see the above-mentioned possible ambiguity for HNC and HCN around a luminous AGN), (2) assume that HCO+ emission is optically thick and thermalized at = 2–1 and = 1–0 (i.e., same luminosity between = 2–1 and = 1–0 in units of [K km s-1 pc2]), and (3) adopt a luminosity-to-mass conversion factor of 2–5 (M⊙ [K km s-1 pc2]-1) for HCO+ = 1–0 (Leroy et al., 2017). The strong 183 GHz H2O emission, even compared with the emission from such high-mass nuclear dense molecular gas, is remarkable.
We interpret that maser amplification of the 183 GHz H2O emission line is a plausible physical mechanism for its flux elevation. First, while similar rotation patterns are seen in the moment 1 maps of the HNC = 2–1, HCO+ = 2–1, and HCN = 2–1 lines (Figures 1f–1h), and so these emission are spatially resolved, the lack of such rotation patterns (Figure 1e) suggests that the 183 GHz H2O emission originates in very compact, spatially unresolved molecular gas. We apply the CASA task “imfit” to moment 0 maps (Figures 1a–d) and find that the deconvolved intrinsic emission size of H2O (180 mas or 220 pc) is much smaller than those of HCN, HCO+, and HNC = 2–1 (450–1050 mas or 550–1250 pc). This is also confirmed by visibility fitting, using the CASA task “uvmodelfit”. AGN-illuminated dense and warm molecular gas with coherent velocity at the very centre (1 kpc) of the nucleus is the most plausible site for maser amplification (Neufeld et al., 1994; Maloney et al., 2002) and can naturally explain the compact, spatially unresolved 183 GHz H2O emission.
Second, unlike dense molecular tracers with single-peaked emission line profiles, the 183 GHz H2O emission line is double-peaked. This double-peaked emission line profile, by definition, can produce large velocity dispersion values in the moment 2 map of the H2O line (Figure 1i). Figure 2c shows the detailed profile of the H2O emission line with finer velocity resolution (3.5 km s-1), where the blueshifted and redshifted emission components are brighter than the systemic velocity component, as often seen in the bright 22 GHz H2O megamaser emission in AGNs (e.g., Braatz et al., 1996; Greenhill et al., 2003b; Braatz et al., 2004; Henkel et al., 2005; Kondratko et al., 2006a, b). The observed double-peaked emission line profile of the Superantennae can naturally be reproduced if maser-origin blueshifted and redshifted H2O emission in the vicinity of the mass-accreting SMBH are superposed onto very broad (FWHM 650–800 km s-1; Table 1) thermal H2O emission from the galaxy nucleus (1 kpc). A compact rotating maser disc at both sides of the central mass-accreting SMBH can produce stronger blueshifted and redshifted emission than the systemic velocity component at the foreground side of the SMBH (Miyoshi et al., 1995). The 183 GHz H2O emission detected in other 0.15 ULIRGs shows a single-peaked line profile, similar to those of dense molecular tracers (M. Imanishi et al. 2021 in preparation). To summarize, the luminous, spatially compact, spectrally double-peaked 183 GHz H2O emission in the Superantennae can naturally be explained by maser amplification in AGN-illuminated gas at the very centre of the galaxy nucleus, and an enhanced H2O abundance in a large volume of nuclear (1 kpc) dense molecular gas is disfavoured as the origin of the elevated 183 GHz H2O emission. While a large fraction of AGNs with detected 22 GHz H2O megamaser emission show multiple narrow features, the maser-origin 183 GHz H2O emission of the Superantennae is broad, as seen in a few AGNs for the 22 GHz line (e.g., Koekemoer et al., 1995; Braatz et al., 1996). We interpret that H2O maser spots in the Superantennae distribute widely and continuously along the radial direction from the central mass-accreting SMBH.
The observed 183 GHz H2O emission line properties in the Superantennae are significantly different from those of another ULIRG with 183 GHz H2O emission line detection, Arp 220 ( 0.018 or 80 Mpc) (Cernicharo et al., 2006; Galametz et al., 2016; Konig et al., 2017). In Arp 220, the 183 GHz H2O emission line flux is smaller than those of the HNC, HCO+, and HCN = 2–1 lines (Galametz et al., 2016), similar to the majority of 0.15 ULIRGs (M. Imanishi et al. 2021 in preparation). The line profile of the 183 GHz H2O emission in Arp 220 is also single-peaked in a similar way to those of dense molecular lines (Cernicharo et al., 2006; Galametz et al., 2016; Konig et al., 2017). These observational results of the 183 GHz H2O emission in Arp 220 can naturally be explained by thermal emission. The Superantennae shows the strongest AGN-origin megamaser emission signatures for the 183 GHz H2O line beyond the immediately local universe at 20 Mpc.
Adopting Equation (1) of Solomon & Vanden Bout (2005), we obtain the 183 GHz H2O maser (isotropic) luminosity 6.1 10. Even though a fraction of this H2O luminosity comes from thermal emission in the nuclear region (1 kpc) of the galaxy, the fact that the H2O-to-HCO+ = 2–1 and H2O-to-HNC = 2–1 flux ratios in the Superantennae are 2 times higher than those in other 0.15 ULIRGs suggests that at least half the luminosity (a few 10) originates from maser emission from the AGN-illuminated gas (1 kpc). This is as high as or possibly even higher than the most luminous 22 GHz H2O megamaser emission in an AGN at 0.66 (2 10) (Barvainis & Antonucci, 2005). The Superantennae is a promising target for detecting multiple H2O megamaser emission lines to constrain the physical properties of AGN-illuminated dense and warm molecular gas around an actively mass-accreting SMBH. The upper and lower energy levels of H2O lines are (, ) = (643 K, 642 K) for the 61,6–52,3 transition at 22 GHz, and (205 K, 196 K) for the 31,3–22,0 transition at 183 GHz. Depending on molecular gas temperature, the 183 GHz to 22 GHz H2O maser flux ratio can vary widely (Cernicharo et al., 2006). For the Superantennae, no detection was reported for the well-studied 22 GHz H2O maser emission with shallow (rms 75 mJy) observations (Greenhill et al., 2002). More sensitive 22 GHz observations will provide important insights into the properties of AGN-illuminated gas at the very centre of galaxy nuclei in the distant universe at 270 Mpc.
6 Summary
We conducted ALMA band-5 observations of the Superantennae galaxy at 0.0617. We detected remarkably strong 183 GHz H2O 31,3–22,0 emission, relative to dense molecular lines (HNC, HCO+, and HCN = 2–1) when compared to other ULIRGs. The observed compact, spatially unresolved emission nature and double-peaked emission line profile of H2O are markedly different from the spatially resolved, single-peaked emission line properties of dense molecular tracers in the galaxy nucleus. We argue that the detected luminous 183 GHz H2O emission originates in maser amplification in AGN-illuminated molecular gas around a mass-accreting SMBH at the very centre of the galaxy nucleus. This pushes (sub)millimetre H2O maser emission detection up to 270 Mpc, far beyond the immediately local universe, owing to ALMA’s high sensitivity. Combination with so-far undetected 22 GHz H2O maser emission will constrain the physical properties of dense and warm molecular gas in the vicinity of a mass-accreting SMBH.
Acknowledgements
We thank the referee for valuable comments. This paper makes use of the following ALMA data: ADS/JAO.ALMA#2017.1.00022.S. Data analysis was in part carried out on the open use data analysis computer system at the Astronomy Data Center, ADC, of the National Astronomical Observatory of Japan.
Data Availability
The data used in this paper (2017.1.00022.S) are available in the ALMA archive at https://almascience.eso.org/.
References
- Barvainis & Antonucci (2005) Barvainis, R., & Antonucci, R., 2005, ApJ, 628, L89
- Braatz et al. (2004) Braatz, J. A., Henkel, C., Greenhill, L. J., Moran, J. M., & Wilson, A. S., 2004, ApJ, 617, L29
- Braatz et al. (1996) Braatz, J. A., Wilson, A. S., & Henkel, C., 1996, ApJS, 106, 51
- Braito et al. (2003) Braito, V., Franceschini, A., Della Ceca, R., et al. 2003, A&A, 398, 107
- Braito et al. (2009) Braito, V., Reeves, J. N., Della Ceca, R., et al. 2009, A&A, 504, 53
- Cernicharo et al. (2006) Cernicharo, J., Pardo, J. R., & Weiss, A., 2006, ApJ, 646, L49
- Colina et al. (1991) Colina, L., Lipari, S., & Macchetto, F., 1991, ApJ, 379, 113
- Deguchi (1977) Deguchi, S., 1977, PASJ, 29, 669
- Duc et al. (1997) Duc, P. -A., Mirabel, I. F., & Maza, J., 1997, A&AS, 124, 533
- Galametz et al. (2016) Galametz, M., Zhang, Z. -Y., Immer, K., et al. 2016, MNRAS, 462, L36
- Genzel et al. (1998) Genzel, R., Lutz, D., Sturm, E., et al. 1998, ApJ, 498, 579
- Gonzalez-Alfonso et al. (2010) Gonzalez-Alfonso, E., Fischer, J., Isaak, K., et al. 2010, A&A, 518, L43
- Greenhill et al. (2003a) Greenhill, L. J., Booth, R. S., Ellingsen, S. P., et al. 2003a, ApJ, 590, 162
- Greenhill et al. (2002) Greenhill, L. J., Ellingsen, S. P., Norris, R. P., et al. 2002, ApJ, 565, 836
- Greenhill et al. (2003b) Greenhill, L. J., Kondratko, P. T., Lovell, J. E. J., et al. 2003b, ApJ, 582, L11
- Greenhill et al. (1997b) Greenhill, L. J., Moran, J. M., & Herrnstein, J. R., 1997b, ApJ, 481, L23
- Hagiwara et al. (2016) Hagiwara, Y., Horiuchi, S., Doi, A., Miyoshi, M., & Edwards, P. G., 2016, ApJ, 827, 69,
- Hagiwara et al. (2013) Hagiwara, Y., Miyoshi, M., Doi, A., & Horiuchi, S., 2013, ApJ, 768, L38
- Henkel et al. (2005) Henkel, C., Peck, A. B., Tarchi, A., et al. 2005, A&A, 436, 75
- Humphreys et al. (2005) Humphreys, E. M. L. Greenhill, L. J., Reid, M. J., et al. 2005, ApJ, 634, L133
- Humphreys et al. (2016) Humphreys, E. M. L., Vlemmings, W. H. T., Impellizzeri, C. M. V., et al. 2016, A&A, 592, L13
- Imanishi et al. (2008) Imanishi, M., Nakagawa, T., Ohyama, Y., et al. 2008, PASJ, 60, S489
- Imanishi et al. (2016) Imanishi, M., Nakanishi, K., & Izumi, T. 2016, AJ, 152, 218
- Imanishi et al. (2018) Imanishi, M., Nakanishi, K., & Izumi, T. 2018, ApJ, 856, 143
- Imanishi et al. (2019) Imanishi, M., Nakanishi, K., & Izumi, T. 2019, ApJS, 241, 19
- Imanishi et al. (2007) Imanishi, M., Nakanishi, K., Tamura, Y., Oi, N., & Kohno, K. 2007, AJ, 134, 2366
- Imanishi et al. (2009) Imanishi, M., Nakanishi, K., Tamura, Y., & Peng, C. -H. 2009, AJ, 137, 3581
- Imanishi et al. (2020) Imanishi, M., Nguyen, D. D., Wada, K., et al. 2020, ApJ, 902, 99
- Imanishi & Ueno (1999) Imanishi, M., & Ueno, S., 1999, ApJ, 527, 709
- Impellizzeri et al. (2008) Impellizzeri, C. M. V., McKean, J. P., Castangia, P., et al. 2008, Nature, 456, 927
- Izumi et al. (2016) Izumi, T., Kohno, K., Aalto, S., et al. 2016, ApJ, 818, 42
- Jia et al. (2012) Jia, J., Ptak, A., Heckman, T. M., Braito, V., & Reeves, J., 2012, ApJ, 759, 41
- Kewley et al. (2001) Kewley, L. J., Heisler, C. A., Dopita, M. A., & Lumsden, S., 2001, ApJS, 132, 37
- Koekemoer et al. (1995) Koekemoer, A. M., Henkel, C., Greenhill, L. J., et al. 1995, Nature, 378, 697
- Kohno (2005) Kohno, K. 2005, in AIP Conf. Ser. 783, The Evolution of Starbursts, ed. S. Hüttemeister, E. Manthey, D. Bomans, & K. Weis (New York: AIP), 203
- Kondratko et al. (2006a) Kondratko, P. T., Greenhill, L. J., & Moran, J. M., 2006a, ApJ, 652, 136
- Kondratko et al. (2006b) Kondratko, P. T., Greenhill, L. J., Moran, J. M., et al. 2006b, ApJ, 638, 100
- Konig et al. (2017) Konig, S., Martin, S., Muller, S., et al. 2017, A&A, 602, 42
- Krips et al. (2008) Krips, M., Neri, R., Garcia-Burillo, S., Martin, S., Combes, F., Gracia-Carpio, J., & Eckart, A. 2008, ApJ, 677, 262
- Kuo et al. (2011) Kuo, C. Y., Braatz, J. A., Condon, J. J., et al. 2011, ApJ, 727, 20
- Leroy et al. (2017) Leroy, A. K., Usero, A., Schruba, A., et al. 2017, ApJ, 835, 217
- Maloney et al. (2002) Maloney, P. R., 2002, PASA, 19, 401
- Melnick & Mirabel (1990) Melnick, J., & Mirabel, I. F., 1990, A&A, 231, L19
- Mirabel et al. (1991) Mirabel, I. F., Lutz, D., & Maza, J. 1991, A&A, 243, 367
- Miyoshi et al. (1995) Miyoshi, M., Moran, J., & Herrnstein, J., et al. 1995, Nature, 373, 127
- Nardini et al. (2009) Nardini, E., Risaliti, G., Salvati, M., et al. 2009, MNRAS, 399, 1373
- Nardini et al. (2010) Nardini, E., Risaliti, G., Watabe, Y., Salvati, M., & Sani, E. 2010, MNRAS, 405, 2505
- Neufeld et al. (1994) Neufeld, D. A., Maloney, P. R., & Conger, S., 1994, ApJ, 436, L127
- Neufeld et al. (1991) Neufeld, D. A., & Melnick, G. J., 1991, ApJ, 368, 215
- Pappa et al. (2000) Pappa, A., Georgantopoulos, I., & Stewart, G. C., 2000, MNRAS, 314, 589
- Pesce et al. (2016) Pesce, D. W., Braatz, J. A., & Impellizzeri, C. M. V., 2016, ApJ, 827, 68
- Reunanen et al. (2007) Reunanen, J., Tacconi-Garman, L. E., & Ivanov, V. D., 2007, MNRAS, 382, 951
- Risaliti et al. (2003) Risaliti, G., Maiolino, R., Marconi, A., et al. 2003, ApJ, 595, L17
- Sanders & Mirabel (1996) Sanders, D. B., & Mirabel, I. F. 1996, ARA&A, 34, 749
- Solomon & Vanden Bout (2005) Solomon, P. M., & Vanden Bout, P. A. 2005, ARA&A, 43, 677
- Vanzi et al. (2002) Vanzi, L., Bagnulo, S., Le Floc’h, E., et al. 2002, A&A, 386, 464
- Yang et al. (2013) Yang, C., Gao, Y., Omont, A., 2013, ApJ, 771, L24
- Yates et al. (1997) Yates, J. A., Field, D., & Gray, M. D., 1997, MNRAS, 285, 303