The Center of Expansion and Age of the Oxygen-rich Supernova Remnant 1E 0102.2-7219
Abstract
We present new proper motion measurements of optically emitting oxygen-rich knots of supernova remnant 1E 0102.2-7219 (E0102), which are used to estimate the remnant’s center of expansion and age. Four epochs of high resolution Hubble Space Telescope images spanning 19 yr were retrieved and analyzed. We found a robust center of expansion of =1h04m02.48s and =-72∘01′53.92′′ (J2000) with 1- uncertainty of 1.77′′ using 45 knots from images obtained with the Advanced Camera for Surveys using the F475W filter in 2003 and 2013 having the highest signal-to-noise ratio. We also estimate an upper limit explosion age of 1738 175 yr by selecting knots with the highest proper motions, that are assumed to be the least decelerated. We find evidence of an asymmetry in the proper motions of the knots as a function of position angle. We conclude that these asymmetries were most likely caused by interaction between E0102’s original supernova blast wave and an inhomogeneous surrounding environment, as opposed to intrinsic explosion asymmetry. The observed non-homologous expansion suggests that the use of a free expansion model inaccurately offsets the center of expansion and leads to an overestimated explosion age. We discuss our findings as they compare to previous age and center of expansion estimates of E0102 and their relevance to a recently identified candidate central compact object.
1 Introduction
Supernova remnants (SNRs) encode valuable information about the explosion processes of supernovae and their progenitor systems (see Milisavljevic & Fesen 2017 for a review). Young ( yr), nearby ( Mpc) oxygen-rich (O-rich) SNRs, created from the collapsed cores of massive stars (; Smartt 2009), are particularly well-suited laboratories to study details of supernova explosion dynamics, as the kinematic and chemical properties of the metal rich debris can retain details of the parent supernova explosion (Blair et al., 2000; Flanagan et al., 2004). Ejecta can be followed over many years to determine the precise origin of the explosion, which in turn can be used to estimate the age of the remnant since explosion. Furthermore, interaction between the supernova’s blast wave and ejecta with surrounding circumstellar and interstellar material (CSM/ISM) can constrain mass loss and evolutionary transitions experienced by the progenitor star in the poorly understood final phases prior to core collapse (Smith, 2014; Chevalier & Fransson, 2017; Patnaude & Badenes, 2017).
Proper motion analysis is the most robust method for calculating the center of expansion (CoE) and explosion age of a SNR. Only a handful of known O-rich SNRs are sufficiently resolved to measure proper motion of high velocity ejecta from multi-epoch observations. This small list includes Cassiopeia A (Kamper & van den Bergh, 1976; Thorstensen et al., 2001; Fesen et al., 2006; Hammell & Fesen, 2008), Puppis A (Winkler & Kirshner, 1985), G292+1.8 (Murdin & Clark, 1979; Winkler et al., 2009), and 1E 0102.2-7219 (E0102) (Finkelstein et al., 2006), which is the focus of this paper.
E0102 was discovered by the Einstein Observatory during a survey of the Small Magellanic Cloud (SMC) (Seward & Mitchell, 1981), and is approximately 62 kpc away (Graczyk et al., 2014; Scowcroft et al., 2016). E0102 was classified as an O-rich SNR (Dopita et al., 1981) owing to its strong [O III] 4959, 5007 emission lines. Emission from other elements including Ar, Ne, C, Cl, Si, S, and Mg has also been identified (Blair et al., 2000; Rasmussen et al., 2001; Seitenzahl et al., 2018; Alan et al., 2019), with Ne and O being the most abundant (Blair et al., 2000). Localized hydrogen emission has been found in some knots (Seitenzahl et al., 2018), which is potentially consistent with a progenitor star partially stripped of its hydrogen envelope and a Type IIb supernova classification (Filippenko, 1997; Gal-Yam, 2017; Sravan et al., 2019). The zero-age main-sequence mass estimates of E0102’s progenitor ranges from 25-50 (Blair et al., 2000; Flanagan et al., 2004; Finkelstein et al., 2006; Alan et al., 2019).
The original estimate of E0102’s explosion age was 1000 yr using a velocity map of [O III] 4959, 5007 emission (Tuohy & Dopita, 1983). Hughes et al. (2000) calculated the percentage expansion of E0102 using three epochs of X-ray observations spanning 20 yr obtained with the Einstein, ROSAT, and Chandra X-ray Observatory, and estimated an explosion age of yr, consistent with Tuohy & Dopita (1983). However, a much older age of yr was calculated using optical Fabry Perot imaging of oxygen-rich ejecta and fitting the velocity distribution with an ellipse (Eriksen et al., 2001). Alan et al. (2019) used archival Chandra data to estimate an explosion energy of ergs and a Sedov Age of 3500 yr based on a forward shock velocity of 710 , well above previous explosion age estimates. However, Xi et al. (2019), also using archival Chandra data, measured a forward shock velocity of and estimated explosion ages of yr or yr depending on whether a constant or power law circumstellar density model is used.
| PI | Date | Exp. Time | Instrument | Filter | Bandwidth | Velocity Range | Pixel Scale | |
|---|---|---|---|---|---|---|---|---|
| (s) | (Å) | (Å) | () | ′′ pixel-1 | ||||
| Morse | 07/04/1995 | 7200 | WFPC2/PC | F502N | 5012 | 27 | 1000 to +1500 | 0.0455 |
| Green | 10/15/2003 | 1520 | ACS/WFC | F475W | 4760 | 1458 | Full velocity range | 0.049 |
| Madore | 04/10/2013 | 2044 | ACS/WFC | F475W | 4760 | 1458 | Full velocity range | 0.049 |
| Milisavljevic | 05/12/2014 | 2753 | WFC3/UVIS | F502N | 5013 | 48 | 2000 to +2500 | 0.040 |
| Milisavljevic* | 05/12/2014 | 2665 | WFC3/UVIS | FQ492N | 4933 | 114 | Less than | 0.040 |
| Milisavljevic* | 05/12/2014 | 2665 | WFC3/UVIS | FQ508N | 5091 | 131 | Greater than + | 0.040 |
Note. — * denotes images not used in proper motion analysis
Among the most direct methods to estimate an explosion age is measuring proper motions of optically emitting dense knots of gas. Finkelstein et al. (2006) estimated the explosion age of E0102 to be 2054584 yr from proper motion measurements of optically emitting ejecta observed in two Hubble Space Telescope (HST) images: a 1995 image using the Wide Field Planetary Camera 2 (WFPC2) and a 2003 image using the Advanced Camera for Surveys (ACS). Finkelstein et al. (2006) measured the proper motions of 12 regions and determined the CoE of the remnant to be =1h04m02.05s and =-72∘01′54.9′′ (J2000) with a 1- uncertainty of 3.4′′ (henceforth Finkelstein CoE). This CoE is 2.4′′ north and slightly east of a geometric center measured by fitting an ellipse to the X-ray bright shell (Finkelstein et al., 2006).
Renewed interest in the precise location of the CoE of E0102 has been motivated by Vogt et al. (2018), who report an X-ray source as a possible central compact object (CCO) of E0102 formed in the original supernova explosion. Using the Multi Unit Spectroscopic Explorer (MUSE) on the Very Large Telescope (VLT), they discovered a ring of low-ionization Ne emission surrounding the X-ray source and concluded that the ring is being energized by the candidate CCO. The offset between the X-ray source and Finkelstein CoE implies a scenario where the CCO experienced a “kick” during the explosion with a transverse velocity of 850 km s-1 (Vogt et al., 2018). The true nature of the X-ray source is unresolved. Rutkowski et al. (2010) had inspected this X-ray source using archival Chandra X-ray images to search for candidate CCOs, but did not find it to be credible. On the other hand, Hebbar et al. (2020) performed X-ray spectral analysis on the source and found that it could be a neutron star powered by strong magnetic fields ( G). Xi et al. (2020) suggest that the compact feature is not a point source and is a knot of ejecta (see Section 4.4 for more details).
This paper improves over previous estimates of the CoE and the explosion age of E0102 by utilizing all available high resolution images obtained with HST and a larger sample of proper motion measurements. Section 2 discusses the images that were investigated, how they were measured for proper motion, and which epochs provided the most robust results. Section 3 describes our calculation of the CoE and explosion age and Section 4 discusses the implications of the measurements.
2 Observations and Proper Motion Measurements
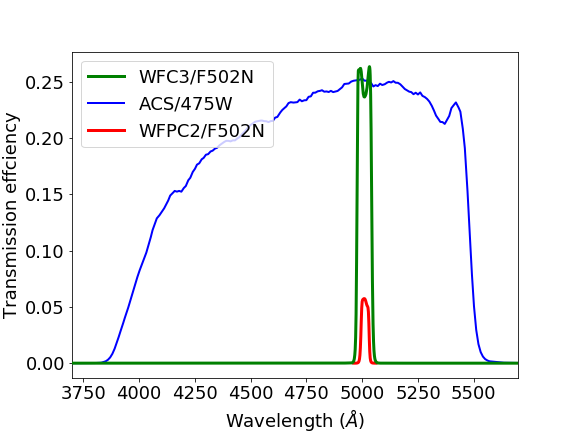
We examined four epochs of archival HST images of E0102, which were retrieved from the Mikulski Archive for Space Telescopes (MAST) and processed using Astrodrizzle. The 1995 image was obtained with WFPC2, the 2014 image was obtained with the Wide Field Camera 3 (WFC3), and the 2003 and 2013 images were both obtained with ACS. The details of the images including the PIs, date of observations, the filters, their associated bandwidths, and pixel scales can be found in Table 1. The F502N and F475W image filters are sensitive to emission from [O III] 4959,5007. After processing, the image scale for all images is approximately 0.05′′ pixel-1. All images were cropped to fit a common 45′′ 45′′ field of view.
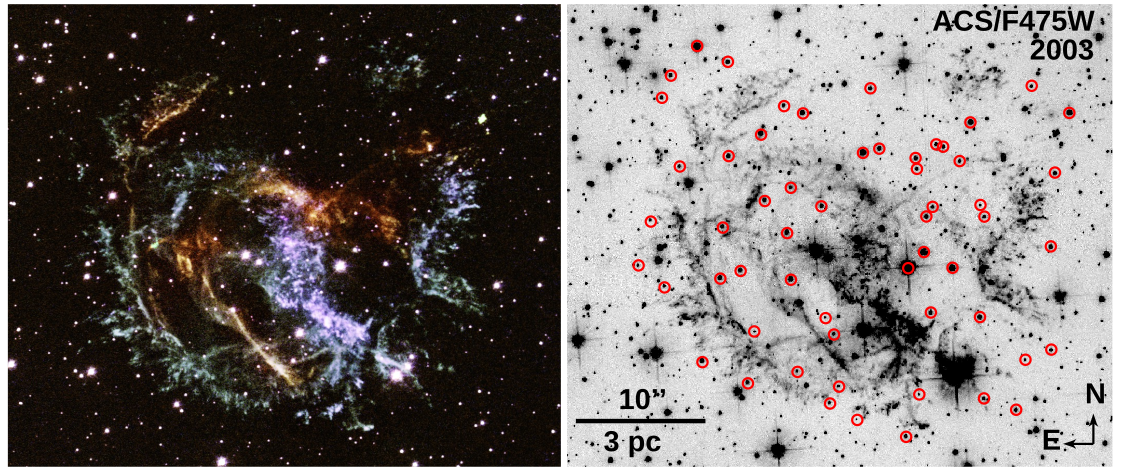
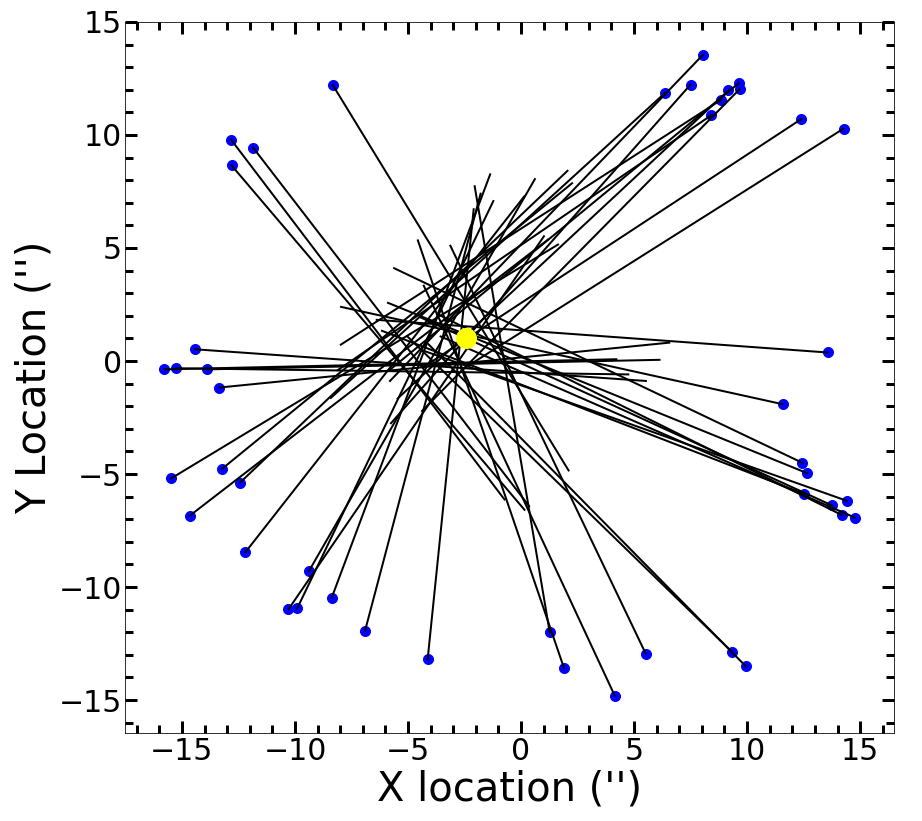
The images were aligned using the geomap and geotran tasks in IRAF111IRAF is distributed by the National Optical Astronomy Observatory, which is operated by the AURA, Inc., under cooperative agreement with the National Science Foundation. The Space Telescope Science Data Analysis System (STSDAS) is distributed by STScI.. The geomap command creates an image transformation database using anchor stars of two images, and geotran applies the transformation. The anchors for the alignment can be found in Figure 1. Anchors were carefully chosen among stars with low residuals when geomap was applied, excluding stars with high proper motions. Our anchor stars were among those used in Finkelstein et al. (2006). Once the images were aligned, an accurate World Coordinate System was applied using a locally compiled version of the Astrometry.net222Astrometry is distributed as open source under the GNU General Public License and was developed on Linux (Lang et al., 2010) code, which is accurate to .
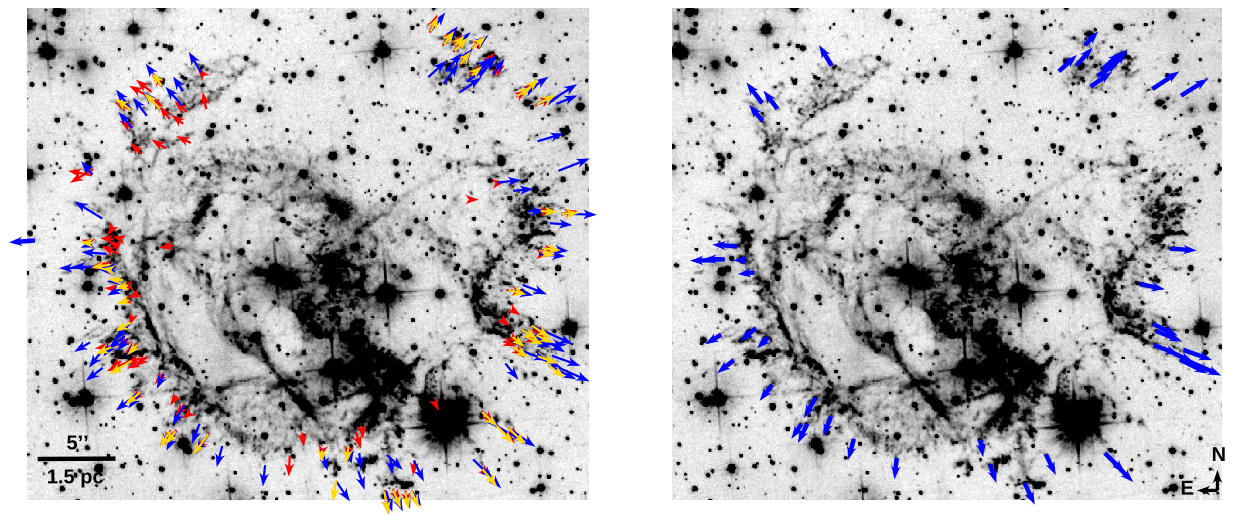
The individual knots were measured using two baselines, 2003-2013 and 1995-2014. The 1995-2014 epochs (1995 WFPC2/F502N and 2014 WFC3/F502N) provide the longest baseline, whereas the 2003-2013 epochs (2003 ACS/F475W and 2013 ACS/F475W) were obtained using the same filter and instrument, which optimized tracking of individual knots. Knots were chosen by how well they could be tracked visually and their proximity to the edge of the remnant (larger than 8′′ away from the Finkelstein CoE). The shifts of the knots were calculated by blinking between the two baseline images and visually locating the centers of knots or other conspicuous features (see Figure 2). The centers were measured multiple times to estimate positional errors ( relative error as compared to shifts). We measured 96 knots for the 2003-2013 baseline and 92 knots for the 1995-2014 baseline. A third multi-epoch data set was measured using all baselines. Implementing a similar multi-epoch measurement procedure as Winkler et al. (2009), we measured 51 knots that were discernible in all of the epochs. All proper motion measurements can be seen in Figure 3.
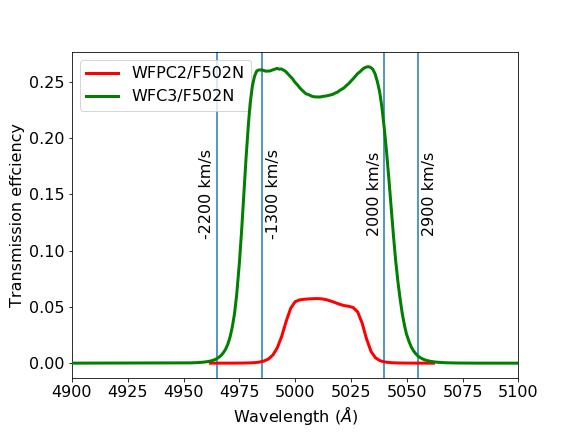
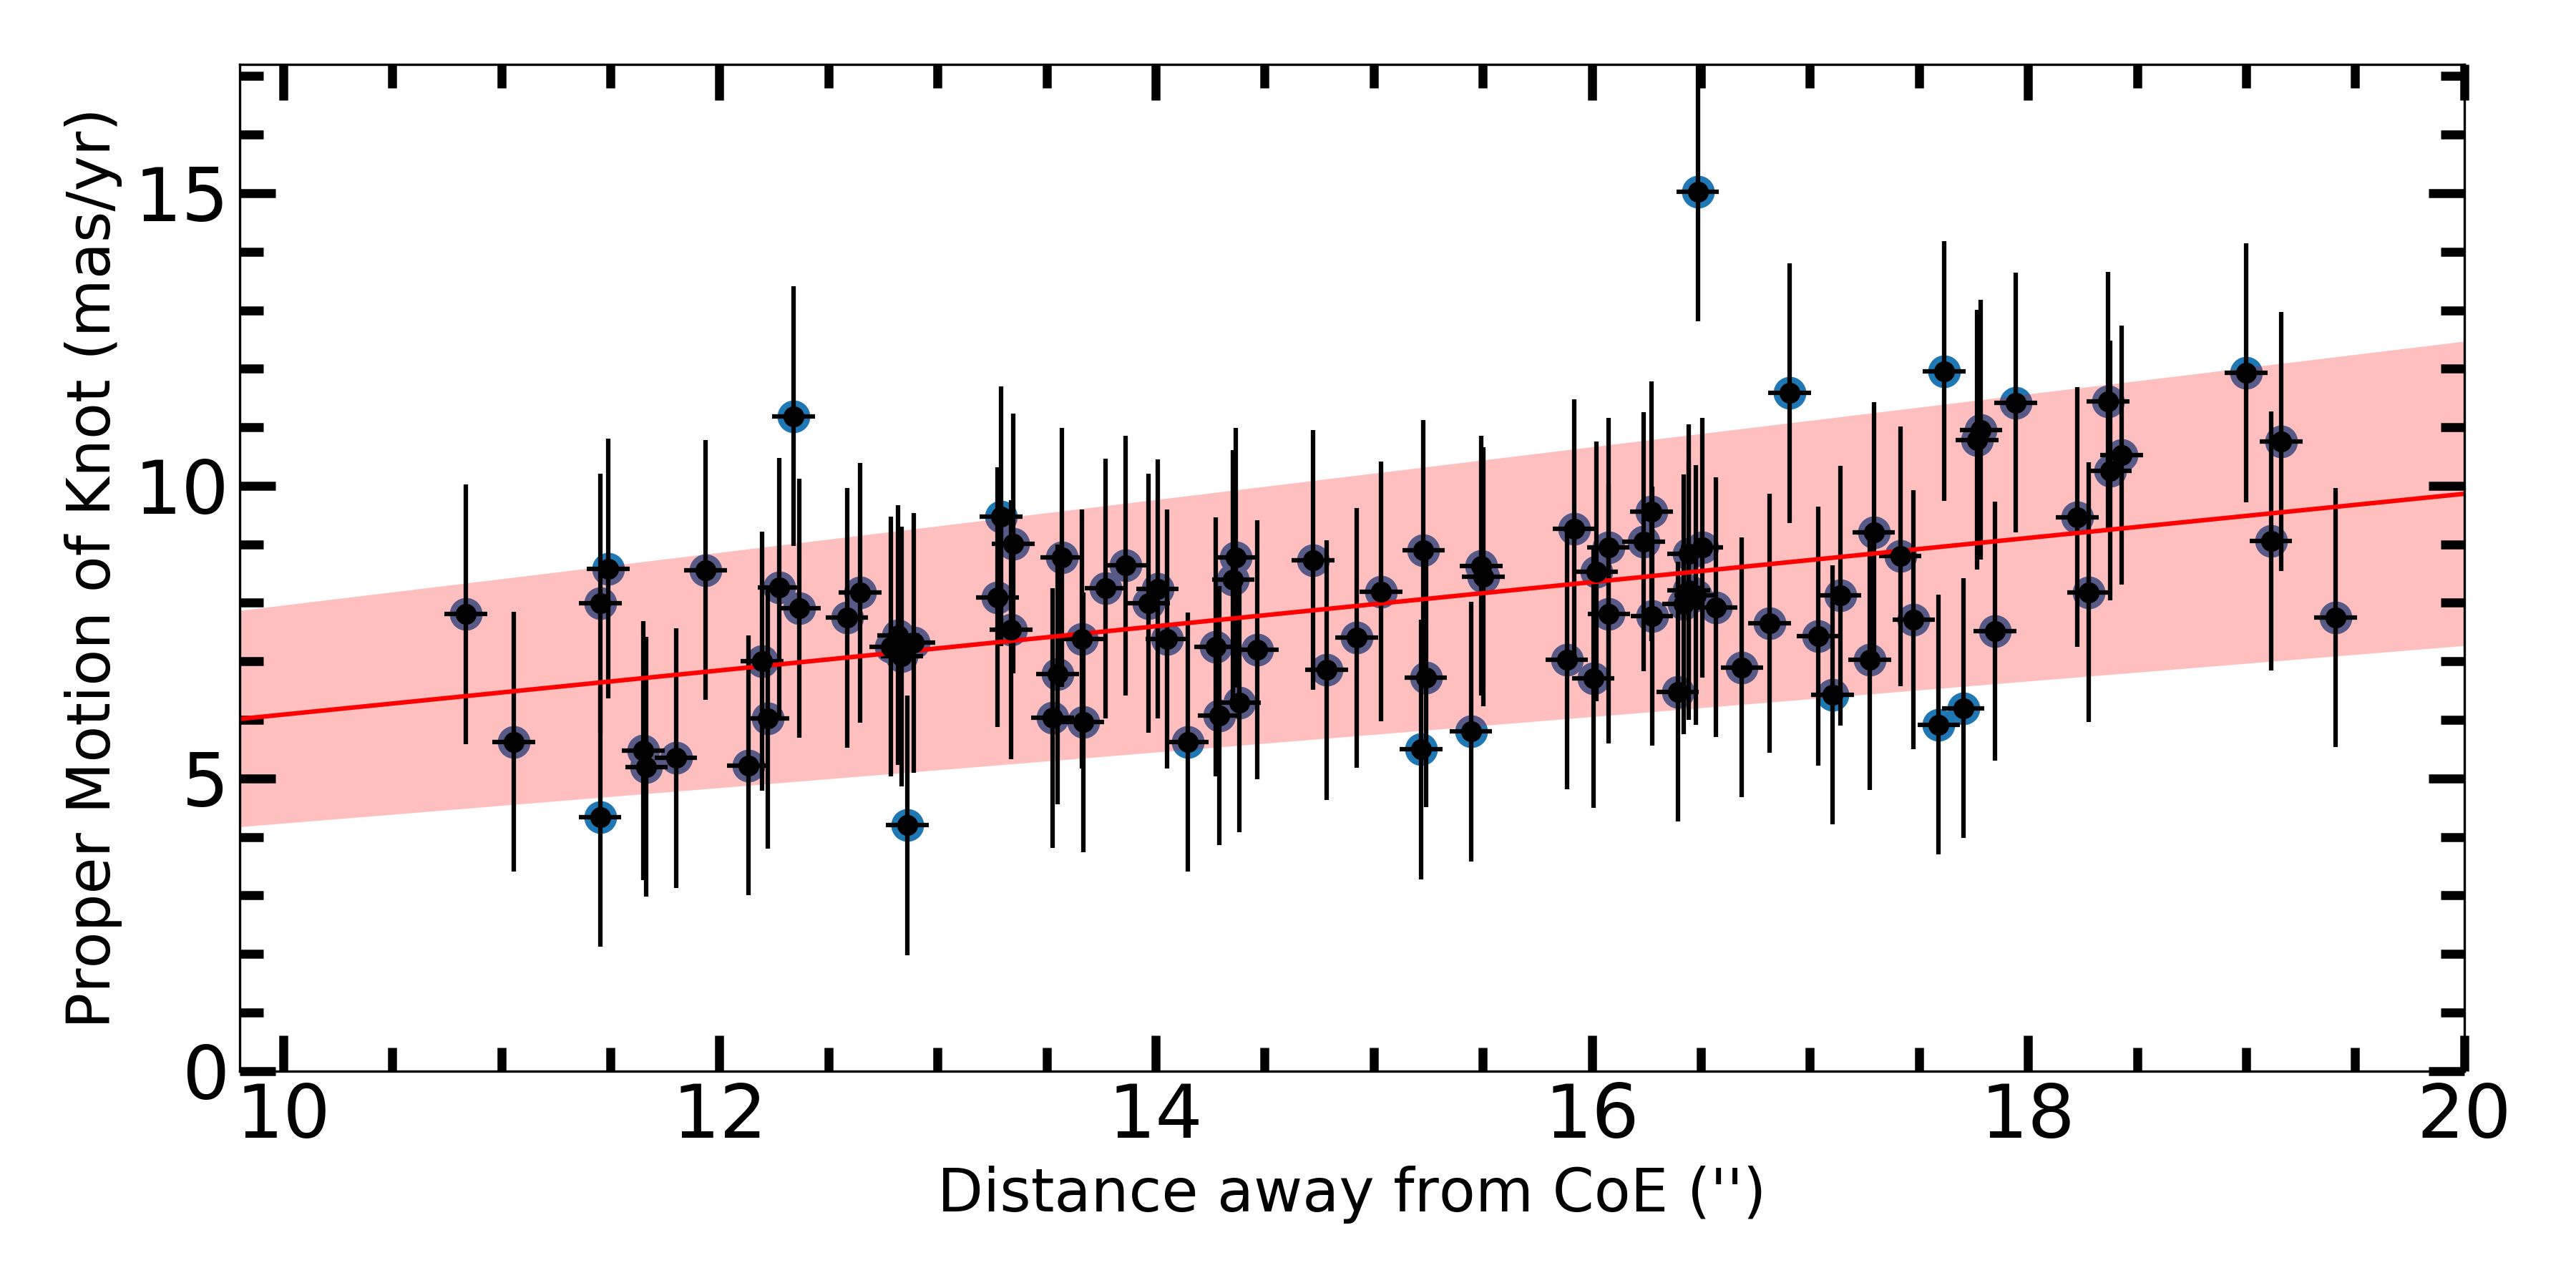
We find that proper motion measurements made from images obtained with the same instrument and filter configurations were much more reliable and accurate than those made from different configurations with longer baselines. Although the 1995 and 2014 epochs provided the largest baseline, in multiple cases there was ambiguity as to whether knots were moving or brightening in new regions due to the sensitivity differences of the instruments and/or differences in resolution with shifts on the order of 1 pixel (). The difference in bandpass between the two filters can be found in the Appendix (see Figure A1). The proper motion measurements for the 2003-2013 baseline have an average error of 20%, significantly lower than the average error of 90% in the 1995-2014 baseline, and 70% for the multi-epoch data set. Thus, the knots of the 2003-2013 baseline were tracked with the highest level of confidence, making this baseline the optimal choice for proper motion analysis. Figure 4 shows our 2003-2013 proper motions measurements as a function of distance away from a CoE.
3 Center of Expansion and Age
3.1 Proper motion asymmetry
Our approach of using many measurements of individual knots instead of measuring large regions allowed for the remnant to be reasonably well sampled along many position angles. This approach offers potential advantages over Finkelstein et al. (2006) who utilized a dozen large regions (each approximately square arcseconds in size) in order to compensate for the smaller baseline and differences in detector response and resolution. Consequently, Finkelstein et al. (2006) were only able to sample limited position angles.
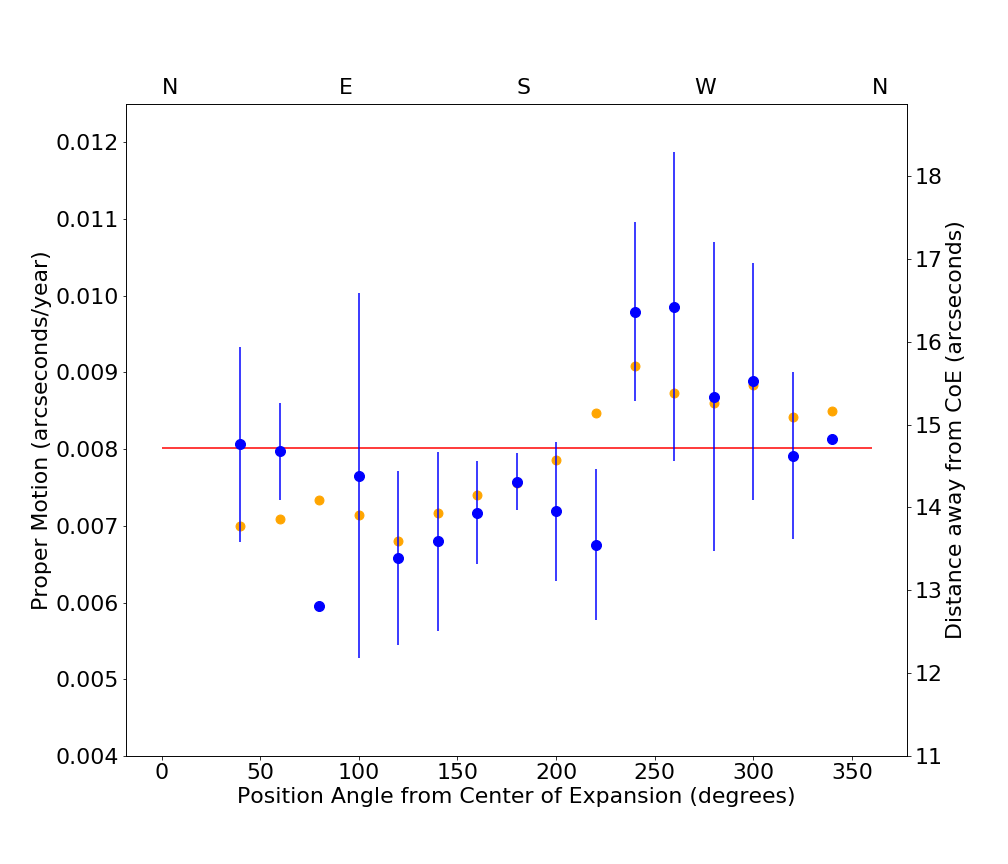
Our measurements utilizing two epochs of ACS data were of sufficient resolution to identify that ejecta knots are not expanding uniformly, and that the rate of expansion changes with position around the remnant. In Figure 5, the proper motion of knots as a function of the position angle, binned into 20∘ slices, is shown. The observed proper motion is compared to the expected proper motion when applying the 2003-2013 linear fit to the average distance away from the CoE of each slice (see additional details in Section 2). There is a clear division in observed versus expected proper motions between knots in the eastern versus western sides of the remnant. Between position angles 90-230∘, ejecta knots exhibit below average proper motion. A relationship between proper motion and position angle location of ejecta knots is an important consideration for techniques that assume ballistic motion and uniform expansion to determine the CoE and expansion age. Possible explanations for this non-uniform expansion are discussed in Section 4.
With this level of asymmetry present, knot selection becomes vitally important. We carefully narrowed down the original 96 knots of the 2003-2013 baseline to 45 knots on the basis of tracking confidence, uniform shape between epochs, and trajectories that are within 20 degrees of the position angle from the Finkelstein CoE. These selected knots have been used to calculate the CoE and explosion age (right panel of Figure 3).
| Reference | CoE (J2000) | CoE (J2000) | 1- uncertainty (′′) | Explosion Age (yr) |
|---|---|---|---|---|
| This Paper | 1h04m02.48s | -72∘01′53.92′′ | 1.77 | 1738175 |
| Finkelstein et al. (2006) | 1h04m02.05s | -72∘01′54.9′′ | 3.4 | 2054584 |
| X-ray Center (Finkelstein et al., 2006) | 1h04m02.08s | -72∘01′52.5′′ | ||
| Forward Shock Center (Xi et al., 2019) | 1h04m01.964s | -72∘01′53.47′′ | ||
| Reverse Shock Center (Xi et al., 2019) | 1h04m02.048s | -72∘01′52.75′′ | ||
| Tuohy & Dopita (1983) | 1000 | |||
| Hughes et al. (2000) | ||||
| Eriksen et al. (2001) | 2100 |
3.2 Center of Expansion
Our approach to determine the CoE of E0102 uses selected proper motion measurements of the 2003-2013 baseline in combination with a likelihood function. This method is similar to that used by Thorstensen et al. (2001) to determine the CoE of Cassiopeia A. We favor this method because it only depends on the direction of the knots, and is not sensitive to deceleration or non-uniform expansion over time. Other methods (e.g. Winkler et al., 2009) were considered. However, these methods assume uniform expansion, which cannot be assumed with E0102.
The likelihood function used is:
where (X,Y) is an arbitrary center of expansion and is the perpendicular distance between (X,Y) and the knot’s line of position (Thorstensen et al., 2001). We defined to be the uncertainty associated with the point common to the knot’s extended line of position and . This differs from the original likelihood function from Thorstensen et al. (2001), where was defined to represent the positional uncertainty of the knot near the time of explosion. We modified because of our comparatively poor constraint on the time of explosion. The (X,Y) that maximizes this function gives the CoE. This is repeated for 100,000 artificial data sets generated from position and direction distributions of individual knots (see Section 2). Using this method and proper motion measurements from the selected 45 knots yields a CoE of =1h04m02.48s and =-72∘01′53.92′′ (J2000) with 1- uncertainty of 1.77′′.
To confirm the purity of our selected 45 knots used in our estimate of the CoE, we ran an additional 100 calculations of the CoE using 45 randomly selected knots from all 96 measurements for each iteration. The resulting CoEs are within 1- in radius around our favored CoE, but the majority are away and collectively are associated with a larger average error (approximately ). Thus, narrowing down knot measurements from the original 96 to 45 introduces a non-negligible improvement in our estimate of the CoE.
3.3 Explosion Age
Our method to determine the explosion age uses only knots with the highest proper motions to calculate an explosion age. A similar approach was used by Fesen et al. (2006) to improve upon the explosion age of Cassiopeia A, first made in Thorstensen et al. (2001). Proper motions of ejecta in E0102 are not uniform around the remnant, which suggests that some regions have been decelerated and more strongly influenced by interaction with surrounding material.
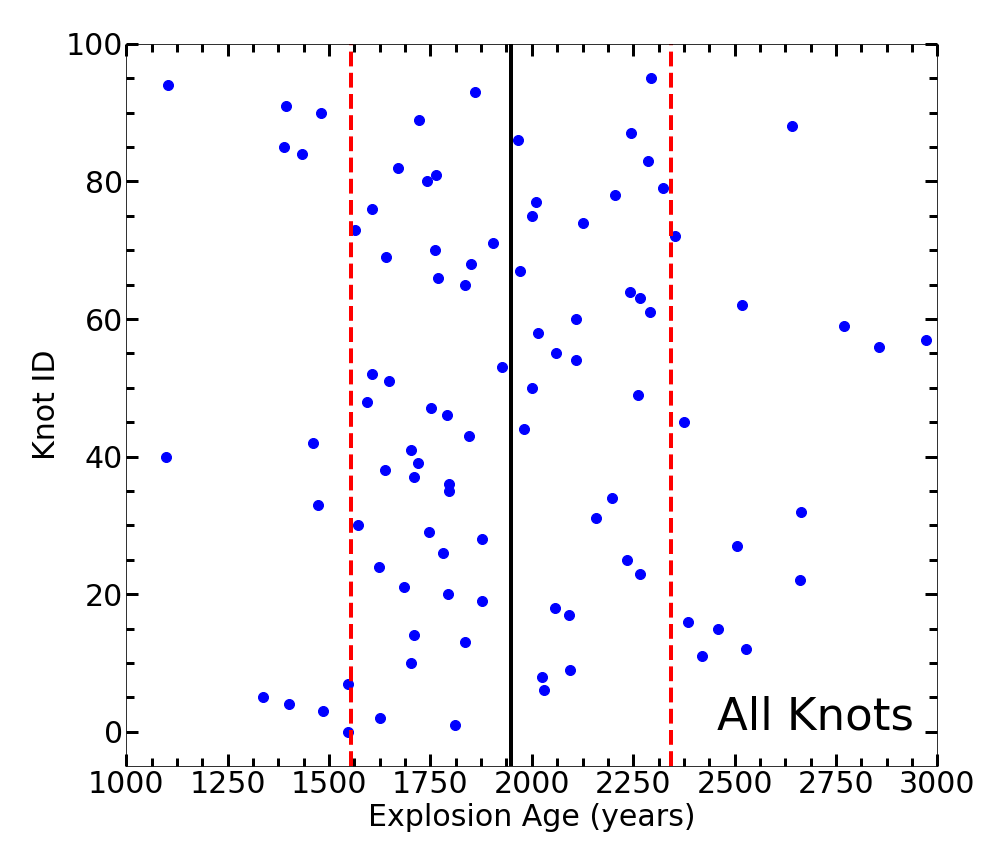
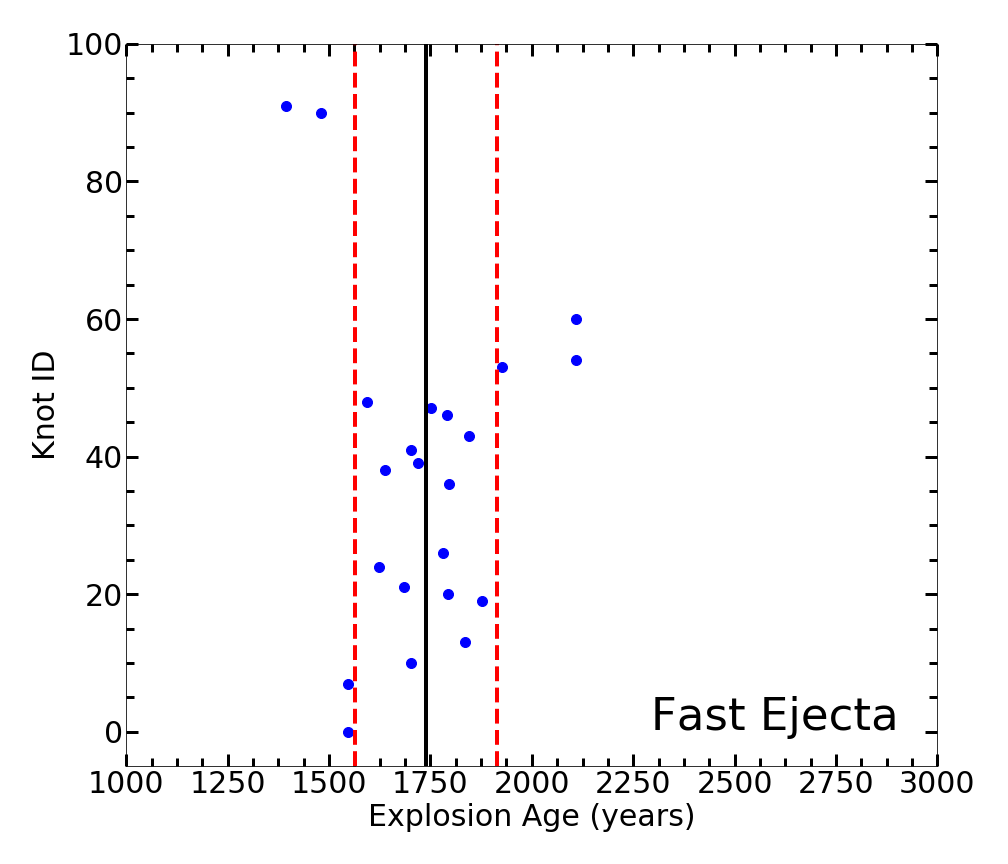
By assuming that knots with the fastest proper motions are least decelerated and therefore truer representations of the initial ejection velocity of the knots, a more accurate explosion age can be inferred. 22 of the 45 selected knots with proper motions greater than the average (0.008′′ yr-1) were examined. These knots represent the highest proper motions within E0102. The explosion age was calculated by dividing a knot’s distance away from the CoE by the proper motion of the knot. Adopting the CoE derived from the likelihood method (Section 3.2), this resulted in an explosion age of 1738 175 yr. The difference in choosing all of the knots versus the fastest can be found in Figure 6. If all 96 knots from the 2003-2013 baseline are included in the calculation, the result is yr, similar to Finkelstein et al. (2006). Notably, if we further restrict our selection of knots to only those having the fastest proper motion and that are furthest out from the CoE (corresponding to knots between position angles 200-280∘), we still retrieve our favored explosion age ( yr). Our fast ejecta explosion age is consistent with the age found in Xi et al. (2019) using a constant density model for the ambient medium (see Section 4.3 for our interpretation).
4 Discussion
4.1 Knot Results
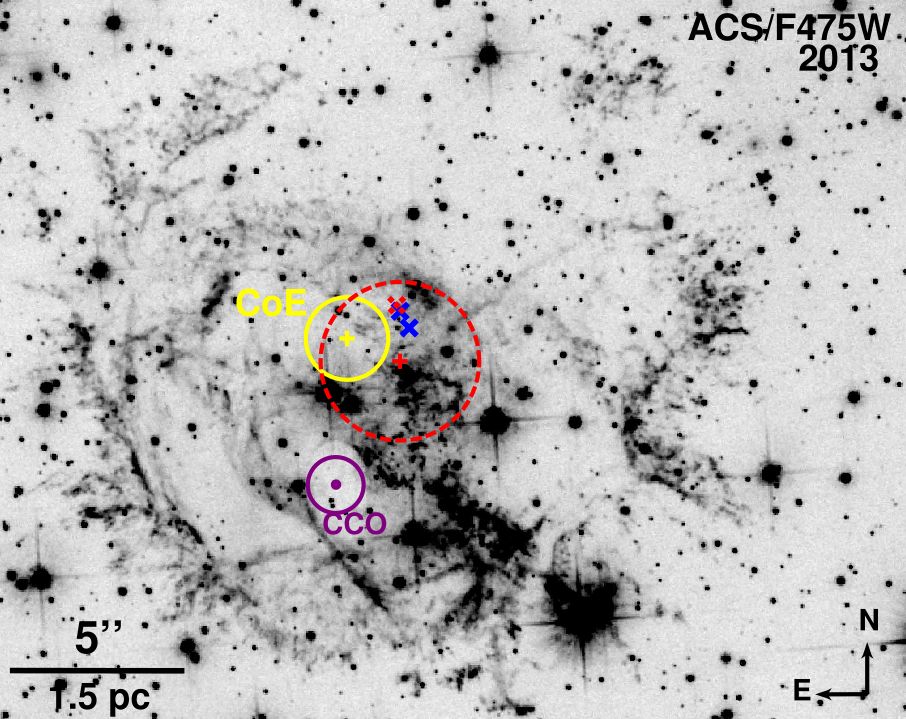
In Table 2 we list the results of our CoE and explosion age estimates along with estimates made by previous studies. Figure 7 shows the coordinates of our CoE, the Finkelstein CoE, and the proposed CCO (Vogt et al., 2018), with their associated uncertainties. Our CoE is approximately 2.0′′ east and 1.0′′ north of the Finkelstein CoE, and the two estimates are consistent within uncertainties.
Notably, our CoE and 1- error estimate lies roughly 2.3′′ away from estimates of E0102’s geometric X-ray center and reverse shock’s geometric center, and 2.4′′ away from the forward shock’s geometric center (Finkelstein et al., 2006; Xi et al., 2019). An offset between the CoE and the geometric X-ray center is not unique to E0102, and is observed in Cassiopeia A, G292.0+1.8, and Puppis A (Katsuda et al., 2018, references therein). One explanation for this discrepancy is age and the associated prolonged interaction with CSM (Katsuda et al., 2018). This likely applies to E0102 as well, given the asymmetry in the expansion we observe (Figure 5).
4.2 Ablation trails
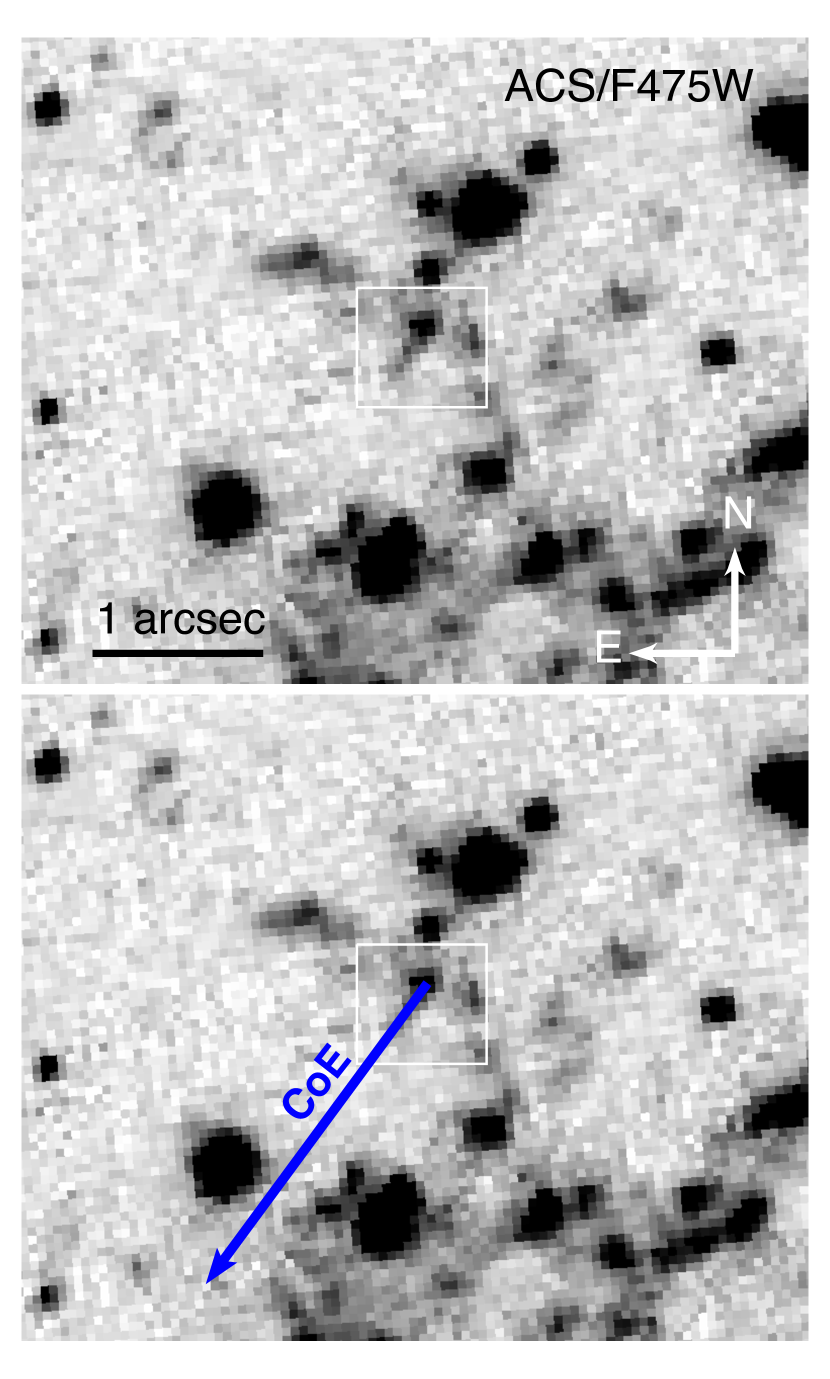
An additional check for our calculated CoE is to inspect alignment between the ablation trails of ejecta knots, if visible, with radial vectors extending from the CoE to the ejecta knot’s location. Fesen et al. (2011) demonstrated how the gradual dissolution of high-velocity ejecta caused by passage through CSM/ISM in Cassiopeia A can leave trailing emission that traces back to the CoE. Figure 8 shows an example knot in E0102 where the ablation trail is visible and has a path that traces back towards our estimated CoE. There are fewer examples of ejecta knot ablation in E0102 as compared to Cassiopeia A, which is likely a consequence of E0102’s advanced age and greater distance. Ejecta knots observed in Cassiopeia A are () in size, and thus at the distance of E0102 we are only sensitive to the largest and most brightly emitting knots.
4.3 Expansion asymmetry
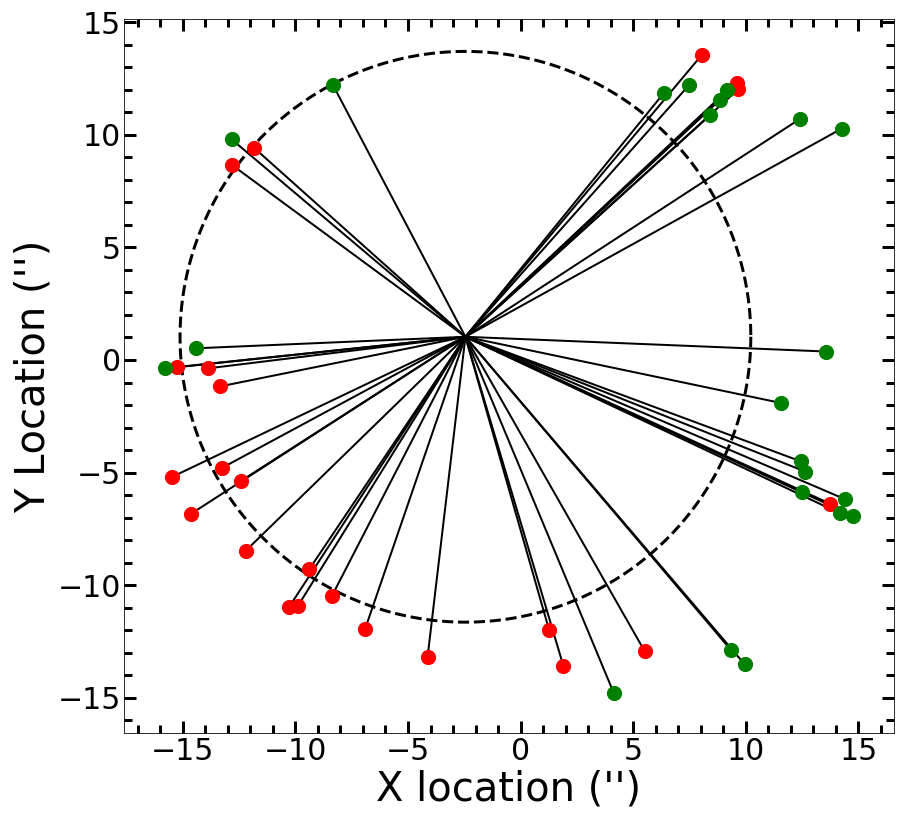
Our proper motion measurements of E0102 using two epochs of HST/ACS images were of sufficient angular and temporal resolution to determine that ejecta knot expansion is not homologous. With high confidence we find asymmetry in the proper motions as a function of position angle (see Figure 5). This phenomenon is highlighted in Figure 9. The left panel of Figure 9 shows knot trajectories tracing back 2500 yr as compared to our CoE. The right panel shows the high proper motion knots used for both our age estimate and our CoE calculation (shown in green), the knots used for the CoE calculation and not the explosion age estimate (red), and the shape of the remnant if expanding uniformly at the mean proper motion ( yr-1; dashed circle). While average uniform expansion fits with the eastern limb, it does a poor job of fitting the western portion of the remnant. The discrepancy provides strong evidence for non-uniform expansion. The non-uniform expansion may be due to either asymmetry in the original supernova explosion or interaction between the original supernova blast wave and an inhomogeneous CSM/ISM.
Explosion asymmetry has been suggested for E0102. Finkelstein et al. (2006) noticed a possible jet structure running SW-NE and a possible density gradient within the CSM, caused by mass loss of the progenitor. They proposed a Wolf-Rayet (WR) progenitor star after examining the surrounding environment, especially the possible association with N76A, a nearby hydrogen cloud with characteristics similar to a WR bubble. However, Vogt & Dopita (2010) found that the association with N76A is unlikely due to increasing ISM density along the path to N76A. A perceived preferred axis in their 3D reconstruction and the ISM density gradient being perpendicular to this axis led Vogt & Dopita (2010) to favor explosion asymmetry.
However, our measurements highlight a conspicuous correlation between knots with slower-than-average proper motion and regions of increased supernova–CSM interaction. In particular, X-ray studies have shown that the southeast portions of the remnant where we measure the slowest proper motions is also a region of increased CSM density (Sasaki et al., 2006). Likewise, the forward shock has a greater extent in the southwest (Xi et al., 2019), where we observe some of the fastest proper motions. Thus, ejecta knot expansion asymmetry is most likely due to interaction between the original supernova and an inhomogeneous CSM/ISM that has decelerated ejecta in localized regions.
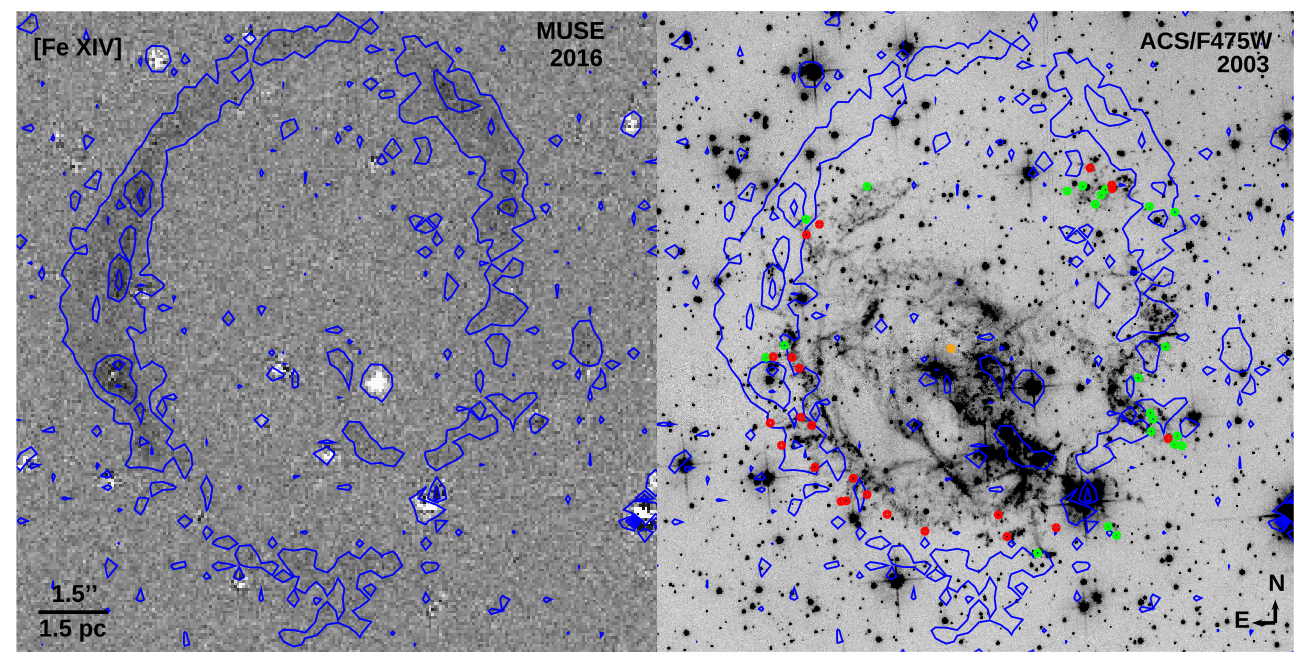
The inhomogeneous environment would have been sculpted by the mass loss of the massive star progenitor. Finkelstein et al. (2006) suspected that the E0102 SNR was expanding into an asymmetric bubble swept out by the strong winds of a WR progenitor star. This interpretation was supported by spectroscopic observations made with MUSE sensitive to [Fe XIV] and [Fe XI] by Vogt et al. (2017) that appear to trace this remnant bubble (see Figure 10). These emission lines, which map forward shock interaction with dense ISM, correlate with regions where O-rich ejecta have lower proper motion. This is particularly noticeable in the east where an extended filament of ejecta with lower-than-average proper motion overlaps with strong [Fe XIV] emission. Likewise, knots with higher-than-average proper motion are disproportionately located in the southwest where there is the least amount of [Fe XIV] emission.
Taking this expansion asymmetry into consideration, we used the fastest and presumably least decelerated knots to calculate E0102’s expansion age to be 1738 175 yr. This is comparable with Eriksen et al. (2001) and Finkelstein et al. (2006) age estimates, but outside of the Hughes et al. (2000) estimate. Our age estimate should be strictly interpreted as an upper limit because we are unable to measure the amount of deceleration experienced by the ejecta knots used in our proper motion analysis. Additional epochs of proper motion measurements could potentially determine the deceleration experienced by the knots, giving a more precise age estimate.
Our explosion age estimate is also consistent with the age calculated by Xi et al. (2019) using a global constant density ambient medium, combining mass loss and ISM. However, the scenario favored by our data is more complex, such that the eastern expansion of ejecta has encountered ISM/CSM gas of higher density. Xi et al. (2019) also notes that with their models, a WR progenitor isotropically losing mass is unlikely. The mass loss could be caused by a single star progenitor through episodic eruptions (see Smith, 2014, for discussion). Another channel of mass loss is via inefficient mass loss in binary interactions (Ouchi & Maeda, 2017; Sravan et al., 2020). Recently, Seitenzahl et al. (2018) reported the detection of hydrogen spectral features within E0102, supporting a Type IIb progenitor. It has been found that the majority of progenitor stars of Type IIb SNe are partially stripped of their hydrogen-rich envelopes via binary interactions (Claeys et al., 2011; Yoon et al., 2017; Sravan et al., 2019).
4.4 Proposed CCO Results
Our CoE is 6.4′′ away from the candidate CCO proposed by Vogt et al. (2018). Assuming a distance of 62 kpc (Graczyk et al., 2014; Scowcroft et al., 2016), this would correspond to 0.3 pc. Using our calculated CoE and explosion age, this translates to a kick velocity of for the proposed CCO. This velocity is larger but still within uncertainties of the velocity calculated by Vogt et al. (2018) using the Finkelstein CoE and age ( ).
The inferred kick velocity is large compared to kick velocities of other neutron stars. Hobbs et al. (2005) found that in a sample of 233 pulsars, most pulsars younger than 3 Myr have a mean velocity of just 400265 . Only two pulsars have velocities above 1000 , both with questionable distance estimates. However, E0102’s inferred kick velocity is comparable to two other young SNRs, Puppis A and N49, with plane of sky velocities of 76373 (Mayer et al., 2020) and 110050 (Katsuda et al., 2018), respectively. It should be noted that the velocity for N49 was found using the X-ray center and not a CoE, which could lead to an overestimation (see Section 4.1 for more details).
On the other hand, simulations have shown that kick velocities of over 1000 may be possible. Scheck et al. (2006) observed neutron stars with kick velocities exceeding 1000 in 2D simulations. In 3D models, Wongwathanarat et al. (2013) found that core collapse explosions of progenitor stars with ZAMS between 15-20 could generate kicks with velocities of upward of 700 . Janka (2017) found that, for 2D and 3D simulations, a high level of explosion asymmetry (common in high mass progenitor systems) can cause higher kick velocities.
Hebbar et al. (2020) and Xi et al. (2020) each conducted a careful analysis of Chandra observations of the candidate CCO that included time-dependent responses for each of the archival observations, modeling of the background instead of subtracting it, and fitting the unbinned spectra to preserve the maximal spectral information. Hebbar et al. (2020) found that a single blackbody model does not provide an acceptable fit to the data, but a blackbody+power-law or a neutron star carbon atmosphere model do provide acceptable fits. However, the blackbody+power-law model fit has a neutral hydrogen column density that is higher than the accepted value to E0102 and the neutron star carbon atmosphere model has a value that is higher. Xi et al. (2020) also found that a single blackbody model is not consistent with the data and they fit the spectrum of the compact feature with a thermal, non-equilibrium ionization model, finding acceptable fits with neutral hydrogen column density values consistent with the accepted value. They find two classes of thermal models can fit the spectra equally well, one with a temperature of keV, an ionization timescale of , and marginal evidence for enhanced abundances of O and Ne, and the other with a temperature of keV, an ionization timescale of , and abundances consistent with local interstellar medium values. The limited statistics in the spectrum of this faint feature prevents any further discrimination amongst these spectral models.
Xi et al. (2020) also conducted an analysis of the spatial distribution of the counts, and showed that the distribution is not consistent with that of an isolated point source. Though they could not rule out a point source embedded in a region of diffuse emission, its flux must be significantly lower than the values reported in Vogt et al. (2018) and Hebbar et al. (2020). Based on the spectral and image analysis, Xi et al. (2020) questioned the association of the X-ray source with a neutron star and suggest instead that it is likely to be a knot of O- and Ne-rich ejecta associated with the reverse shock.
5 Conclusion
We have estimated the CoE and expansion age of E0102 by measuring proper motions of O-rich ejecta observed in multi-epoch HST images. We analyzed all [O III]-sensitive images over a 19 year period, but found that the 2003-2013 ACS/F475W baseline from which 45 different knots could be confidently tracked produced the most robust results. The high resolution of HST made it possible to identify evidence of non-homologous expansion of the knots, which we conclude to be the result of interaction with an inhomogeneous CSM environment.
We calculated the CoE using only the direction of the proper motion and a likelihood function, which yielded a CoE of =1h04m02.48s and =-72∘01′53.92′′ (J2000) with the 1- uncertainty being 1.77′′. This CoE is 2.2′′ away from, but consistent with, the CoE calculated by Finkelstein et al. (2006). Using only the fastest knots we calculated an explosion age of 1738 175 yr. Our CoE is 6.4′′ away from the candidate CCO proposed by Vogt et al. (2018), implying a transverse kick velocity of 1070 . This is an unusually large velocity compared to an average neutron star velocity of 400 (Hobbs et al., 2005) and one of the highest among other SNRs (Katsuda et al., 2018), although simulations have been able to achieve kick velocities greater than 1000 (e.g. Scheck et al., 2006). Our results generally support the recent conclusions of Xi et al. (2020) that the X-ray source identified as a CCO may well be a knot of ejecta that has been excited by the reverse shock.
A new epoch of HST/ACS images would expand our understanding of E0102. Such images would enable multi-epoch analysis that would tighten uncertainties on proper motion, estimate potential deceleration, and further constrain the CoE and explosion age. This, in turn, would test our conclusion that non-homologous expansion of E0102’s optical knots is caused by interaction of the original supernova blast wave with inhomogeneous CSM.
References
- Alan et al. (2019) Alan, N., Park, S., & Bilir, S. 2019, ApJ, 873, 53, doi: 10.3847/1538-4357/aaf882
- Astropy Collaboration et al. (2013) Astropy Collaboration, Robitaille, T. P., Tollerud, E. J., et al. 2013, A&A, 558, A33, doi: 10.1051/0004-6361/201322068
- Astropy Collaboration et al. (2018) Astropy Collaboration, Price-Whelan, A. M., Sipőcz, B. M., et al. 2018, AJ, 156, 123, doi: 10.3847/1538-3881/aabc4f
- Blair et al. (2000) Blair, W. P., Morse, J. A., Raymond, J. C., et al. 2000, ApJ, 537, 667, doi: 10.1086/309077
- Chevalier & Fransson (2017) Chevalier, R. A., & Fransson, C. 2017, in Handbook of Supernovae, ed. A. W. Alsabti & P. Murdin (Springer International Publishing AG), 875, doi: 10.1007/978-3-319-21846-5_34
- Claeys et al. (2011) Claeys, J. S. W., de Mink, S. E., Pols, O. R., Eldridge, J. J., & Baes, M. 2011, A&A, 528, A131, doi: 10.1051/0004-6361/201015410
- Dopita et al. (1981) Dopita, M. A., Tuohy, I. R., & Mathewson, D. S. 1981, ApJ, 248, L105, doi: 10.1086/183635
- Eriksen et al. (2001) Eriksen, K. A., Morse, J. A., Kirshner, R. P., & Winkler, P. F. 2001, in American Institute of Physics Conference Series, Vol. 565, Young Supernova Remnants, ed. S. S. Holt & U. Hwang, 193–196, doi: 10.1063/1.1377093
- Fesen et al. (2011) Fesen, R. A., Zastrow, J. A., Hammell, M. C., Shull, J. M., & Silvia, D. W. 2011, ApJ, 736, 109, doi: 10.1088/0004-637X/736/2/109
- Fesen et al. (2006) Fesen, R. A., Hammell, M. C., Morse, J., et al. 2006, ApJ, 645, 283, doi: 10.1086/504254
- Filippenko (1997) Filippenko, A. V. 1997, ARA&A, 35, 309, doi: 10.1146/annurev.astro.35.1.309
- Finkelstein et al. (2006) Finkelstein, S. L., Morse, J. A., Green, J. C., et al. 2006, ApJ, 641, 919, doi: 10.1086/500570
- Flanagan et al. (2004) Flanagan, K. A., Canizares, C. R., Dewey, D., et al. 2004, ApJ, 605, 230, doi: 10.1086/382145
- Gal-Yam (2017) Gal-Yam, A. 2017, in Handbook of Supernovae, ed. A. W. Alsabti & P. Murdin (Springer International Publishing AG), 195, doi: 10.1007/978-3-319-21846-5_35
- Graczyk et al. (2014) Graczyk, D., Pietrzyński, G., Thompson, I. B., et al. 2014, ApJ, 780, 59, doi: 10.1088/0004-637X/780/1/59
- Green (2012) Green, W. 2012, Society for Astronomical Sciences Annual Symposium, 31, 159
- Hammell & Fesen (2008) Hammell, M. C., & Fesen, R. A. 2008, ApJS, 179, 195, doi: 10.1086/591528
- Hebbar et al. (2020) Hebbar, P. R., Heinke, C. O., & Ho, W. C. G. 2020, MNRAS, 491, 1585, doi: 10.1093/mnras/stz2570
- Hobbs et al. (2005) Hobbs, G., Lorimer, D. R., Lyne, A. G., & Kramer, M. 2005, MNRAS, 360, 974, doi: 10.1111/j.1365-2966.2005.09087.x
- Hughes et al. (2000) Hughes, J. P., Rakowski, C. E., & Decourchelle, A. 2000, ApJ, 543, L61, doi: 10.1086/312945
- Janka (2017) Janka, H.-T. 2017, ApJ, 837, 84, doi: 10.3847/1538-4357/aa618e
- Kamper & van den Bergh (1976) Kamper, K., & van den Bergh, S. 1976, PASP, 88, 587, doi: 10.1086/129989
- Katsuda et al. (2018) Katsuda, S., Morii, M., Janka, H.-T., et al. 2018, ApJ, 856, 18, doi: 10.3847/1538-4357/aab092
- Lang et al. (2010) Lang, D., Hogg, D. W., Mierle, K., Blanton, M., & Roweis, S. 2010, AJ, 139, 1782, doi: 10.1088/0004-6256/139/5/1782
- Mayer et al. (2020) Mayer, M., Becker, W., Patnaude, D., Winkler, P. F., & Kraft, R. 2020, ApJ, 899, 138, doi: 10.3847/1538-4357/aba121
- Milisavljevic & Fesen (2017) Milisavljevic, D., & Fesen, R. A. 2017, in Handbook of Supernovae, ed. A. W. Alsabti & P. Murdin (Springer International Publishing AG), 2211, doi: 10.1007/978-3-319-21846-5_97
- Murdin & Clark (1979) Murdin, P., & Clark, D. H. 1979, MNRAS, 189, 501, doi: 10.1093/mnras/189.3.501
- Ouchi & Maeda (2017) Ouchi, R., & Maeda, K. 2017, ApJ, 840, 90, doi: 10.3847/1538-4357/aa6ea9
- Patnaude & Badenes (2017) Patnaude, D., & Badenes, C. 2017, in Handbook of Supernovae, ed. A. W. Alsabti & P. Murdin (Springer International Publishing AG), 2233, doi: 10.1007/978-3-319-21846-5_98
- Rasmussen et al. (2001) Rasmussen, A. P., Behar, E., Kahn, S. M., den Herder, J. W., & van der Heyden, K. 2001, A&A, 365, L231, doi: 10.1051/0004-6361:20000231
- Rutkowski et al. (2010) Rutkowski, M. J., Schlegel, E. M., Keohane, J. W., & Windhorst, R. A. 2010, ApJ, 715, 908, doi: 10.1088/0004-637X/715/2/908
- Sasaki et al. (2006) Sasaki, M., Gaetz, T. J., Blair, W. P., et al. 2006, ApJ, 642, 260, doi: 10.1086/500789
- Scheck et al. (2006) Scheck, L., Kifonidis, K., Janka, H. T., & Müller, E. 2006, A&A, 457, 963, doi: 10.1051/0004-6361:20064855
- Scowcroft et al. (2016) Scowcroft, V., Freedman, W. L., Madore, B. F., et al. 2016, ApJ, 816, 49, doi: 10.3847/0004-637X/816/2/49
- Seitenzahl et al. (2018) Seitenzahl, I. R., Vogt, F. P. A., Terry, J. P., et al. 2018, ApJ, 853, L32, doi: 10.3847/2041-8213/aaa958
- Seward & Mitchell (1981) Seward, F. D., & Mitchell, M. 1981, ApJ, 243, 736, doi: 10.1086/158641
- Smartt (2009) Smartt, S. J. 2009, ARA&A, 47, 63, doi: 10.1146/annurev-astro-082708-101737
- Smith (2014) Smith, N. 2014, ARA&A, 52, 487, doi: 10.1146/annurev-astro-081913-040025
- Smithsonian Astrophysical Observatory (2000) Smithsonian Astrophysical Observatory. 2000, SAOImage DS9: A utility for displaying astronomical images in the X11 window environment. http://ascl.net/0003.002
- Sravan et al. (2019) Sravan, N., Marchant, P., & Kalogera, V. 2019, ApJ, 885, 130, doi: 10.3847/1538-4357/ab4ad7
- Sravan et al. (2020) Sravan, N., Milisavljevic, D., Reynolds, J. M., Lentner, G., & Linvill, M. 2020, ApJ, 893, 127, doi: 10.3847/1538-4357/ab8128
- Thorstensen et al. (2001) Thorstensen, J. R., Fesen, R. A., & van den Bergh, S. 2001, AJ, 122, 297, doi: 10.1086/321138
- Tuohy & Dopita (1983) Tuohy, I. R., & Dopita, M. A. 1983, ApJ, 268, L11, doi: 10.1086/184020
- Vogt & Dopita (2010) Vogt, F., & Dopita, M. A. 2010, ApJ, 721, 597, doi: 10.1088/0004-637X/721/1/597
- Vogt (2019) Vogt, F. P. A. 2019, brutifus: Python module to post-process datacubes from integral field spectrographs. http://ascl.net/1903.004
- Vogt et al. (2018) Vogt, F. P. A., Bartlett, E. S., Seitenzahl, I. R., et al. 2018, Nature Astronomy, 2, 465, doi: 10.1038/s41550-018-0433-0
- Vogt et al. (2017) Vogt, F. P. A., Seitenzahl, I. R., Dopita, M. A., & Ghavamian, P. 2017, A&A, 602, L4, doi: 10.1051/0004-6361/201730756
- Winkler & Kirshner (1985) Winkler, P. F., & Kirshner, R. P. 1985, ApJ, 299, 981, doi: 10.1086/163764
- Winkler et al. (2009) Winkler, P. F., Twelker, K., Reith, C. N., & Long, K. S. 2009, ApJ, 692, 1489, doi: 10.1088/0004-637X/692/2/1489
- Wongwathanarat et al. (2013) Wongwathanarat, A., Janka, H. T., & Müller, E. 2013, A&A, 552, A126, doi: 10.1051/0004-6361/201220636
- Xi et al. (2020) Xi, L., Gaetz, T. J., & Plucinsky, P. P. 2020, arXiv e-prints, arXiv:2010.05095. https://arxiv.org/abs/2010.05095
- Xi et al. (2019) Xi, L., Gaetz, T. J., Plucinsky, P. P., Hughes, J. P., & Patnaude, D. J. 2019, ApJ, 874, 14, doi: 10.3847/1538-4357/ab09ea
- Yoon et al. (2017) Yoon, S.-C., Dessart, L., & Clocchiatti, A. 2017, ApJ, 840, 10, doi: 10.3847/1538-4357/aa6afe
We include here plots showing the total system throughput of the various HST instrument + filter configurations used to image the O-rich ejecta of E0102.