Direct Observation of Collective Electronuclear Modes About a Quantum Critical Point
Abstract
We directly measure the low energy excitation modes of the quantum Ising magnet LiHoF4 using microwave spectroscopy. Instead of a single electronic mode, we find a set of collective electronuclear modes, in which the spin- Ising electronic spins hybridize with the bath of spin- Ho nuclear spins. The lowest-lying electronuclear mode softens at the approach to the quantum critical point, even in the presence of disorder. This softening is rapidly quenched by a longitudinal magnetic field. Similar electronuclear structures should exist in other spin-based quantum Ising systems.
Quantum phase transitions (QPTs) are zero temperature transitions whose critical behavior and fluctuation spectra reveal fundamental properties of technologically useful electronic, magnetic, and optical materials. Canonical examples hertz76 include the ferromagnet-paramagnet transition in metals, and the quantum Ising model, which describes a set of mutually interacting spin- systems in an ‘easy axis’ crystal field, with quantum fluctuations controlled by an effective field perpendicular to the easy axis. Many systems in physics and elsewhere can be mapped to the Ising model in transverse field jurkevic17 ; nishimori96 ; aspuruG20 ; suzuki13 ; recent interest has focused on quantum computing applications lidar18 ; bollinger16 ; lukin17 ; johnson21 . The model is predicted hertz76 to have a single spin wave collective mode, whose energy softens to zero exactly at the quantum critical point (QCP).
Although theory predicts that the soft mode must exist, it has never actually been seen near the QCP in any real Ising spin system. One reason for this is defects and paramagnetic impurities, which have a profound effect on QPTs ji21 . Nuclear spins have a more subtle effect. Many experiments on crystals of transition metal-based magnetic molecules, both in the quantum relaxation regime villain , and the high field, low- regime where spin waves can propagate taka11 , show that the nuclear spins act as a slowly fluctuating random field PS98 , which destructively scatters any soft electronic collective mode.
Rare earth quantum Ising systems have much stronger hyperfine fields, with obvious effects in, e.g., LiHoxY1-xF4 rosenbaum ; giraud ; girvin04 . Theory then suggests moshe05 ; ryan18 that the pure LiHoF4 system actually should have 15 coherent electronuclear modes. Instead of scattering the electronic mode, the spin- Ho nuclear spins hybridize with it to create these modes; similar hybridization has been observed in transition-metal antiferromagnets such as CsMnI3 Prozorova97 . Nonetheless, previous neutron experiments looking for collective modes in this system aeppli05 (where there is clear evidence for quantum critical scaling near the QCP LiHo-QCP ) found only a gapped electronic mode, and no soft mode.
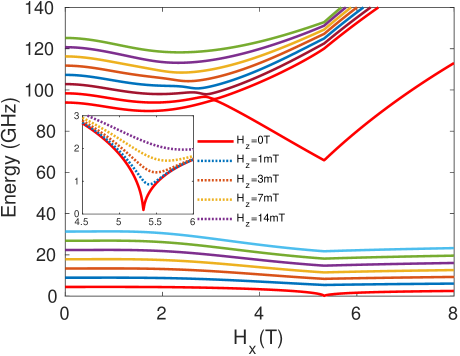
The previous theory moshe05 ; ryan18 is easily generalized to include the effects of finite and a small applied longitudinal field suppInfo . Salient features, illustrated in Fig. 1, include (i) the splitting into upper and lower groups; (ii) the softening of the lowest mode to zero energy when , the transverse field at the QCP; and (iii) the extreme sensitivity of this soft mode to any longitudinal field , which immediately gaps the soft mode around the QCP (Fig. 1). This last feature has not been discussed previously, and will be of key importance.
Here we describe an experiment on a crystalline sample of LiHoF4, of rectangular prism shape (dimension ), at temperature mK, well below the splitting mK between adjacent Ho hyperfine levels. Instead of neutrons, microwave spectroscopy was used, in the frequency range GHz, to measure AC absorption as a function of , , and applied transverse field . A resonator structure is required to amplify the applied ac signal. In order to obtain a high quality factor and field homogeneity, we adopted a tunable loop-gap resonator (LGR) design wood84 ; libersky19 ; suppInfo . The resonant frequencies are tuned by varying the gap capacitance, via partial or complete filling with pieces of sapphire wafer. The incident power level was restricted to W (-30 dBm) at the resonator. At this level, sample heating was negligible and the sample was well into the linear response regime.
The spectral weight of the soft mode is predicted to be strongest in the configuration moshe05 ; ryan18 . This counter-intuitive result is a crystal field effect, and is one reason why the mode was not seen in previous experiments kovacevic16 . In our setup the resonator and sample are oriented with the AC probe field along the Ising -axis, a solenoid along the transverse -axis, and a split coil along the -axis. In this geometry, crystal fields reduce the AC soft mode absorption along to zero at the QCP. In the configuration the zero mode spectral weight is predicted to diverge ryan18 at the critical point when ; this prediction also holds at the temperatures in our experiment suppInfo . However, when one calculates the transmission coefficient that we measure, this divergence is cancelled by a related divergence in the damping of the magnetopolariton mode formed by the coupling of photons to the soft mode suppInfo , where it is also shown that an applied longitudinal field only weakly affects this cancellation. The cancellation mechanism which leads to the strong suppression of the zero mode in our experiment is reminiscent of cancellation mechanisms in, e.g., the Kondo and spin-boson modelsleggett87 ; it also can be related indirectly to the “light-matter decoupling” which is hypothesized to exist in cavities suppInfo ; liberato14 .
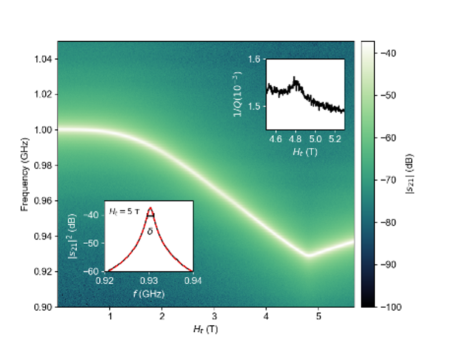
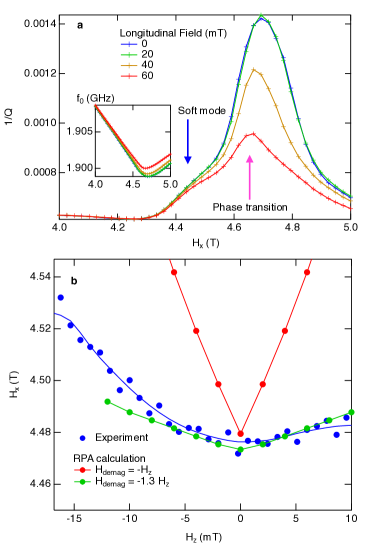
Results and Analysis: Figs. 2 and 3 show the measured transmission of single-crystal LiHoF4 in LGRs tuned to different resonant frequencies at T= 55 mK. When the resonant frequency coincides with the soft mode frequency , absorption is enhanced, giving a peak in the resonator inverse quality factor (insets). In Fig. 2 the resonator is tuned to the lowest accessible MHz. In this regime, the field-dependent evolution of the cavity resonant frequency is driven primarily by the change in the static susceptibility of the LiHoF4 crystal. By varying we track the soft mode close to the QCP. In Fig. 3 we probe this mode at higher and find two peaks bracketing the 4.8 T QCP, demonstrating that the mode does persist as expected into the paramagnetic phase.
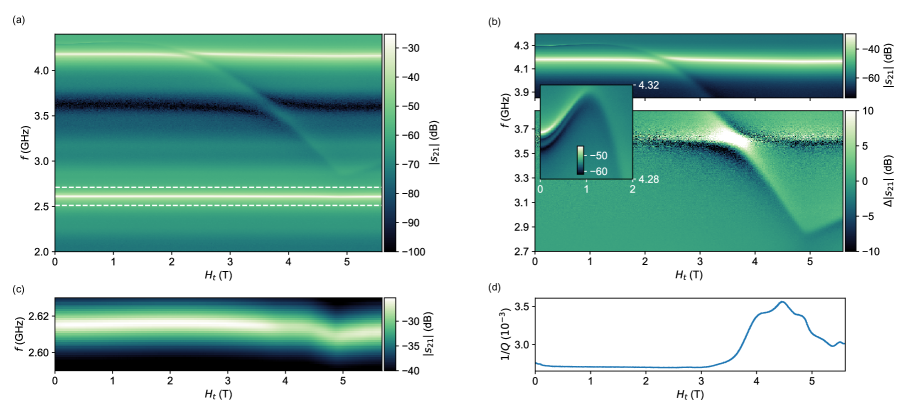
When GHz, the collective mode-cavity mode coupling is strong enough for detection well away from the cavity resonant frequencies (Fig. 3 (a,b)). We ought to then observe transitions between all the collective modes, at frequencies equal to their energy differences. We use a linear combination of absorptive and dispersive Lorentzian lineshapes, to extract the frequencies and linewidths of these transitions. Near the cavity resonance at 4.2 GHz, the spectra were fit to a coupled oscillator model schuster10 ; huebl13 ; the apparent avoided level crossing at 3.6 GHz is an anti-resonance in the LGR response.
We plot in Fig. 4 the measured (top) and theoretically expected (bottom) transition energies. The blue points are derived from on-resonance measurements such as those shown in Figs. 2 and 3(c,d); the orange curve comes from the broadband measurement shown in Fig. 3(b). We note that it is essential to do a finite- RPA calculation since both the transition energies and their spectral weights differ from their values. At mK, which corresponds to 1.15 GHz, one expects multiple transitions between thermally excited electronuclear states suppInfo .
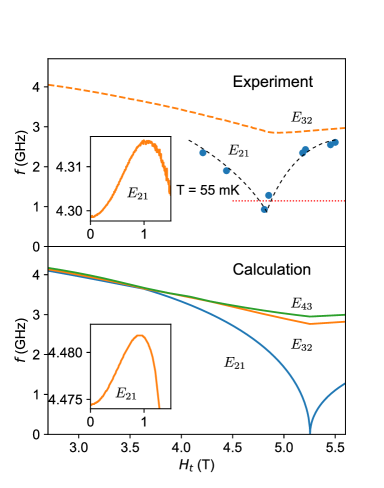
At low transverse field, the three lowest excitation modes are essentially degenerate, resulting in a single curve. The insets to Fig. 4 show this behavior; the non-monotonic field dependence of the measured mode is accurately predicted by the model. The RPA calculations overestimate the critical field, primarily due to the absence of mode-mode couplings in the RPA (which, although individually small, have a cumulative effect on the critical field ryan18 ).
The theoretical result that any applied longitudinal field will gap the soft mode means the domain structure and demagnetization field will play a defining role. In LiHoF4 the electronic spin dipolar interaction is much larger than the superexchange interaction. One then expects many Ising domains, with thin low-energy domain walls and an almost uniform demagnetization field except very near the boundaries. This theoretical expectation is confirmed by the observation of micron-sized domains in optical Kerr and Faraday rotation experiments battison75 ; pommier88 ; meyer89 . The precise structure of the domains kooy60 ; gabay85 is then not crucial: what matters is the relation between the mean magnetization density and the demagnetization field. If we model the system as a thick plate, then at zero wavevector, the soft mode is only affected by the average demagnetization field, which we incorporate into the RPA via an effective demagnetizing factor suppInfo .
In all the experiments, hysteresis effects were small (in the absence of pinning from impurities, pure LiHoF4 is a soft ferromagnet). In order to have a well-defined initial state, we defined a magnetic field sweep protocol that always started in the paramagnetic state (with initial T, and ). We then applied a longitudinal field mT, lowered to the desired value, and measured the resonator spectra for a series of longitudinal fields.
This protocol is repeated for a series of transverse fields and the resultant mesh of absorptions is plotted in Fig. 5(a). We see strong absorption at a critical value of the transverse field for which the lowest energy excitation has a minimum (similar to critical opalescence). The softening is cut off by , substantially suppressing the peak amplitude. Below the critical value of , we also see resonant absorption where the soft mode is degenerate with the cavity mode. The minimum in the soft mode is then lifted by , suppressing its absorption, and reducing the cavity .
Fig. 5(b) compares theory and experiment for the transverse field location of the soft mode minimum at 1.9 GHz. Two theoretical curves are shown. In the first, the average demagnetization field is assumed equal and opposite to (appropriate to zero energy domain walls). This soft mode minimum has a sharper dependence on than seen in experiment. In the second, a finite domain wall energy is assumed. This increases kooy60 . Micron-sized stripe domains in thin samples of LiHoF4 indicate a domain wall energy (which will vary with , and ). The actual domain structure will be more complicated (e.g., branching in thick samples pommier88 ; gabay85 ), but still will increase . Assuming (second theoretical curve) yields a good match to the data in Fig. 5(b).
Discussion: The close agreement of theory with experiment indicates that weakly-coupled RPA electronuclear modes represent the true collective degrees of freedom unusually well. Special conditions are required to observe the soft mode: the net longitudinal field in the sample must be homogeneous and zero; we need to measure ; and we need to go to low . The RPA theory indicates that any net will gap the soft mode.
We can also now identify the gapped mode seen in previous neutron scattering experiments on LiHoF4 aeppli05 as the single electronuclear state that splits off from the upper group of modes shown in Fig. 1. RPA calculations correctly predict the measured energy of this mode as a function of , and also predict it to be the only mode with significant spectral weight at these energies.
There are many systems in which quantum Ising spins couple to both static and dynamic “defect” modes (spin impurities, two-level systems, nuclear spins, etc.). One example of current interest is in quantum computation. In adiabatic quantum computation the system moves slowly through a QCP lidar18 such that two-level systems (TLS) are predicted to strongly affect the behavior amin . Our results, taken together with previous results on molecular magnet crystals, suggest the following general picture:
(i) When the coupling to these defect modes is weak (as for nuclear spins in transition metal-based molecular magnetic systems like Fe8, Mn12, V15, etc.), for nuclear spins acting on spin qubits in semiconductors morello , or TLS defects weakly coupled to superconductors simmons04 ), then hybridization will be disrupted unless one can go to extremely low . Experiments will then see quantum relaxation of the Ising spins, and no coherent collective modes. To suppress strong decoherence in the Ising spin (qubit) dynamics one must then raise the characteristic qubit operating frequency of these qubits (using, for example, a strong magnetic field taka11 ).
(ii) When the coupling is strong (as for nuclear spins in LiHoF4 and other rare earth systems, or for some junction TLS defects in superconductors simmons04 ), Ising spin/defect hybridization can occur. If the system is translationally invariant (as in LiHoF4) we then expect coherent hybridized collective modes, one of which will go soft at the QCP. The defects no longer cause decoherence for the Ising spins (qubits), but instead act in concert with them.
Until now there has been no experimental evidence for these coherent modes around a QPT suhlN . It remains of considerable interest to investigate and experimentally manipulate them in a variety of magnetic quantum Ising systems. We see that field sweeps through a QPT in adiabatic quantum computing can no longer be regarded as a simple 2 level-avoidance process - one must consider all of the collective modes. Since many such materials are promising candidates for solid-state qubit realizations bertaina07 ; morley13 ; pedersen16 , these collective modes must be characterized fully.
Acknowledgements: The experimental work at Caltech was supported by US Department of Energy Basic Energy Sciences Award DE-SC0014866. P.C.E.S. acknowledges support at Caltech from Simons Foundation Award 568762 and National Science Foundation Award PHY-1733907. Theoretical work at UBC was supported by the National Sciences and Engineering Research Council of Canada.
References
- (1) J. A. Hertz, Phys. Rev. B14, 1165 (1976).
- (2) P. Jurkevic et al., Phys. Rev. Lett. 119, 080501 (2017)
- (3) H. Nishimori and Y. Nonomura, J. Phys. Soc. Jpn. 65, 3780 (1996).
- (4) S. McCardle, S. Endo, A. Aspuru-Guzik, S.C. Benjamin, X. Yuan, Rev. Mod. Phys. 92, 015003 (2020)
- (5) S. Suzuki, J.-i. Inoue, B. K. Chakrabarti, “Quantum Ising Phases and Transitions in Transverse Ising Models”, Lecture Notes in Physics, Vol. 862 (Springer, 2013)
- (6) T. Albash, D. A. Lidar, Rev. Mod. Phys. 90, 015002 (2018).
- (7) J.G. Bohnet et al., Science 352, 1297 (2016)
- (8) H. Bernien et al., Nature 551, 579 (2017)
- (9) A.D. King et al., Nature Comm. 2021:12.1113 (2021).
- (10) See H. Ji, H. Liu, H. Jiang, X.C. Xie, Adv. Phys. X 6, 1884133 (2021), and refs. therein.
- (11) D. Gatteschi, R. Sessoli, J. Villain, “Molecular Nanomagnets”, Oxford Univ. Press (2006)
- (12) S. Takahashi et al., Nature 476, 76 (2011)
- (13) N. V. Prokof’ev, P.C.E. Stamp, Phys. Rev. Lett. 80, 5794 (1998); N.V. Prokof’ev, P.C.E. Stamp, Rep. Prog. Phys.
- (14) H.M. Ronnow et al., Phys. Rev. B75, 054426 (2007)
- (15) R. Giraud, W. Wernsdorfer, A. M. Tkachuk, D. Mailly, B. Barbara, Phys. Rev. Lett. 87, 057203 (2001).
- (16) P. B. Chakraborty, P. Henelius, H. Kjonsberg, A. W. Sandvik, S. M. Girvin, Phys. Rev. B70, 144411 (2004)
- (17) M. Schechter, P. C. E. Stamp, Phys. Rev. Lett. 95, 267208 (2005)
- (18) R. D. McKenzie, P. C. E. Stamp, Phys. Rev. B97, 214430 (2018).
- (19) L. A. Prozorova, S. S. Sosin, D. V. Efremov, S. V. Petrov, JETP 85 1035 (1997)
- (20) H. M. Ronnow et al., Science 308, 389 (2005)
- (21) D. Bitko, T. F. Rosenbaum, and G. Aeppli, Phys. Rev. Lett. 77, 940 (1996)
- (22) See Supplementary information, which includes Refs. Mennenga –AJL84
- (23) R. L. Wood, W. Froncisz, J. S. Hyde, J. Magnetic Resonance 58, 243 (1984).
- (24) M. M. Libersky, D. M. Silevitch, and A. Kouki, in 2019 22nd International Conference on the Computation of Electromagnetic Fields (COMPUMAG) (2019), pp. 1–4.
- (25) I. Kovacevic et al., Phys. Rev. B94, 214433 (2016).
- (26) A.J. Leggett et al., Rev. Mod. Phys. 59 1 (1987).
- (27) S. de Liberato, Phys. Rev. Lett. 112, 016401 (2014)
- (28) D. I. Schuster et al., Phys. Rev. Lett. 105, 140501 (2010)
- (29) H. Huebl et al., Phys. Rev. Lett. 111, 127003 (2013)
- (30) J. Battison, A. Kasten, M. Leask, J. Lowry, B. Wanklyn, J. Phys. C8, 4089 (1975).
- (31) J. Pommier, P. Meyer, J. Ferr, and I. Laursen, J. de Physique C8, 1949 (1988).
- (32) P. Meyer, J. Pommier, and J. Ferr, SPIE Electro-Optic and Magneto-Optic Materials and Applications 1126, 93 (1989).
- (33) C. Kooy, U. Enz, Philips Research Reports 15, 7 (1960).
- (34) M. Gabay, T. Garel, J. de Physique Lett. 45, L (1985)
- (35) A. T. S. Wan, M. H. S. Amin, S. X. Wang, Int. J. Quant. Inf. 7, 725 (2009); D. S. Wild, S. Gopalakrishnan, M. Knap, N. Y. Yao, M. D. Lukin, Phys. Rev. Lett. 117, 150501 (2016)
- (36) W. Yang, W.-L. Ma, R.-B. Liu, Rep. Prog. Phys.80, 016001 (2017)
- (37) K.B. Cooper et al., Phys. Rev. Lett. 93, 180401 (2004)
- (38) Note that propagating electronuclear modes of the Suhl-Nakamura type (cf. H. Suhl, Phys. Rev. 109, 606 (1958), T. Nakamura, Prog. Th. Phys. 16, 23 (1958)) have been studied for many years in ordered magnetic systems. The key difference here comes from the QPT, where one of these modes softens and is extremely sensitive to any longitudinal field.
- (39) S. Bertaina et al., Nature Nanotech 2, 39 (2007).
- (40) G. W. Morley et al., Nature Materials 12, 103 (2013).
- (41) K. S. Pedersen et al., J. Am. Chem. Soc. 138, 5801 (2016)
- (42) G. Mennenga, L. J. de Jongh, W. J. Huiskamp, J. Magn. Magn. Mat. 44, 59 (1984)
- (43) M. Harder, LiHui Bai, C. Match, J. Sirker, CanMing Hu, Science China, Phys. Mech. Astron. 59, 117511 (2016)
- (44) J. W. Rao, S. Kaur, X. L. Fan, D. S. Xue, B. M. Yao, Y. S. Gui, C.-M. Hu, Appl. Phys. Lett. 110, 262404 (2017)
- (45) R.P. Feynman, F.L. Vernon, Ann. Phys. (NY) 24, 118 (1963)
- (46) A.O. Caldeira, A.J. Leggett, Ann. Phys. (NY) 149, 374 (1983)
- (47) P. Kirton, M. Roses, J. Keeling, E.D. Torre, Advanced Quantum Technologies pp. 1-18 (2018)
- (48) K. Rzazewski, K. Wodkiewicz, W. Zakowicz, Phys. Rev. Lett. 35, 432 (1975)
- (49) A.J. Leggett, Phys. Rev. B30, 1208 (1984)