Zenodo \conferenceThe 20.5th Cambridge Workshop on Cool Stars, Stellar Systems, and the Sun \conferencedate2021 \absSuperflares on giant stars have up to 100,000 times more energy than the high energy solar flares. However, it is disputed, whether scaling up a solar-type dynamo could explain such a magnitude difference. We investigate the flaring activity of KIC 2852961, a late-type spotted giant. We seek for flares in the Kepler Q0-Q17 datasets by an automated technique together with visual inspection. Flare occurence rate and flare energies are analyzed and compared to flare statistics of different targets with similar flare activity at different energy levels. We find that the flare energy distribution of KIC 2852961 does not seem to be consistent with that of superflares on solar-type stars. Also, we believe that in case of KIC 2852961 spot activity should have an important role in producing such superflares.
KIC 2852961 – a superflaring red monster in the Kepler field
††editors:1 Introduction
The high magnetic energy outbursts by flares originate from magnetic reconnection, which presumes an underlying dynamo action, when rotation interferes with convective motions. The most powerful superflares releasing 106 times more energy than the largest X-class solar flares are from red giants (Balona, 2015). However, after the main sequence, at the red giant branch, slowed down rotation and increased size are expected to result in weaker magnetic fields and therefore lower level of magnetic activity. Then what kind of mechanism could provide sufficient energy for the most powerful superflares on giant stars? In fact, magnetic activity can indeed be strong along the red giant branch, which recently has been verified by direct imaging of large starspots (Roettenbacher et al., 2016). Lehtinen et al. (2020) demonstrated that a common dynamo scaling can be achieved for late-type main sequence and giant stars only when both stellar rotation and convection are taken into account. This infers that magnetic dynamo action related flares in solar-type stars and superflares, for instance, in late-type giants can be linked by scaling.
In this study we analyse the full Kepler data of the spotted red giant star KIC 2852961 (2MASS J19261136+3803107, TIC 137220334) in order to unravel the relationship between spot activity and flare energies. The astrophysical properties of KIC 2852961 have recently been revised by Kővári et al. (2020) using all the available ground based and space-borne observations and spectroscopic data. The stellar parameters of the red giant are summarized in Table 1.
| Parameter | Value |
|---|---|
| Spectral type | G9-K0 III |
| Photometric period [d] | |
| [K] | |
| Radius [] | |
| [cgs] | |
| Mass [] | |
| Distance [pc] | |
| [mag] | |
| Luminosity [] | |
| Metallicity [Fe/H] | |
| [km s-1] | 17.5 |
| Inclination [∘] |
2 The Kepler light curve of KIC 2852961
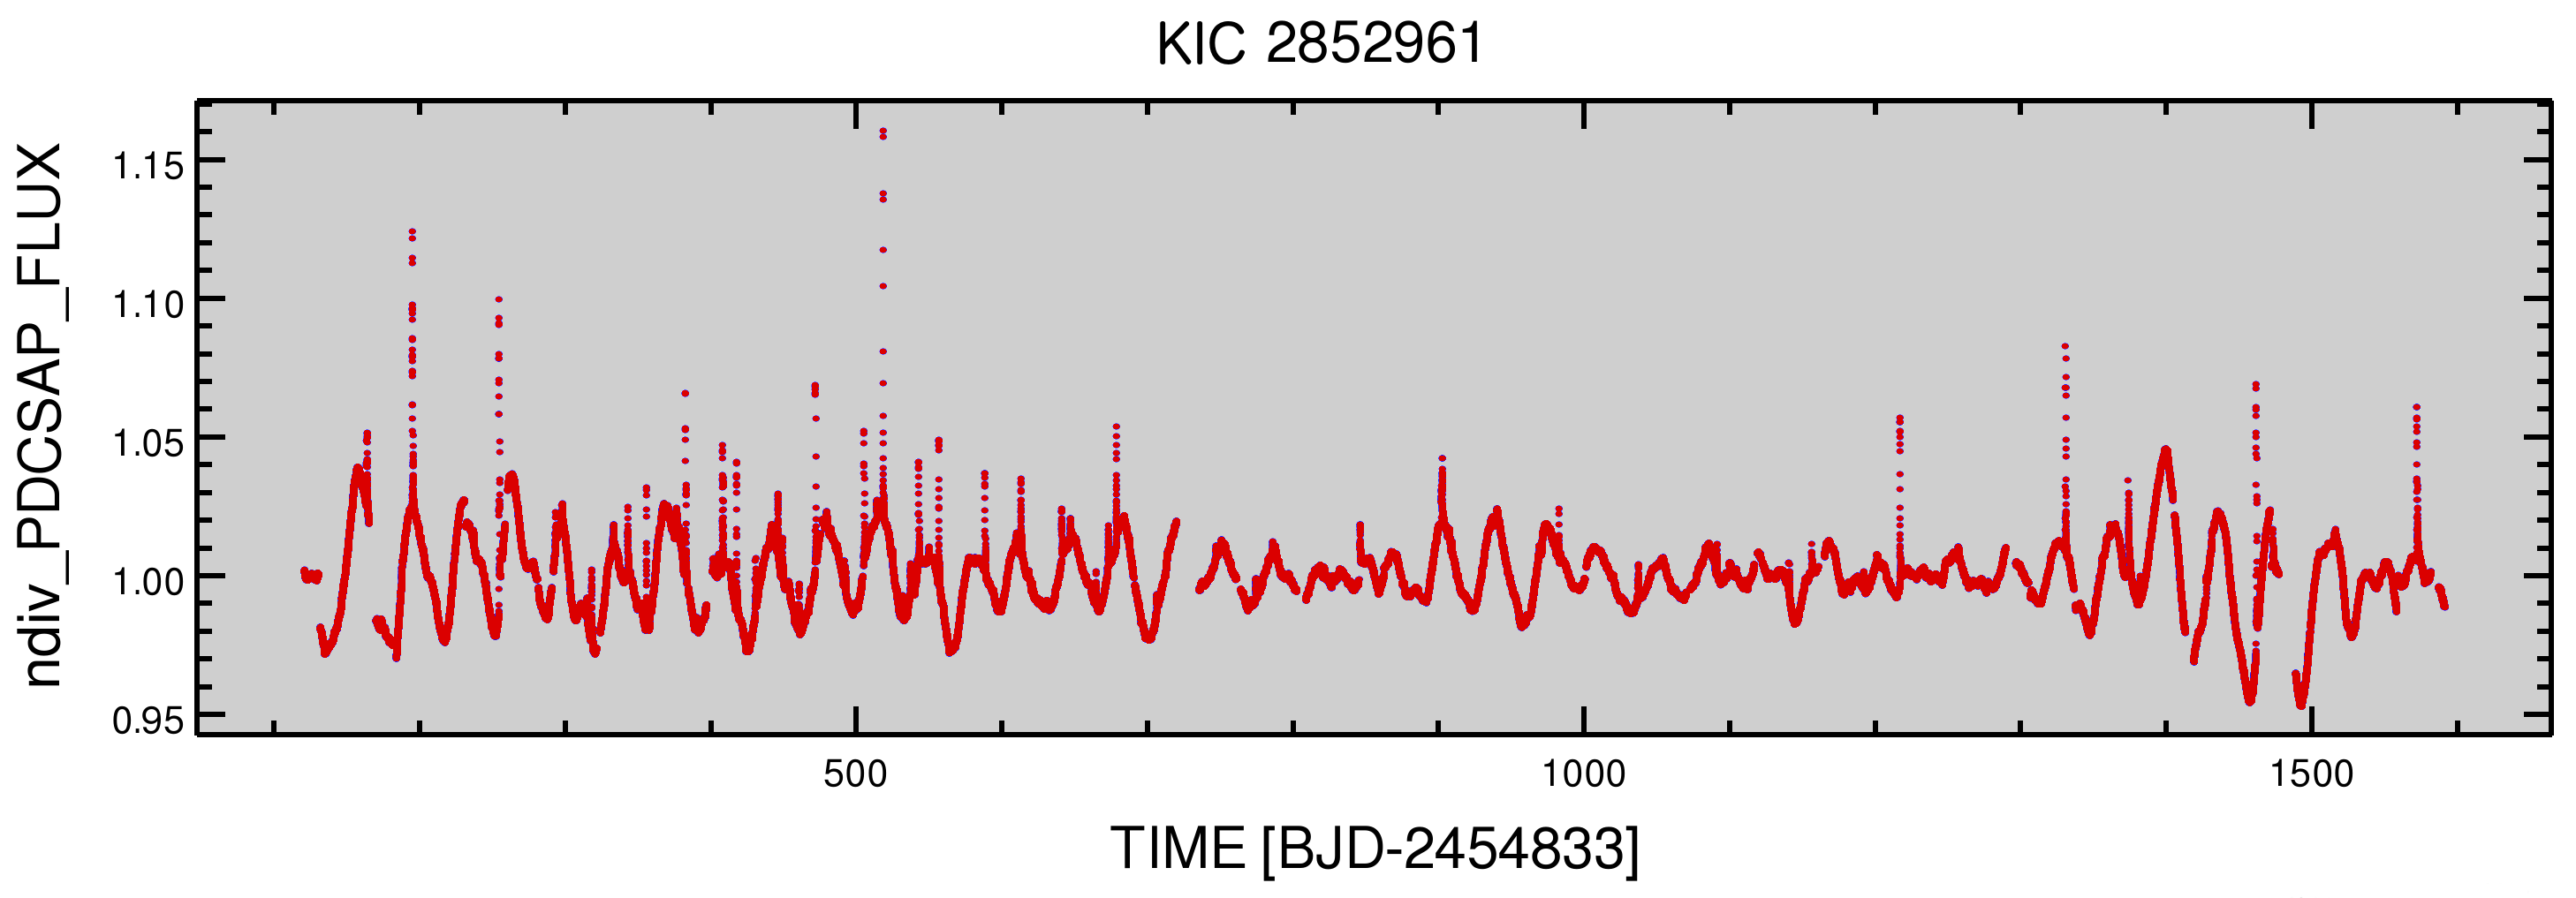
The 18 long cadence Kepler light curves of KIC 2852961 were collected between BJD 2454953.5–2456424.0. The normalized data are plotted in Fig. 1, indicating the rotational modulation of 35.5 days due to spots together with strong flare activity. The light curve has three well defined phases: the first part until BJD=700 (+2454833) with large amplitudes and a lot of energetic flares, the second part from BJD=700 to 1300 with small amplitude and less/less energetic flares, while the third part from BJD=1300 until the end of the dataset with large amplitudes and some energetic flares.
3 A superflaring monster
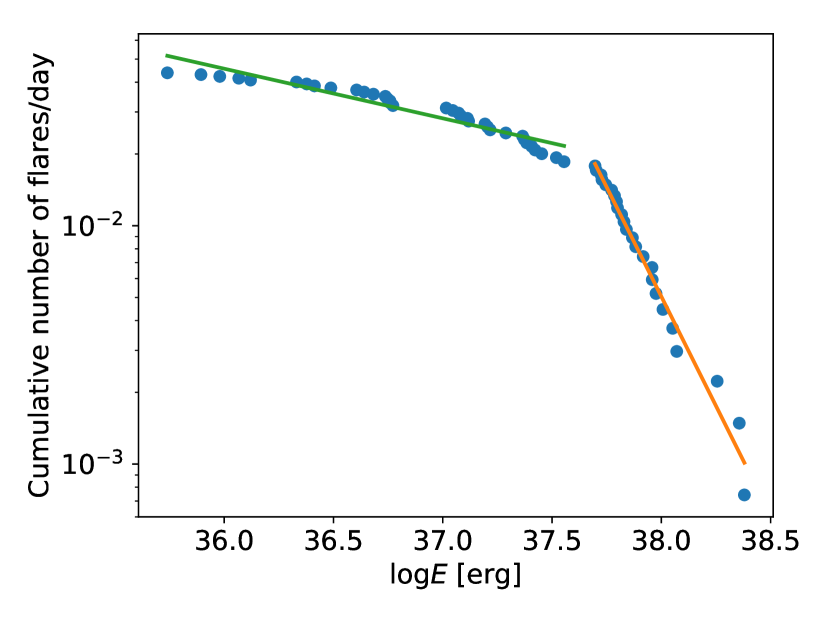
Flares in the Kepler light curve of KIC 2852961 were detected using an automated technique. We applied an updated version of the flare detection pipeline from Günther et al. (2020). To confirm the result we checked the events by visual inspection as well. At the end we confirmed 59 flare events. For each events we calculated flare energies (Kővári et al., 2020). The resulting energy values span over three orders of magnitude, ranging between and ergs. From the flare energies we constructed the cumulative flare frequency distribution, which is shown in Fig. 2 where flare energies follow a broken power-law. In this log-log representation the slope of a linear fit is usually defined as . The linear fit to the high energy end over the range E51037 erg ("superflare part"; orange line) results in =2.84, which is significantly higher than that derived for flaring dwarf stars (e.g. Howard et al., 2018; Paudel et al., 2018; Ilin et al., 2019; Yang & Liu, 2019, etc.). If the E51037 erg energy range is fitted (say "normal flares"; see the green line in Fig. 2) we get =1.20. This broken distribution has observed in dwarf stars as well, however, with breakpoints at lower energies. According to the model by Mullan & Paudel (2018) the breakpoint is interpreted as "critical energy": when reaching this critical energy, the characteristic flare loop size becomes higher than the local scale height depending on the local field strength and density. This breakpoint, however, is different from star to star, and is not necessarily included in the interval of the actual flare energies.
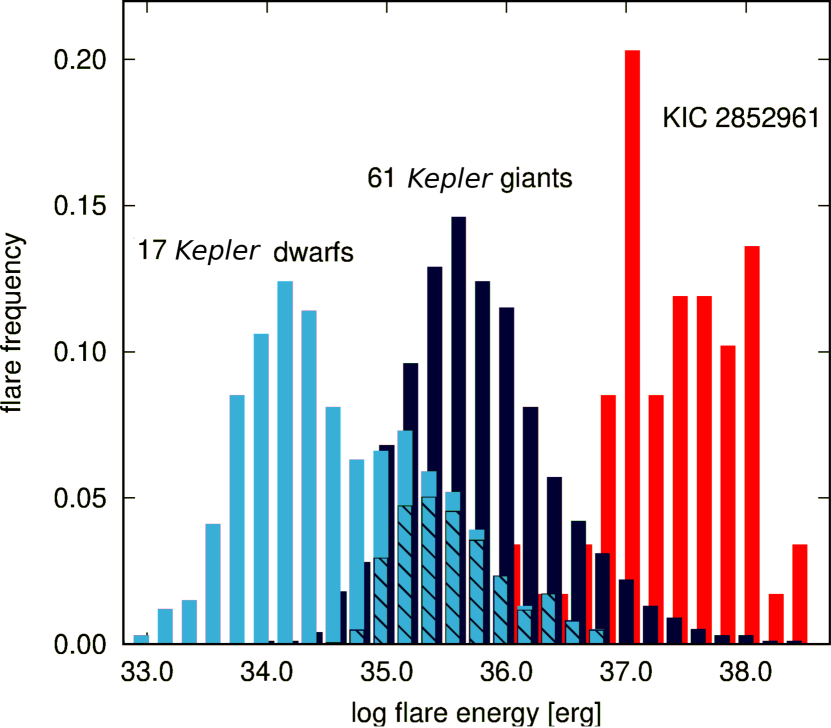
In Fig. 3 the flare energy histogram of KIC 2852961 is compared to those of 17 dwarf (including two subgiants) and 61 giant stars from the Kepler field. In this comparison KIC 2852961 appears as a superflaring red monster with its extremely energetic flares.
4 The energy source of superflares
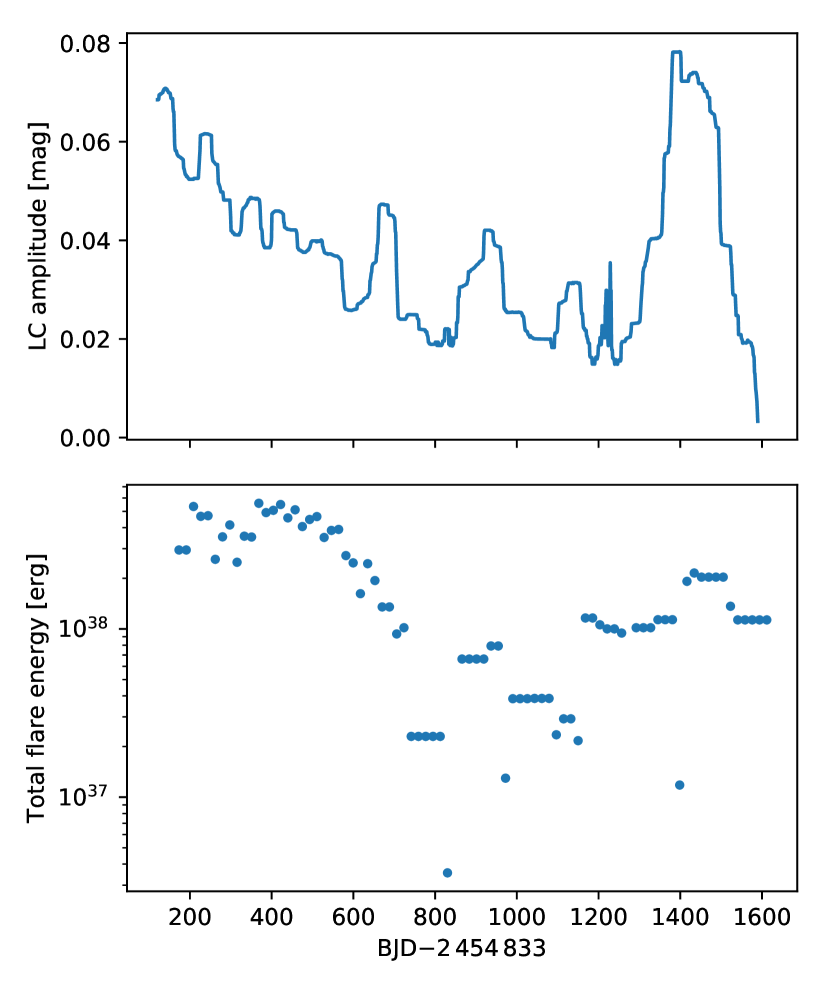
As seen in Fig. 1 during the first term of the whole Kepler mission KIC 2852961 performed large amplitude rotational modulation with a lot of energetic flares. In the middle of the term the amplitude was getting smaller and the flares were getting less powerful and occurred less frequently; at the end of the term the amplitude increased again while flares were more powerful again. In Fig. 4 we plot the moving average of the overall amplitude change of the light curve cleaned from flares, together with the total flare energy (with applying a boxcar of 3). Beyond question, there is a correlation between the rotation amplitude (as an indicator of magnetic activity) and the overall magnetic energy released by flares. This suggests a general scaling effect behind the production flares in the sense that there are more/more energetic flares when having more/larger active regions on the stellar surface and the flare activity is lower when there are less/smaller active regions. This is in agreement with the finding of Maehara et al. (2017, see their Figs. 6-8), who demonstrated how the flare-frequency distribution changes with spot sizes on the Sun and stars: with increasing spot area increasing flare-frequency was found at a certain energy level.
Balona (2015) studied Kepler flare stars of different luminosities and found that higher luminosity class stars, including giants, have generally higher energy flares. This finding (Balona, 2015, see Fig. 10 in that paper) is attributed by the author to a scaling effect, i.e., in the larger active region of a larger star more energy can be stored from the same magnetic field strength, i.e., differences in flare energies of different luminosity class targets are very likely due to size effect.
Taking K and , maximum relative amplitude from the Kepler light curve yields a maximum spot coverage (spot size) of (see Eq. 3 in Notsu et al., 2019). Assuming kG as a reasonable value of the average magnetic flux density in the spot (cf. Notsu et al., 2019), according to the equation in Shibata & Magara (2011, see their Eq. 1), in the case of KIC 2852961 the maximum available magnetic energy is estimated to be at least erg. However, only a small part of this energy is available to foster flares because it is distributed as potential field energy. Nevertheless, this rough estimation, which is 15 times higher than the highest flare energies (see Kővári et al., 2020), is in fair agreement with the observed flare energies of KIC 2852961.
Acknowledgments
This work was supported by the Hungarian National Research, Development and Innovation Office grant OTKA K131508, KH-130526 and by the Lendület Program of the Hungarian Academy of Sciences, project No. LP2018-7/2019. Authors from Konkoly Observatory acknowledge the financial support of the Austrian-Hungarian Action Foundation (95öu3, 98öu5, 101öu13). M.N.G. acknowledges support from MIT’s Kavli Institute as a Torres postdoctoral fellow.
References
- Balona (2015) Balona, L. A. 2015, MNRAS, 447, 2714.
- Günther et al. (2020) Günther, M. N., Zhan, Z., Seager, S., Rimmer, P. B., Ranjan, S., et al. 2020, AJ, 159, 60.
- Howard et al. (2018) Howard, W. S., Tilley, M. A., Corbett, H., Youngblood, A., Loyd, R. O. P., et al. 2018, ApJ, 860, L30.
- Ilin et al. (2019) Ilin, E., Schmidt, S. J., Davenport, J. R. A., & Strassmeier, K. G. 2019, A&A, 622, A133.
- Kővári et al. (2020) Kővári, Z., Oláh, K., Günther, M. N., Vida, K., Kriskovics, L., et al. 2020, A&A, 641, A83.
- Lehtinen et al. (2020) Lehtinen, J. J., Spada, F., Käpylä, M. J., Olspert, N., & Käpylä, P. J. 2020, Nature Astronomy, 4, 658.
- Maehara et al. (2017) Maehara, H., Notsu, Y., Notsu, S., Namekata, K., Honda, S., et al. 2017, PASJ, 69, 41.
- Mullan & Paudel (2018) Mullan, D. J. & Paudel, R. R. 2018, ApJ, 854, 14.
- Notsu et al. (2019) Notsu, Y., Maehara, H., Honda, S., Hawley, S. L., Davenport, J. R. A., et al. 2019, ApJ, 876, 58.
- Oláh et al. (2020) Oláh, K., Kővári, Z., Günther, M. N., Vida, K., Gaulme, P., et al. 2020, arXiv e-prints, arXiv:2010.07623.
- Paudel et al. (2018) Paudel, R. R., Gizis, J. E., Mullan, D. J., Schmidt, S. J., Burgasser, A. J., et al. 2018, ApJ, 858, 55.
- Roettenbacher et al. (2016) Roettenbacher, R. M., Monnier, J. D., Korhonen, H., Aarnio, A. N., Baron, F., et al. 2016, Nature, 533, 217.
- Shibata & Magara (2011) Shibata, K. & Magara, T. 2011, Living Reviews in Solar Physics, 8, 6.
- Yang & Liu (2019) Yang, H. & Liu, J. 2019, ApJS, 241, 29.